Two 14–3 Teams, and 82 Points Between Them
The season opens tonight at Lumen Field, and it opens with a contradiction sitting in plain view. New England went 14–3 in 2025. Seattle went 14–3 in 2025. By the only measure most people will quote before kickoff, these teams are the same team. This site's frozen rating has them 81.8 points apart — Seattle first on the board at 1674.6, New England sixth at 1592.8 — which is a bigger gap than the one the model sees between Seattle and Buffalo, and it is the difference between a coin flip and a 68% game.
One of those two descriptions is wrong, and this page is about which, and why. The short answer is that the gap is inherited rather than earned. Across the 2025 season the model gave New England +201.3 rating points and Seattle +176.6 — the Patriots had the better year by the model's own arithmetic, by 24.7 points — and they still trail tonight, because they began 2025 rated 137.2 points behind after back-to-back 4–13 seasons. A rating with memory does not let you erase two bad years with one good one. Whether that memory is wisdom or dead weight is exactly what tonight starts to test.
The historical answer to the same question is less ambiguous than I expected. Across 328 games since 2010 in which the two teams carried identical records out of the previous season, the higher-rated side won 66.2% of the games where the gap sat between 80 and 120 points — tonight's bucket — and 78.9% where it exceeded 120. When the records agree and the rating disagrees, the rating has been right.
Where the Gap Actually Came From
The engine is walk-forward: it prices every game before it sees it, updates on the margin, and regresses a third of the way toward 1505 each August. Replaying it and stopping at four moments gives the whole accounting.
| Moment | New England | Seattle | Gap |
|---|---|---|---|
| Opening day, 2025 (after that August's regression) | 1393.1 | 1530.2 | 137.2 |
| End of the 2025 regular season, both 14–3 | 1594.4 | 1706.8 | 112.4 |
| After the postseason | 1636.7 | 1759.4 | 122.7 |
| The frozen 2026 board, August 12 | 1592.8 | 1674.6 | 81.8 |
Read the gap column downward. New England spent seventeen games closing it, from 137.2 to 112.4 — that 24.7-point improvement is the whole of the difference between the two teams' 2025s, and it belongs to the Patriots. January then widened it again by 10.2: both teams gained, New England 42.3 across four playoff games and Seattle 52.5 across three. Then the offseason haircut took a third of everything, which on a difference is simply a third of the difference: 122.7 × 2/3 = 81.8. The haircut page works through what that did to all 32 teams; here it is one line of arithmetic and it changes nothing about the ordering.
So of tonight's 81.8 points, none of it was built in 2025. All of it, and more, was already there in August 2025, and the season that followed made it smaller. That is a specific, checkable claim about a rating system's memory, and it is the honest frame for what most previews will describe as two evenly-matched 14–3 teams.
The Exhibit
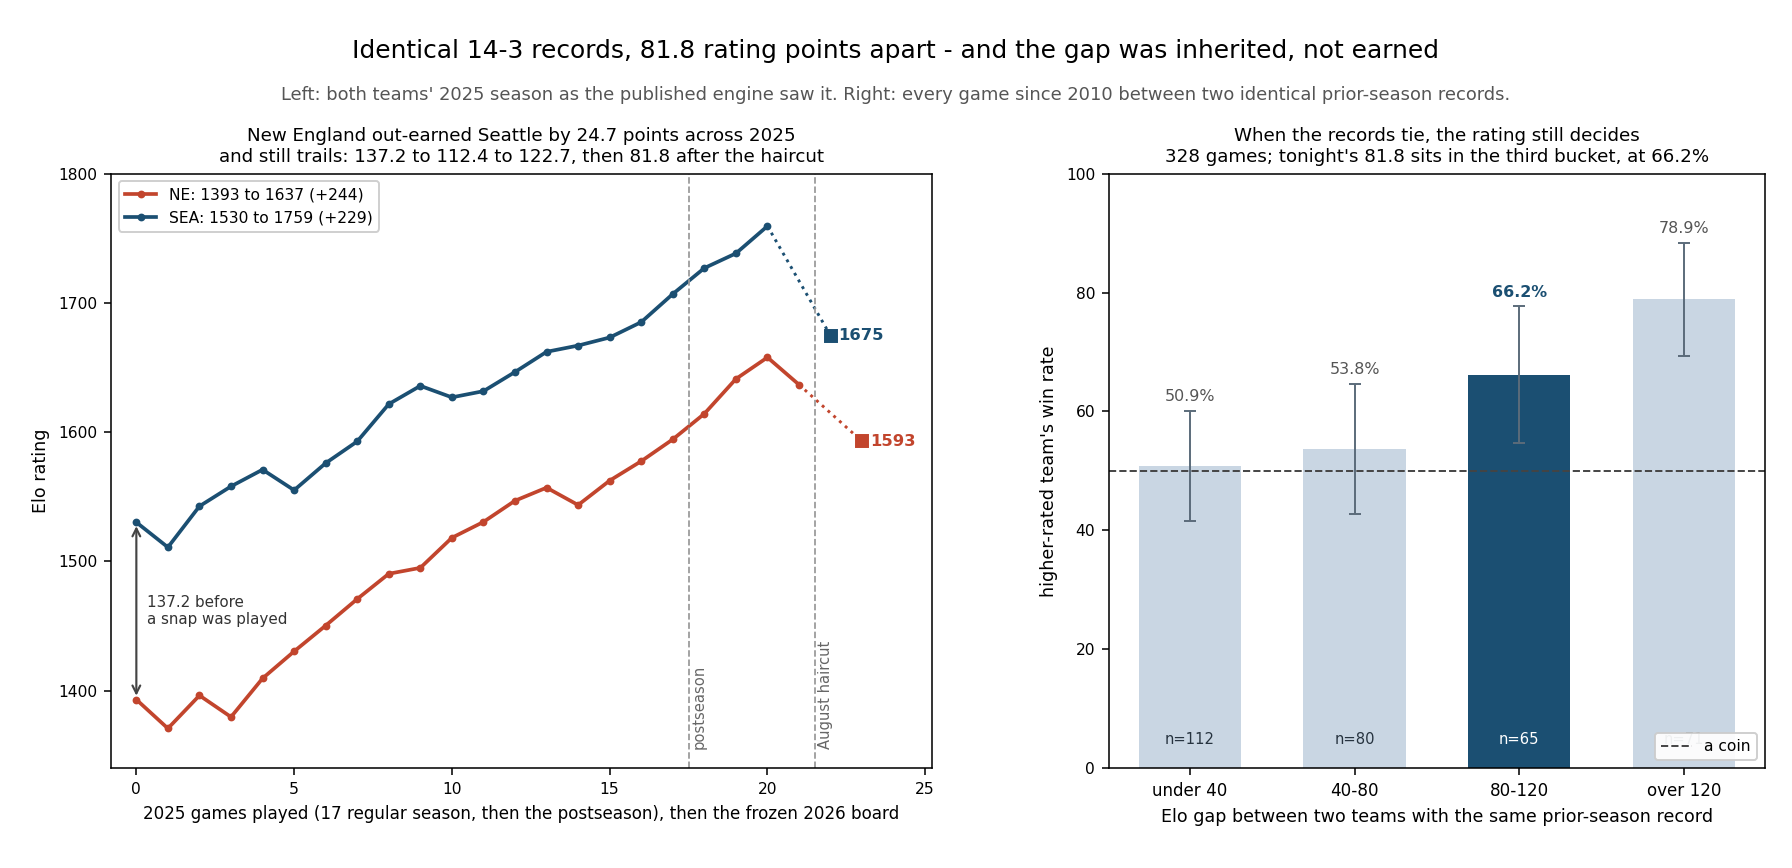
Two Identical Records, Two Different Seasons
Records round. Everything the model uses does not. The 2025 ledger, side by side:
| 2025 regular season | New England | Seattle |
|---|---|---|
| Record | 14–3 | 14–3 |
| Points for / against | 490 / 320 | 483 / 292 |
| Point differential (league rank) | +170 (3rd) | +191 (1st) |
| Average margin | +10.00 | +11.24 |
| Median margin | +6 | +8 |
| One-score games (8 points or fewer) | 10 of 17 | 9 of 17 |
| Average opponent rating at kickoff | 1454.3 | 1500.9 |
| Rating earned across the season | +201.3 | +176.6 |
Twenty-one points of differential separate them over seventeen games, which is 1.24 points a week — real, and nothing like 82 rating points. Seattle played the harder schedule by 46.6 rating points a game. New England won more of its games narrowly: ten one-score finishes against nine, a median margin of 6 against 8. All of that is worth something, and all of it together is worth less to the model than what happened in 2023 and 2024, when New England went 4–13 at −130 and then 4–13 at −128 while Seattle went 10–7. The Patriots' rating is still paying that bill. Seattle's is not.
Note also the direction of the schedule effect: because Elo pays more for beating better teams, Seattle's tougher slate is part of why the Seahawks stayed ahead at all. Strip the opponents out and New England's season looks better than Seattle's on the raw margin column — more points scored, a bigger point total — which is precisely the sort of thing a record cannot tell you and a rating can.
When the Records Tie, Who Has Been Right?
This is the test that matters, and it does not depend on believing anything about these two teams. Take every regular-season game the engine has graded since 2010 in which both teams walked out of the previous season with exactly the same record. There are 328 of them. By the records alone, all 328 are coin flips. They are not:
- The model picks them at .6220, against .6458 across all its graded games, with a Brier score of .2263 where a coin scores .2500.
- The market prices them at an average of 4.60 points, not pick'em, and its favourite wins 64.8% of them straight up.
- Home teams win 52.7% — below the file's usual 56.05%, because in a same-record matchup the home side is as often the weaker team as the stronger one.
And the size of the disagreement is what does the work:
| Elo gap, two identical records | Games | Higher-rated team wins | 95% interval |
|---|---|---|---|
| Under 40 points | 112 | .5089 | .416 – .602 |
| 40 to 80 | 80 | .5375 | .428 – .647 |
| 80 to 120 — tonight's bucket | 65 | .6615 | .546 – .777 |
| Over 120 | 71 | .7887 | .694 – .884 |
Four buckets, rising monotonically, and the third clears .500 by 2.75 standard errors. A rating gap under 40 points between two same-record teams is worth nothing at all — .5089 on 112 games is the purest coin flip in this file. A gap the size of tonight's has been worth about two wins in three.
Narrow it to tonight's exact configuration — same record, and the better-rated team at home by 80 or more — and there are 65 such games since 2010. The home team won 80.0% of them, by an average of 9.37 points. Two cautions on that number, both of which matter. First, the market made those games an average of 7.13 points, roughly double tonight's 3.5, so the bucket is dominated by mismatches larger than this one. Second, against the number those same games went 33–30, which is a coin: the effect is real in the win column and fully priced in the spread column. That distinction is the whole difference between a forecast and a bet.
How Rare Tonight Is
Of the 429 season openers in the file from 2000 through this one, exactly three have paired two teams that each won 13 or more games the previous season: Chicago at San Diego in 2007 (13–3 against 14–2), San Francisco at Green Bay in 2012 (13–3 against 15–1), and tonight. Tonight is the first of the three in which the two records are identical, which makes it the best-matched opener on record by the crudest possible measure and, by the model's, one of the least even.
Widen the filter to twelve wins and there are seventeen such openers, three of them on this year's board alone — New England at Seattle, San Francisco at the Rams in Melbourne, and Buffalo at Houston. Fourteen of the seventeen have been played, and the home team is 8–6 in them. Identical prior records, of any quality, describe 41 of the 429 openers.
The other rarities of this particular game — the Wednesday kickoff, the eight-meeting series history, the fact that it is a Super Bowl rematch — are covered on their own pages: Opening Night 2026 for the series and the calendar, and the rematch census for what has happened to the other six sequels since 1999. This page deliberately stays off that ground and stays on the ratings.
The Model Against the Market, Tonight
The schedule file carries the market's numbers for this game: Seattle −3.5, a total of 44.5, moneylines of +170 and −205. Those two prices imply .3704 and .6721, which sum to 1.0425 — a 4.25% hold — and normalising them makes Seattle 64.5% vig-free. The model, frozen on August 12, says 67.9%. Three and a half points of probability apart, with the model the more confident of the two.
In points, using the exchange rate fitted for yesterday's market study — 0.0355 points of spread per Elo point, estimated on games with coaching continuity on both sides — the arithmetic runs:
Seattle 1674.6 - New England 1592.8 = 81.8
                     + home field  =  48.0
                                     ------
                            edge      129.8 Elo
   129.8 x 0.03552 pts/Elo        =    4.61 points

market number: 3.5     model number: 4.61     difference: 1.11
A point and a tenth is a meaningful disagreement on a short number and a trivial one in the life of a football game. It is also directionally the same disagreement the week-1 pricing study found across the whole opening board: the market shortens its numbers in September, and this site's rating does not. Neither party is obviously wrong. Only one of them has sixteen backtested seasons published with the misses attached.
The Venue, Briefly
Seattle has gone 142–76 at home in regular-season games since 1999, a .6514 rate that is seventh best of the 32 home venues in the file, against a league-wide home rate of .5605. The best home record in that same file belongs to tonight's visitor — New England at .7169 — and the Patriots' road record, 135–83 or .6193, is the flattering half of a twenty-seven-season franchise history that includes both a dynasty and the 8–26 stretch that put their rating where it is.
I include those numbers as context and want to be clear about their weight, which is small. Franchise home records over twenty-seven seasons measure rosters and eras that no longer exist. The model does not use them; the +48 it applies to Seattle tonight is the same +48 it applies to every host, and the home-field page documents that the league-wide edge has been shrinking for most of this century.
What Would Actually Be Informative Tonight
One game will not settle whether the model's memory is wisdom or dead weight; the companion page published this morning is a 2,000-word argument for why a single week cannot settle anything. But this game is unusually well-designed as a test, because the two competing descriptions make different predictions and both are on the record before kickoff.
- The records-only view says two 14–3 teams, home field, therefore roughly a 57% game — what two equal teams produce with a +48 edge and nothing else.
- The rating view says 67.9%, because the memory of 2023 and 2024 is real information about New England.
- The market sits between them at 64.5%, closer to the rating.
What the result does to the board is already published and does not need restating: yesterday's page priced every margin in both directions, and the headline is that a three-point Seattle win moves 8.4 rating points while a three-point New England win moves 17.8, with New England needing to win by 24 to pass Seattle at the top. The grading of tonight's pick belongs to the ledger and to a later page. What I will not do is write the recap in advance, in either direction — the one discipline this site actually has is that the number goes up first and the story comes after.
What This Page Does Not Show
The 328-game test is about ratings, not about these two teams. It says that a rating gap of this size has historically carried information when records were tied. It does not say that this gap is correctly sized, and the sample in tonight's bucket is 65 games with a 95% interval running from .546 to .777.
The model has no idea who is playing. No rosters, no injuries, no quarterback, no coaching change — the ratings are entirely a function of scores. Anything that changed between February and tonight is invisible to every number on this page, and in a season opener that is the largest single source of error there is.
"Inherited, not earned" is a statement about the model, not a verdict. If you believe two 4–13 seasons should count for nothing once a team goes 14–3, then the correct reading of this page is that the model is carrying 137 points of stale information and tonight is where it gets punished. That is a coherent position. It is also the position the file's 328 same-record games have historically embarrassed.
The market numbers are the schedule file's snapshot. They are the numbers bundled with the release, not a live quote taken at kickoff, and lines move. The 4.25% hold implies a two-way price that was available at some point, not necessarily now.
The exchange rate is borrowed. The 0.0355 points-per-Elo figure was fitted for a different study, on games with coaching continuity on both sides, and it is a league-average conversion applied to one game. It is a translation device, not a claim that the market should have made this game 4.61.
Nothing here has been graded. All 272 of the 2026 rows in the file carry no score at the time of writing. Every 2026 figure on this page is a frozen expectation.
Method and Sources
One published file, the nflverse game log at /data/games.csv, plus the frozen board at /data/predictions.json and a replay of explainer_src/nfl_elo.py, imported rather than copied. The harness is explainer_src/make_ne_sea_opener_chart.py. The identical-record filter is four lines:
def same_record(g):                       # g = one graded game
    a = record(g.season - 1, g.away)      # [W, L, T] from the same file
    h = record(g.season - 1, g.home)
    return a and h and sum(a) >= 8 and sum(h) >= 8 and a == h
# 328 decided games since 2010;  model .6220, Brier .2263, market favourite .6483
The script asserts every figure on this page — the opener's own row down to the kickoff time and the moneylines, both 2025 season lines, all four rating checkpoints and the haircut arithmetic, the season-long earned totals and opponent averages, the 328-game test with its four buckets and their intervals, the 65-game configuration with its spread and ATS record, the opener rarity counts, both venue records, and tonight's model and market prices: 119 assertions, all green as of September 9, 2026. It is pinned to the pre-kickoff dataset and is built to fail the moment this game grades.
Sources: the nflverse public game log (games.csv, 1999–2025 results with closing numbers, plus the 2026 schedule and its opening prices), bundled at /data/games.csv. The rating system is Arpad Elo's, from The Rating of Chessplayers, Past and Present (1978), with the margin-of-victory and season-regression modifications stated in full on this site's model page.
Further reading
- What One Game Moves — every possible margin tonight, priced into the board in advance
- Opening Night 2026 — the series, the Wednesday kickoff, and the rest of this game's history
- The Offseason Haircut — the one-third regression that turned 122.7 into 81.8
- The Shortest Lines of the Year — why the market's 3.5 is short by its own standards
- Week 1 Predictions, By the Numbers — the other fifteen openers, priced the same way
- The Week 10 Problem That Isn't — why one night, whatever it produces, settles nothing
- Pythagorean Wins — the general case of records lying and margins telling
- Our Prediction Model, Fully Stated — the engine the replay imports
- The Miss Budget — where tonight's pick goes when it is graded
Go deeper
Want the code behind these metrics? Work through the 43-chapter NFL analytics tutorial.
Browse tutorials Free tools