Seven New Sidelines, and a Model That Cannot See Them
Seven of the thirty-two teams that kick off this season do it under a different head coach than the one who finished 2025. This site's rating knows nothing about any of it. It reads final scores, regresses a third of the way to average every August, and hands out probabilities. No rosters, no injuries, no press conferences, no sideline. If a coaching change is worth anything, the model should be systematically wrong about those seven teams, and I should be able to find the damage in twenty-six seasons of the same situation.
The damage is not there. Teams in year one under a new head coach have beaten this model's probability by 1.17 percentage points across 1,921 team-games since 2010, with a cluster-robust standard error of 1.22 — under one standard error from nothing — and the model picks their games at .6465 against .6456 for everyone else. Identical, to within half a point.
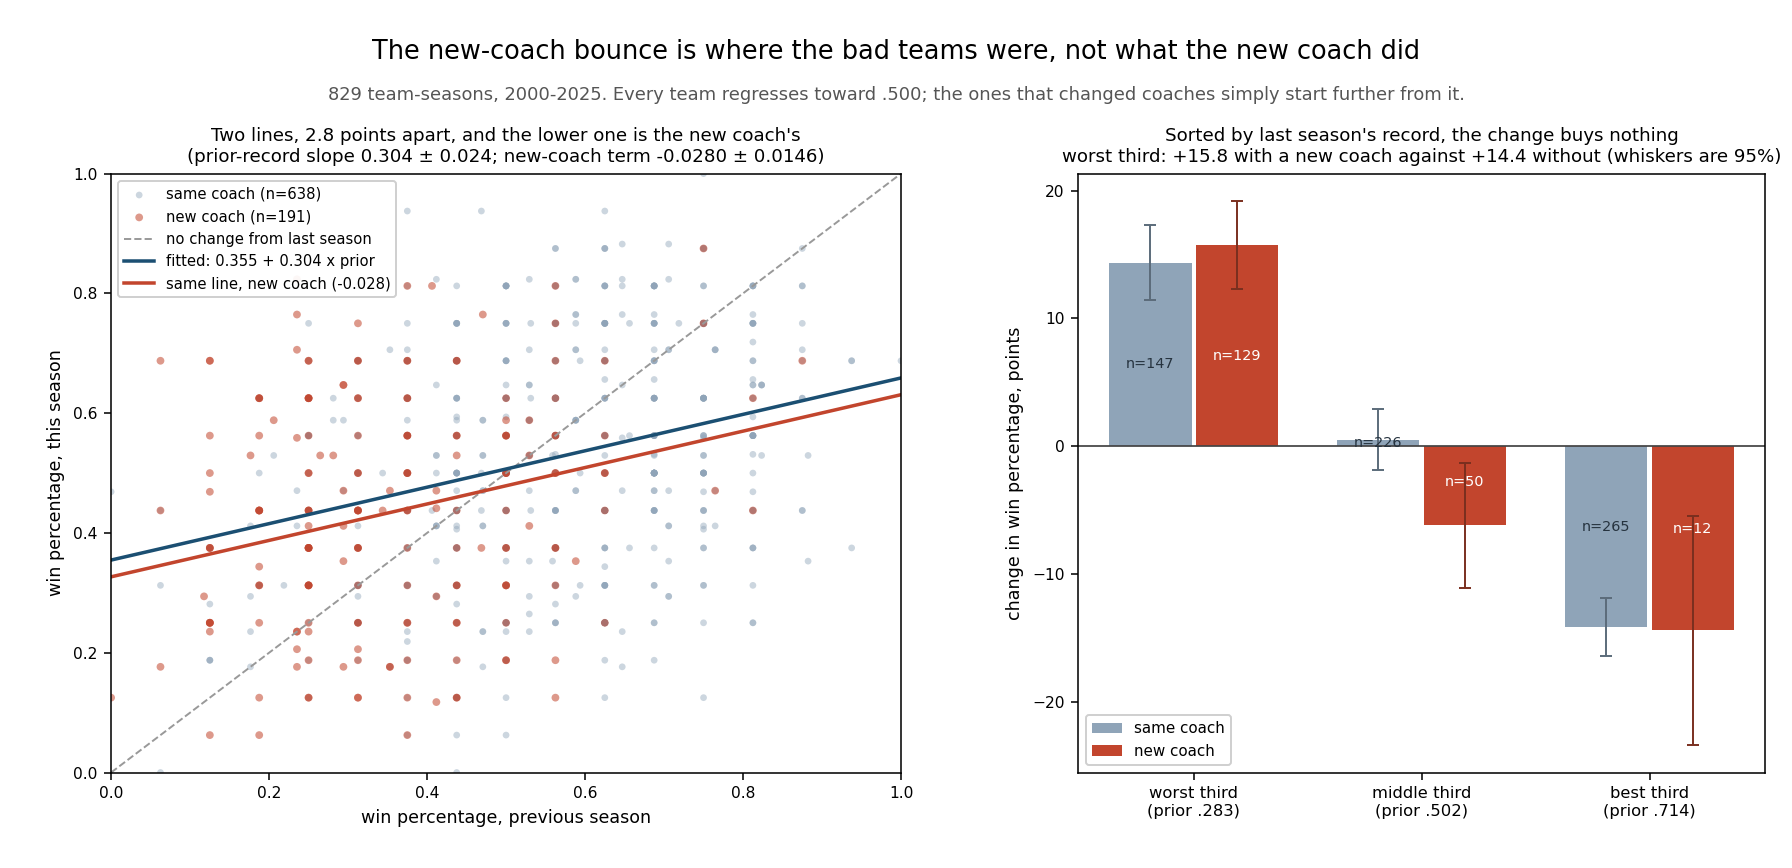
Which is strange, because the bounce is enormous when you look at it the obvious way. Teams that changed head coaches improved by 8.12 points of win percentage the following season while teams that kept theirs declined by 2.39 — a gap of 10.51 points and 5.8 standard errors, about as clean as a raw comparison in this file ever gets. Both of those things are true, and the reconciliation is the oldest one in statistics: teams fire coaches after bad seasons, and bad seasons are followed by better ones whatever you do about the sideline. The model already contains that. What it does not contain — the coach — turns out to be worth nothing you can measure, and roughly a third of a point of spread at the window.
How I Measured It
The bundled nflverse game log names the head coach of both teams in every regular-season row, which makes coaching tenure a fact in the file rather than something I have to look up. I define a team-season's head coach as the man who coached the most of its games; 43 of the 893 team-seasons in the file used more than one, so that rule matters and I state it plainly. A team is "in year one" when its primary coach differs from the previous season's primary coach. That counts the promoted interim who keeps the job, which is a real coaching change by any sensible reading, and it counts nothing else.
On that definition there have been 198 coaching changes from the 2000 season through 2026 — a low of three (2010), a high of eleven (2022), an average of 7.33 a year. The year-over-year comparison uses the 829 team-seasons since 2000 that have a previous season on file, 191 of them post-change. The model and market tests use the graded window, 2010 through 2025: 4,175 games, 8,350 team-games, 118 new-coach team-seasons.
One methodological note that changes the conclusions. A team's sixteen or seventeen games are not sixteen independent observations of that team; every standard error on a team-game quantity here is cluster-robust by team-season. The naive versions are roughly half as wide and would have let me call two things findings that are not.
The Exhibit
The Control That Kills It
Teams that changed coaches had gone .3529 the previous season. Teams that kept theirs had gone .5441. Those are not the same population and no honest comparison of their next seasons can ignore it, so put last season's record in the regression:
| This season's win percentage, 829 team-seasons 2000–2025 | Coefficient | Std. error | z |
|---|---|---|---|
| Constant | +0.3547 | — | — |
| Last season's win percentage | +0.3041 | 0.0242 | +12.6 |
| New head coach | −0.0280 | 0.0146 | −1.91 |
A team keeps 0.304 of last season's record and gives back the rest to the mean. That single number does all the work the coaching story was hired to do: a .200 team is expected back at .416 and an .800 team at .598, before anybody hires anyone. And the new-coach term, once that is held fixed, is −2.80 points of win percentage — half a win over seventeen games, in the wrong direction, at 1.9 standard errors. Run the same regression on point differential and the change is worth −17.7 points a season (standard error 7.7, z = −2.29) after controlling for the previous year's differential.
I am not going to tell you that hiring a new coach makes a team worse. The estimate is small, it sits either side of the two-sigma line depending on which dependent variable you pick, and the selection story runs the same way it always does: the teams that change coaches are also the teams that just tore something down, lost a quarterback, or ran out of cap room. What I will tell you is that after the control there is nothing left of the bounce to attribute to the hire. The raw +10.5-point gap becomes a negative number.
The tercile cut says it more concretely, and shows why the terciles are the weaker instrument:
| Tercile of last season's record | Group | Team-seasons | Prior win% | Change |
|---|---|---|---|---|
| Worst third (prior .283) | new coach | 129 | .2623 | +15.76 |
| same coach | 147 | .3018 | +14.36 | |
| Middle third (prior .502) | new coach | 50 | .5011 | −6.20 |
| same coach | 226 | .5027 | +0.51 | |
| Best third (prior .713) | new coach | 12 | .7096 | −14.43 |
| same coach | 265 | .7138 | −14.16 |
In the worst third, where two-thirds of all coaching changes live, the new-coach teams gained 1.4 points more than the teams that stood pat — while starting four points worse, which is most of what a 1.4-point edge buys. In the middle third they lost 6.2 against a gain of 0.5. In the best third the two groups are the same number twice, on twelve cases. The regression, which uses the whole prior-record range instead of three buckets, is the estimate I trust, and it says −2.8.
The Model Does Not Need to Know
That is the historical question. The operational one is whether a rating that carries last season forward — minus a third — is biased on precisely the teams whose situation changed most. It is not:
| Team-games, 2010–2025 | Games | Actual minus predicted | Cluster SE | Pick accuracy |
|---|---|---|---|---|
| Year one under a new head coach | 1,921 | +0.0117 | 0.0122 | .6465 |
| Coaching continuity | 6,403 | −0.0035 | 0.0059 | .6456 |
A tenth of one standard error separates the model's accuracy on the two groups. Its probabilities on new-coach teams run 1.17 points hot, which is the direction you would expect if a change were worth something real, and which the sample cannot distinguish from zero. The one-third offseason haircut is doing this work: shrink a bad team's rating toward 1505 and you have already priced in most of what "they hired somebody new and things will get better" means, without needing to know who was hired.
One more test, which is inconclusive and I will say so. If a coaching change genuinely injected new information, the model should have to travel further to learn it — a new-coach team's rating should move more over a season. It does: 83.1 Elo points against 73.2 for continuity teams, 1.7 standard errors apart. But new-coach teams start the season at 1442.8 against 1523.6, and bad ratings move more than good ones for reasons that have nothing to do with the sideline. I cannot separate those two things with 118 cases and I am not going to pretend otherwise.
What the Market Charges for a New Coach
The market does not have the model's excuse. It can see the hire, and it prices it. Here is how to measure that without asking the market what it thinks: fit the closing spread on this site's rating difference using only the 2,453 games in which both teams had coaching continuity, then apply that line to every game and ask how far the actual number sits from it.
The fitted exchange rate is 0.0355 points of spread per Elo point, which is one point of spread for every 28.2 Elo. Applying it:
| New-coach team-games, 2010–2025 (controlled for the team's own rating) | Points | Cluster SE | z |
|---|---|---|---|
| Spread premium over the rating-fitted line | +0.340 | 0.188 | +1.80 |
| Performance against the closing number | −0.570 | 0.367 | −1.55 |
The two halves fit together, which is the reason I am reporting a pair of sub-two-sigma numbers at all. The market gives a new-coach team about a third of a point more than its rating deserves; the model says those teams then perform at their rating; so the number they should miss by is about a third of a point, and the number they do miss by is 0.57 with a standard error of 0.37. Uncontrolled, the raw figure is −0.594 points per game across 1,927 games. Against the number the record is 906–966–55, a cover rate of 48.40%.
Then the part that stops it being a betting page. Fading every new-coach team for sixteen seasons wins 51.60%, and standard juice requires 52.38%. The best-supported version of this effect is not large enough to pay for the vig, and neither of its two halves clears two standard errors once the clustering is honest. Reported, and declined — the same verdict the fair-prices audit reached about this model's edges generally.
The one cut inside it worth seeing is who the market pays for. Split the new hires by whether the file has them running a team before:
| New hire | Team-games | Spread premium | Against the number |
|---|---|---|---|
| Has been a head coach before | 717 | +0.378 | −0.915 |
| First-time head coach | 1,210 | +0.139 | −0.404 |
The premium is nearly three times larger for a name you already know, and the disappointment is larger to match. That is a reputation being priced, and the reputation is the part that has already been paid for.
The Seven, Priced
Here are this year's cases, off the frozen board that has not moved since August 12. The coach names are as the game file records them; the ratings and expected wins are the same ones behind the site's win totals.
| Team | 2026 head coach (per the file) | 2025 | Rating | Rank | Expected wins |
|---|---|---|---|---|---|
| Baltimore | Jesse Minter | 8–9 | 1553.4 | 12 | 10.06 |
| Pittsburgh | Mike McCarthy | 10–7 | 1516.0 | 16 | 8.87 |
| Miami | Jeff Hafley | 7–10 | 1459.1 | 23 | 7.05 |
| Cleveland | Todd Monken | 5–12 | 1419.9 | 27 | 7.21 |
| N.Y. Giants | John Harbaugh | 4–13 | 1419.3 | 28 | 6.62 |
| Las Vegas | Klint Kubliak | 3–14 | 1351.0 | 31 | 4.87 |
| Tennessee | Robert Saleh | 3–14 | 1349.8 | 32 | 5.23 |
Six of the seven finished under .500; Pittsburgh at 10–7 is the exception. As a group they averaged .3361 last season against a league .500, they sit at 1438.4 on the board against 1523.7 for the other twenty-five, and the ratings expect them to win 7.13 games each against 8.88. Three of the seven hires have run a team before in this file — the Giants', Pittsburgh's and Tennessee's — which is the group the market has historically paid the larger premium for. The file also records the neatest version of the churn: the Giants hired the man who coached Baltimore in 2025, and Baltimore replaced him.
Worked example, Tennessee. The Titans went 3–14, a .1765 win percentage. The prior-record line says .3547 + 0.3041 × .1765 = .4084, which over seventeen games is 6.9 wins. Apply the new-coach term and it becomes .4084 − .0280 = .3804, or 6.47 wins. The frozen ratings, which read margins rather than records and therefore know that Tennessee's 3–14 was a genuinely bad 3–14, say 5.23 — 1.24 wins harsher. That gap is not the coach. It is the difference between a record and a point differential, and it is the same gap that made the Pythagorean argument worth making in the first place.
So the honest expectation for these seven: they will improve, most of them substantially, and it will look like the hires worked. In the worst third of the file the teams that stood pat gained 14.36 points of win percentage against the new-coach group's 15.76 — 91% of the same improvement, without firing anybody — and the regression says the last ninth is not there either.
What This Page Does Not Show
A coaching change is not a random treatment. Everything here is an association measured on teams that selected themselves into it, usually after a bad year and often alongside a quarterback change, a cap purge or a new general manager. The right causal statement is that I cannot isolate the coach from the circumstances that produced him, and that the circumstances are visible in last season's record while the coach is not.
The coach of record is a blunt variable. The file names a head coach, not a regime. A team that keeps its head coach and replaces both coordinators counts as continuity here; a team that promotes its own coordinator after a 12–5 season counts as a change. The coach ledger shows how much variation that flattens.
Year one is the only year measured. Nothing here says a hire is worthless in year three. If a coach's value shows up as a slow build, this design cannot see it, and the design is deliberate: year one is when the model is most exposed to not knowing.
The market results do not clear the bar. Both the +0.34 premium and the −0.57 shortfall sit under two cluster-robust standard errors. They are consistent with each other and with the model's null, which is why I published them, and they are not a finding I would stake a number on. The sixteen-season fade also loses to the vig, so even taking them at face value there is nothing to do.
Names and spellings are the file's. The 2026 coach fields come from the public nflverse schedule release, and I have reproduced them as recorded rather than correcting them against anything else. If a name is wrong upstream it is wrong here; the analysis depends on the change, not the spelling.
The 2026 rows are ungraded. Not one game of this season had been played when this page was written. Every historical figure is fixed; every 2026 figure is a frozen expectation, not a result.
Method and Sources
One published file — the nflverse game log at /data/games.csv, including its home_coach/away_coach fields — plus the frozen board at /data/predictions.json and a replay of explainer_src/nfl_elo.py. The harness is explainer_src/make_new_coach_chart.py. The classification is four lines:
# the primary coach of a team-season = the man who coached the most of its games
prim = {(season, team): most_common(coach_counts[(season, team)])}

def is_new(season, team):
    return prim.get((season - 1, team)) not in (None, prim.get((season, team)))
# 198 changes, 2000-2026;  191 team-seasons with a prior year, 2000-2025
The script asserts every figure on this page — the file and coach counts, the raw bounce with its standard error, both controlled regressions with cluster-robust errors, the tercile table, the model residuals and accuracies, the rating-travel comparison, the spread fit and both market columns, the retread split, and all seven 2026 rows against the frozen board: 138 assertions, all green as of September 9, 2026. It is pinned to the pre-kickoff dataset and is meant to fail once tonight's game grades.
Sources: the nflverse public game log (games.csv, 1999–2025 results with per-game head-coach fields, plus the 2026 schedule), bundled at /data/games.csv. The phenomenon the control removes is Francis Galton's, from "Regression Towards Mediocrity in Hereditary Stature" (Journal of the Anthropological Institute, 1886). The cluster-robust standard errors follow Kung-Yee Liang and Scott Zeger, "Longitudinal Data Analysis Using Generalized Linear Models" (Biometrika, 1986).
Further reading
- The Coach Ledger — three specific coaching bets read game by game, where this page reads all 198 at once
- The Offseason Haircut — the one-third regression that turns out to be doing the coaching change's job
- One-Score Records Are Luck and Half of All Games Are One-Score Games — the same regression-to-the-mean trap, sprung on close-game records
- The Week 10 Problem That Isn't — today's companion, on the other way a football pattern gets manufactured
- QB Continuity — the personnel variable that does move the needle
- Does Preseason Record Predict Anything? — another August story that dies under a control
- Elo-Implied 2026 Win Totals — the expected-wins column in the table above, for all 32 teams
- Pythagorean Wins — why the ratings are harsher on Tennessee than its record is
- What a 60% Pick Is Worth — the standing audit of this model's edges against the market
Go deeper
Want the code behind these metrics? Work through the 43-chapter NFL analytics tutorial.
Browse tutorials Free tools