What a Record Is Evidence Of
The ledger is one for two, thirteen games grade tomorrow, and by Monday night this model will have a week-1 record that people can read things into. Two different questions get asked of a record like that, and they have different answers. The first is accounting: what the week does to the season's count of misses. That one moves one for one, because every miss is a miss, and yesterday's page tabulated it for every count Sunday can produce. The second is evidence: what the week says about how good the model will be for the rest of the season. That is the question this page answers from the model's own history. The answer is close to nothing, and the reason is more interesting than small samples.
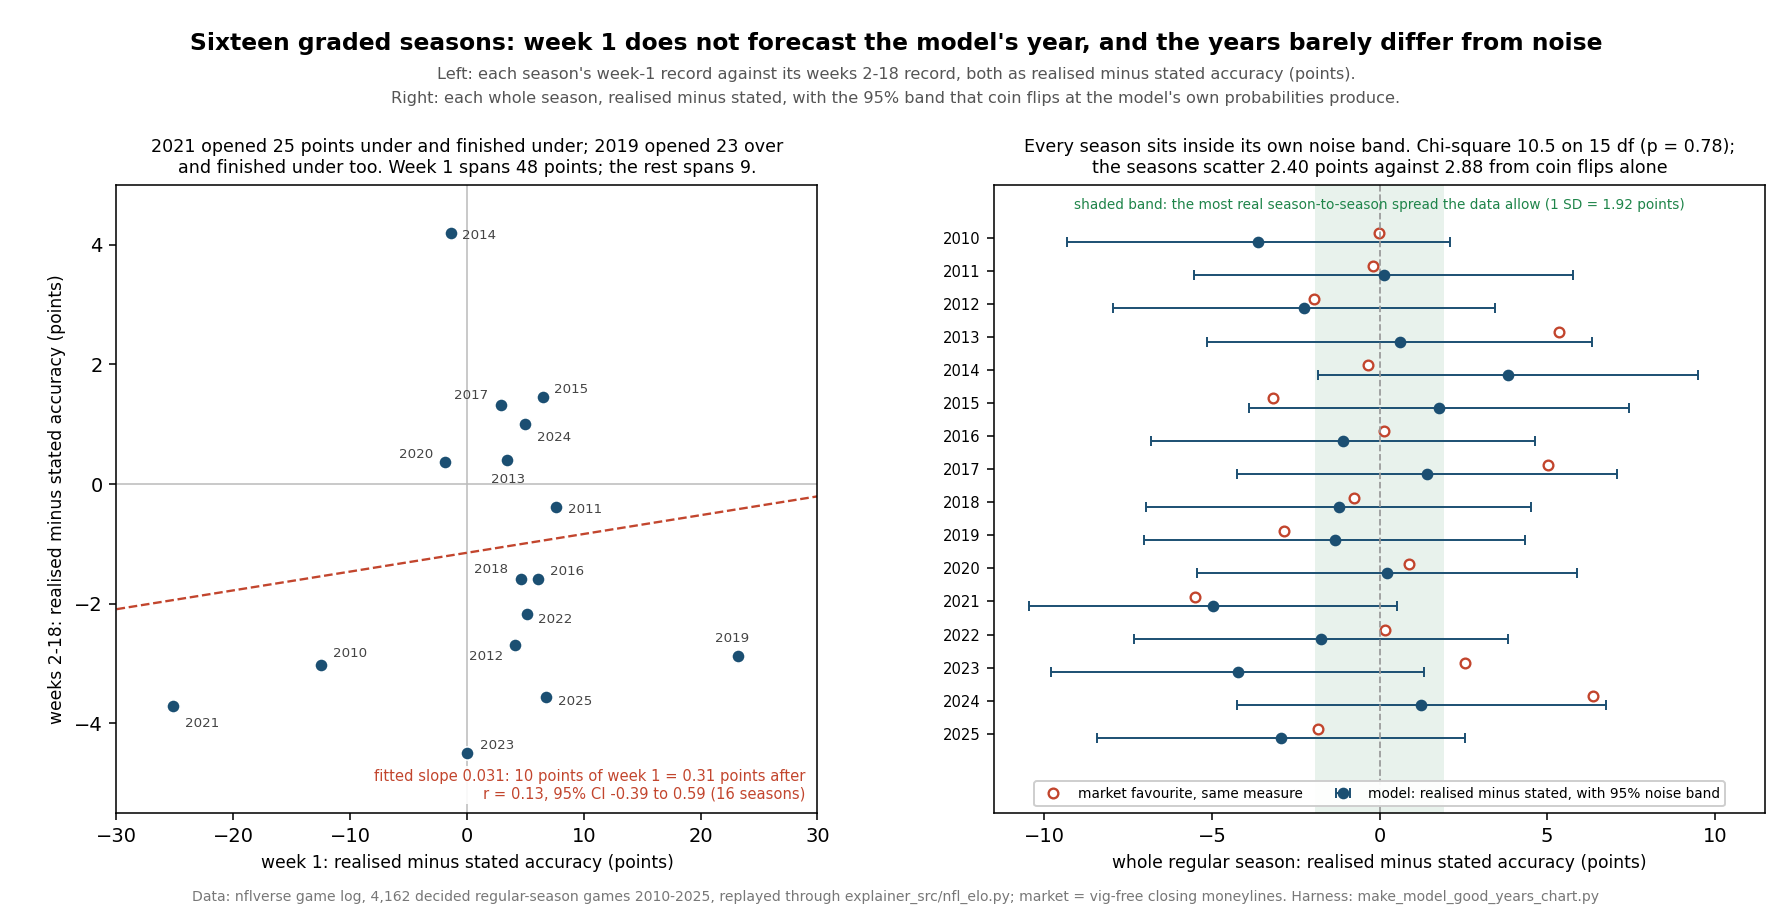
The short version. Across the sixteen seasons the engine has graded, 2010 through 2025, the correlation between a season's week-1 record and the same season's weeks 2–18 record, both measured against what the model itself said it would do, is .13, with a 95% interval from −.39 to .59. That interval is too wide to mean anything alone. The stronger finding sits underneath it: the seasons themselves do not differ by more than coin flips would make them differ. Sixteen seasons of realised-minus-stated accuracy scatter by 2.40 points, and a model with no good or bad years at all, flipping about 260 coins a season at its own probabilities, would scatter by 2.88. There is no season-level signal for week 1 to be an early reading of. The most there can be, at 95% confidence, is a true year-to-year spread of 1.92 points, and at that bound a sixteen-game week is worth 2.55% of whatever it surprises you with.
Sixteen Openers and the Seasons That Followed
The harness replays the published engine over the game file and reproduces the backtest to the game — 4,363 graded, every season's row matching _elo_backtest.json — then keeps the 4,162 decided regular-season games. For each, "stated" is the probability the model gave its own pick, max(p, 1−p), priced before the game was fed; "realised" is whether the pick won. Over the whole window the model stated .6550 and realised .6458. Here is every season, week 1 against the rest:
| Season | Week 1 | Stated | Weeks 2–18 | Stated | Gap (pts) | Whole season, z |
|---|---|---|---|---|---|---|
| 2010 | 8 of 16 | 10.00 | .6250 | .6552 | −3.0 | −1.24 |
| 2011 | 11 of 16 | 9.78 | .6583 | .6621 | −0.4 | +0.04 |
| 2012 | 11 of 16 | 10.34 | .6318 | .6586 | −2.7 | −0.78 |
| 2013 | 10 of 16 | 9.46 | .6527 | .6486 | +0.4 | +0.20 |
| 2014 | 10 of 16 | 10.22 | .7029 | .6610 | +4.2 | +1.33 |
| 2015 | 11 of 16 | 9.96 | .6750 | .6604 | +1.5 | +0.61 |
| 2016 | 11 of 16 | 10.03 | .6345 | .6503 | −1.6 | −0.38 |
| 2017 | 10 of 15 | 9.56 | .6722 | .6590 | +1.3 | +0.49 |
| 2018 | 10 of 15 | 9.31 | .6360 | .6519 | −1.6 | −0.42 |
| 2019 | 13 of 15 | 9.52 | .6333 | .6621 | −2.9 | −0.46 |
| 2020 | 10 of 16 | 10.30 | .6653 | .6616 | +0.4 | +0.08 |
| 2021 | 6 of 16 | 10.02 | .6235 | .6606 | −3.7 | −1.77 |
| 2022 | 10 of 15 | 9.23 | .6299 | .6516 | −2.2 | −0.62 |
| 2023 | 10 of 16 | 10.00 | .6016 | .6466 | −4.5 | −1.49 |
| 2024 | 11 of 16 | 10.20 | .6680 | .6579 | +1.0 | +0.44 |
| 2025 | 11 of 16 | 9.92 | .6275 | .6631 | −3.6 | −1.05 |
The two seasons that look like stories are 2021 and 2019. The 2021 model went 6 of 16 in week 1 against a stated 10.02, the worst opener in the window at 25 points under its own number, and then ran 3.7 points under for the rest of the year. That is the story people want. The 2019 model went 13 of 15 against a stated 9.52, 23 points over and the best opener in the window, and then ran 2.9 points under for the rest of the year. That is the same story told backwards. The worst weeks 2–18 in the file, 2023 at .6016 against a stated .6466, followed a week 1 of 10 of 16 against 10.00: the model opened exactly on schedule and then had its worst run. The best, 2014 at .7029, followed 10 of 16 against 10.22, slightly under.
Five seasons opened under their stated week-1 number and eleven over. After the five, weeks 2–18 ran 1.41 points under stated confidence; after the eleven, 0.97 under. The difference is 0.44 of a point, a z of 0.27. The correlation across all sixteen is .161 on raw accuracy and .134 on realised minus stated, and the fitted slope on the second says ten points of week-1 surprise carry 0.31 of a point into the rest of the season. With sixteen points, the interval on either correlation covers most of the possible range, so taken alone this says only that the data show no relationship. The next two sections say why there is none to show.
The Exhibit
nfl_elo.py; market numbers from the file's closing moneylines.Week 1 Is Not Special, and Neither Is Week 12
If a week's record carried information about its season, the effect would not be confined to the first week. So I ran the same correlation for every week from 1 to 17 (week 18 exists in only five of these seasons): each week's realised-minus-stated record against the rest of that season's. The seventeen correlations run from −.444 (week 9) to +.391 (week 12); eleven of the seventeen are negative; their average is −.062; and every one of their 95% intervals contains zero. Week 1's .134 is the fourth-highest, behind weeks 12, 8 and 4, which is to say it sits where a draw from a distribution centred on nothing would sit.
The cleaner version of the test does not use weeks at all. Split each season's games into odd- and even-numbered in date order, so each half holds about 130 games drawn from the same weeks, the same teams and the same ratings. If a season had a quality of its own — a year when the engine's assumptions suited the league, or did not — the odd half would predict the even half. Across the sixteen seasons the split-half correlation is .023.
The Model Does Not Have Good Years
Here is why a week cannot forecast a season. Take each whole season, compute realised minus stated accuracy, and compare it with the noise that season's own probabilities imply: a season of about 260 picks at around .65 carries a standard error of close to three points before anything real happens. All sixteen seasons land inside two of their own standard errors. The worst is 2021, 4.97 points under (z −1.77); then 2023, 4.24 under (z −1.49); the best is 2014, 3.84 over (z +1.33). Nine seasons came in under and seven over.
Taken together, the sixteen residuals have a standard deviation of 2.40 points, and pure binomial noise at the model's own probabilities predicts 2.88. The seasons scatter less than chance does. The chi-square test of "every season has the same true offset" is 10.55 on 15 degrees of freedom, p = .78. The method-of-moments estimate of the real year-to-year spread is zero, and the largest real spread consistent with these sixteen seasons at 95% confidence is 1.92 points. Pooled over the window, the model realised 0.89 of a point less than it stated, z −1.24: a hair overconfident, and not distinguishable from calibrated, which matches what the learning-curve page found cutting the same games by week.
The market gets the same test, using the vig-free closing favourite from the file's moneylines on 4,161 of the 4,162 games. Its favourite won .6655. Its seasons scatter a little more: chi-square 19.48 on 15, p = .19, an upper bound on the real spread of 3.69 points, and one season beyond two standard errors (2024, z +2.25), which is one in sixteen and about what sixteen draws produce. The market's worst season against its own prices was 2021, z −1.99. That was the model's worst season too, and the first seventeen-game regular season in the file. If any year was genuinely hard to price, that is the candidate, and neither pricer's shortfall in it clears two standard errors.
What the Test Can and Cannot See
A test that finds nothing is only as good as its ability to find something. Two checks on this one. The first is a seeded simulation: give each of the sixteen seasons a true offset drawn from a normal distribution, play every season's actual games at the model's probabilities plus that offset, and count how often the chi-square flags it at the 5% level. With a real year-to-year spread of 2 points it flags 33.5% of the time; 3 points, 68.0%; 4 points, 90.1%; 5 points, 97.8%. So the claim is bounded in both directions. Real swings of four points or more would almost certainly have shown up, and did not. Swings of two points could be there and be invisible.
The second is a real change the file is known to contain. Home teams won .5543 of these games, and the season rates run from .4980 in 2020, the season played largely without crowds, to .6024 in 2018 — a ten-point range with a known cause at its low end. The same test calls that range chi-square 13.29 on 15, p = .58: invisible. Sixteen seasons of about 260 games cannot tell a real shift of two or three points in a rate from noise. That is the honest ceiling of the instrument, and it cuts against over-reading this page as much as against over-reading week 1. The model may have mildly good and bad years. What sixteen seasons say firmly is that any such years are small, and that nobody has been able to see them from inside a season.
What 1–1 and a Bad Sunday Are Worth
Turn the bound into a weight. If a season's true accuracy offset has a spread of τ, and a sample of n games has sampling variance c(1−c)/n with c = .6550, the model's mean stated confidence, then the most a sample's surprise should move a forecast of the rest of the season is τ² / (τ² + c(1−c)/n) of that surprise. This is the shrinkage logic Efron and Morris made famous, and at τ = 1.92 points it gives:
| Sample | Games | Most weight toward the rest |
|---|---|---|
| The two graded 2026 games | 2 | 0.33% |
| One Sunday | 13 | 2.09% |
| Week 1 through Sunday | 15 | 2.40% |
| A full week 1 | 16 | 2.55% |
| Four weeks | 64 | 9.49% |
| A whole season | 260 | 29.87% |
At the bound it would take about 610 games before a sample outweighed the prior. A week is nowhere near that.
Apply it to the ledger. The two graded games stated 1.2574 expected correct and produced one, a shortfall of 12.9 points per game. At a weight of 0.33%, that shades the forecast for the remaining 270 regular-season games by 0.11 of a game at the bound, and by nothing at the point estimate. Through Sunday, the fifteen games will have stated 9.33 correct between them. A 5-for-13 Sunday, six of fifteen on the week, would shade the remaining 257 games by 1.37 at the bound. An 8-for-13 Sunday would shade them by 0.14. An 11-for-13 Sunday would lift them by 1.10. Those are ceilings, not forecasts. The miss budget moves by the full count either way, and it should: it records what happened, and this page is about forecasting what has not.
The bound would not have rescued anyone in 2021. At 2.55%, that season's 6-of-16 opener would have shaded weeks 2–18 by 1.64 games; they came in 9.46 under. It would have misled in 2019 in the other direction: the 13-of-15 opener pointed up, and weeks 2–18 came in 6.89 games under. Seasons like those happen to this model, and a week's record does not announce them. As far as sixteen seasons can tell, they are what 260 coin flips look like near the edge of their range. That is also why one miss in Melbourne, which the grading page owned at full price, says as little about the rest of 2026 as Wednesday's hit did.
What This Page Does Not Show
Sixteen seasons. Every between-season statement rests on sixteen numbers, and the power check above says what that can and cannot resolve: a real spread of two points could hide in them.
Accuracy is a coarse score. Hit rate against stated confidence ignores how confident each pick was beyond the side it took. A Brier-based version would be sharper and would need its own noise model. Ties are dropped.
Games inside a season are treated as independent. They are not quite: a league-wide shock correlates games. That makes the true noise band wider than the one used here, which would make the seasons look even more like noise, not less.
The constants are the published ones. The engine's K, home edge and regression fraction are fixed across the whole window. If they were chosen with this history in view, the residuals are measured against a model fitted to the same seasons, which would tend to narrow their spread. The test cannot rule that out.
2026 is a new season. Nothing here says 2026 cannot be the exception. It says a week of 2026 will not be able to tell you.
The Sunday figures are arithmetic, not predictions. Every 2026 game from Sunday on is unplayed. The counts above are scenarios applied to the frozen probabilities, not forecasts of what Sunday will produce.
Method and Sources
One public file and one module: the nflverse game log at /data/games.csv, whose 7,276 games through 2025 are identical in the June bundle and the September 12 pull, and explainer_src/nfl_elo.py, imported rather than copied. The 2026 figures come from the frozen ledger at /data/predictions.json. The harness is explainer_src/make_model_good_years_chart.py. The central test is a few lines:
res, var = [], []
for s in range(2010, 2026):                     # decided regular-season games, priced before they were fed
    g = [x for x in graded if x.season == s]
    conf = [max(x.p, 1 - x.p) for x in g]
    res.append((sum(x.hit for x in g) - sum(conf)) / len(g))      # realised minus stated
    var.append(sum(c * (1 - c) for c in conf) / len(g) ** 2)       # what coin flips alone produce
chi2 = sum((r - mean(res)) ** 2 / v for r, v in zip(res, var))    # 10.55 on 15 df, p = .78
The script asserts the replay's reproduction of the published backtest season by season, the sixteen-row table above cell by cell, both correlations and their intervals, the seventeen weekly correlations and the split-half, the variance decomposition, its upper bound and its power simulation, the market and home-rate versions, the weight table, the 2021 and 2019 examples, and the 2026 ledger arithmetic: 133 assertions, all green as of September 12, 2026.
Sources: the nflverse public game log (games.csv), including its closing moneylines. The chi-square test is Karl Pearson's (Philosophical Magazine, 1900); the correlation intervals use R. A. Fisher's z transformation (Biometrika, 1915); the weight follows the shrinkage argument popularised by Bradley Efron and Carl Morris, "Stein's Paradox in Statistics" (Scientific American, 1977).
Further reading
- One Night, 25 Points of Playoff Odds — the companion page: what one week-1 game did to two teams' seasons, and whether such moves have been the right size
- What Sunday Can Do — the bookkeeping side: what each Sunday count does to the miss budget
- The First Miss and The Opener, Graded — the two 2026 results, graded as picks
- The Model Gets Louder, Not Smarter — the same games cut by week instead of by season
- The Week 10 Problem That Isn't — another pattern that dissolves into noise under a permutation test
- Does Week 1 Mean Anything? — the same question asked of teams instead of the model
- The Miss Budget — the 99 misses the season is expected to cost
- Our Prediction Model, Fully Stated — the engine and its constants
- What a 60% Pick Is Worth — the market as the benchmark this model rarely beats
- The Prediction Ledger — one for two, with the rest of the week frozen
- Power Rankings — the ratings behind every probability here
Go deeper
Want the code behind these metrics? Work through the 45-chapter NFL analytics tutorial.
Browse tutorials Free tools