One Game, Carried Through Sixteen More
Yesterday's grading page measured San Francisco 27, Rams 7 against every rating move the engine has made since 1999 and put it at the 94th percentile. That is the size of the night. This page asks what the night is worth over a season. The 49ers and the Rams each have sixteen games left, every one of them priced off the two ratings that moved 34.4 points on Thursday, and a rating is only as interesting as the games it re-prices.
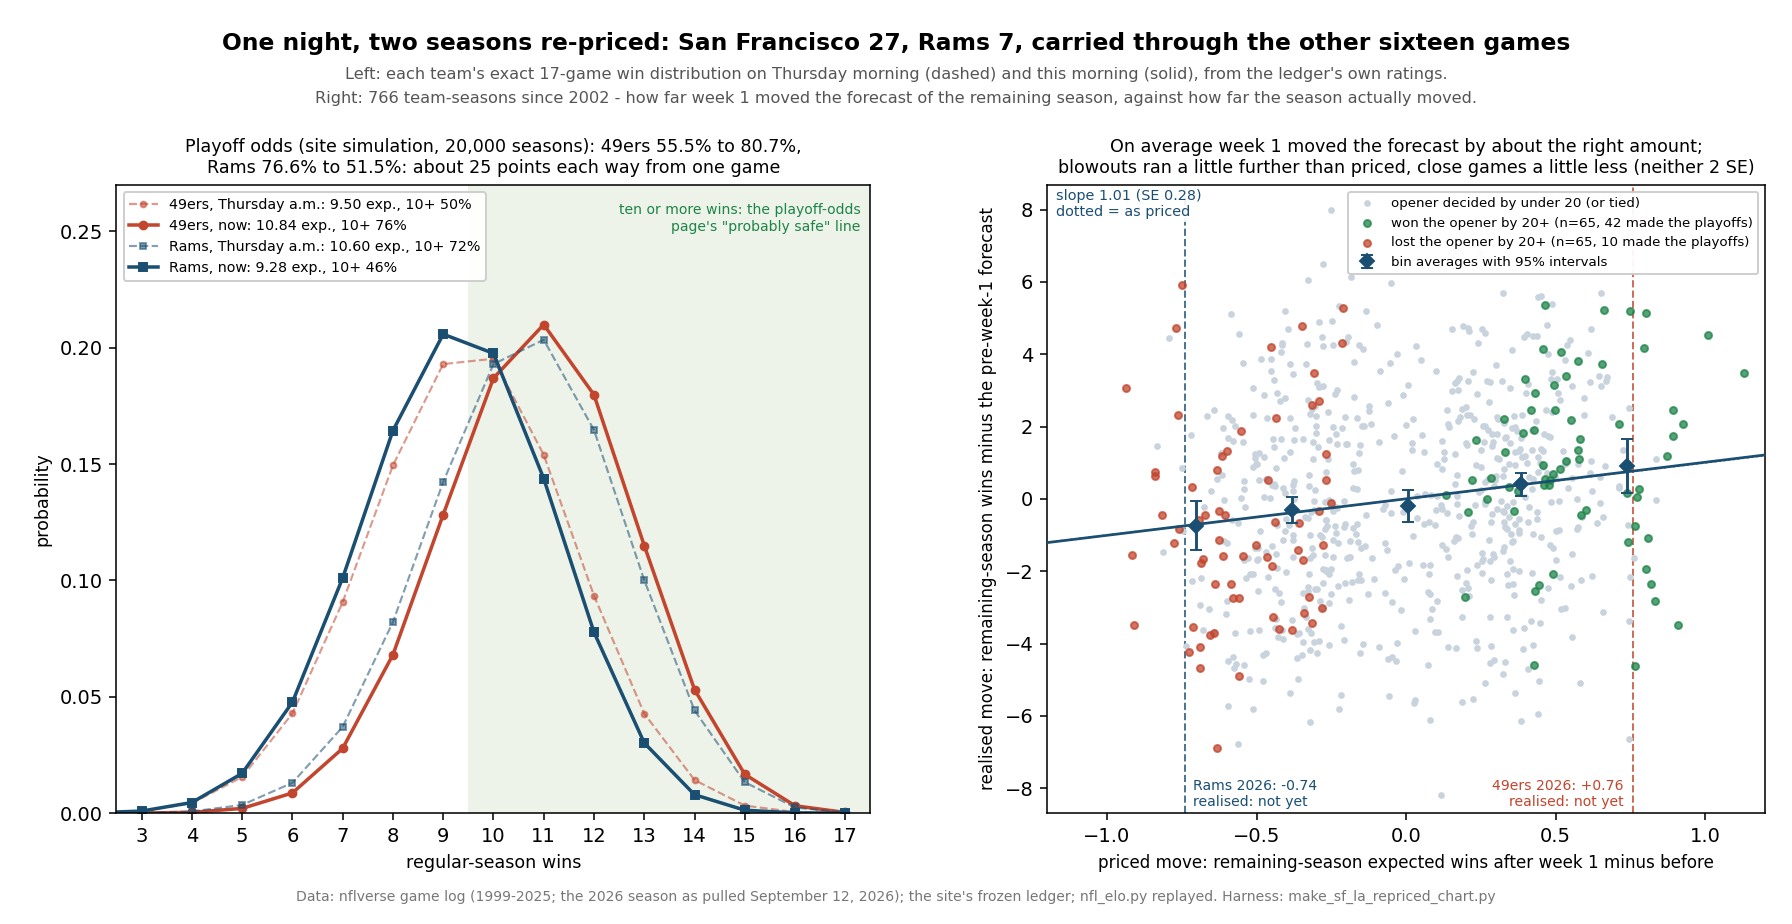
So I carried it through. Using nothing but the ledger's ratings and the site's own rating-to-probability function, the 49ers' expected season went from 9.50 wins on Thursday morning to 10.84 this morning, and the Rams' from 10.60 to 9.28. Their chance of ten or more wins, the line the playoff-odds page calls probably safe, went from 50% to 76% for San Francisco and from 72% to 46% for Los Angeles; the two teams traded places on it. Re-running that page's own 20,000-season simulation, the 49ers' playoff odds went from 55.5% to 80.7% and the Rams' from 76.6% to 51.5%. One game, about twenty-five points of playoff probability each way.
That is a large thing to say about one result, and the obvious objection is that it is too large: a 27–7 game in Melbourne, fed through a margin multiplier, now carries a quarter of a playoff spot. So the second half of this page tests the size of the move against history. Across 766 team-seasons since 2002, week 1 moved the forecast of each team's remaining season by some number of wins, and the remaining season then moved, on average, by 1.01 times that number. The move has been the right size. If anything the blowouts have run a little further than priced, though not by enough to prove it.
Two Seasons, Priced Three Ways
A team's season is seventeen coins of known weight. The played game is no longer a coin: the 49ers have one win and the Rams none. The other sixteen are the site's standard price, 1 / (1 + 10−(gap + edge)/400), with the home edge of 48 waived at neutral sites, and the exact distribution of wins is a convolution that takes one loop. I priced three states of the board: August's frozen ratings, which reproduce the win-totals page (49ers 9.52, Rams 10.62); Thursday morning, with Wednesday's opener graded and Melbourne still a .5789 Rams pick; and this morning.
| Season, as priced | August | Thursday a.m. | Now |
|---|---|---|---|
| 49ers: expected wins | 9.52 | 9.50 | 10.84 |
| 49ers: ten or more | 50.8% | 50.3% | 76.5% |
| 49ers: twelve or more | 15.7% | 15.4% | 36.8% |
| 49ers: most likely record | 10–7 | 10–7 | 11–6 |
| Rams: expected wins | 10.62 | 10.60 | 9.28 |
| Rams: ten or more | 72.5% | 72.1% | 45.8% |
| Rams: twelve or more | 32.9% | 32.5% | 11.7% |
| Rams: most likely record | 11–6 | 11–6 | 9–8 |
The Thursday-morning column differs from August by two hundredths of a win for both teams, which is what Seattle's 8.4-point move on Wednesday did to two teams that play Seattle twice. Everything between the second and third columns is Thursday night.
Split the 49ers' +1.34 and it comes apart cleanly. 0.58 of it is the game itself: on Thursday morning the Melbourne row was worth .4211 of a win to San Francisco, and it is now worth one. The other 0.76 is the re-rating, spread across sixteen games that each got a little easier. The Rams' −1.32 splits the same way, 0.58 for the game and 0.74 for the rest. The biggest single re-price on either schedule is the rematch, the Rams at San Francisco on December 13: the 49ers were a .4895 underdog in it on Thursday morning and are a .5876 favourite now, 9.8 points in one game, because both ratings moved into it. Every other 49ers game moved by between three and five points. Three of the 49ers' remaining games changed sides — Denver at home in week 4 (.4925 to .5419), the rematch, and the Chargers on the road in week 15 (.4720 to .5214) — and one of the Rams' did, the same rematch from the other side. The trip to Seattle on October 11 is still the hardest game San Francisco has left, .2713 then and .3122 now.
The width barely changed. The season's standard deviation is 1.87 wins for the 49ers and 1.88 for the Rams, against 1.97 and 1.92 before; a decided game is a coin removed, and the remaining coins are no less random for being re-weighted. The honest reading of the table is still "about eleven, give or take two" for San Francisco and "about nine, give or take two" for Los Angeles. What moved is the centre, and at the centre of an NFL season a win and a third is a lot.
The Exhibit
nfl_elo.py.The Playoff Odds, With the Site's Own Simulation
The playoff-odds page published its table from 20,000 simulated seasons: every game an independent draw at the model's probability, division winners by record, three wild cards per conference, ties broken at random, seed 2026. Before changing anything I re-ran it on the August ratings, with that page's probability expression term for term. The re-run reproduces all 96 published odds for the 32 teams exactly, the 49ers at 56.2% and the Rams at 77.0% among them. Then I fixed the two played games as certainties and ran the same seeded draws again, so every difference between the columns below comes from the games and not the dice.
| Simulated odds | August | Thursday a.m. | Now |
|---|---|---|---|
| 49ers: make the playoffs | 56.2% | 55.5% | 80.7% |
| 49ers: win the NFC West | 11.4% | 9.1% | 23.2% |
| 49ers: 1 seed | 5.4% | 4.7% | 14.3% |
| Rams: make the playoffs | 77.0% | 76.6% | 51.5% |
| Rams: win the NFC West | 25.9% | 21.1% | 7.2% |
| Rams: 1 seed | 14.8% | 12.7% | 3.6% |
| Seattle: make the playoffs | 93.8% | 96.4% | 96.6% |
| Seattle: win the NFC West | 62.5% | 69.6% | 69.4% |
The 49ers gained 25.2 points of playoff probability and the Rams lost 25.1. The routes matter more than the totals. Seattle is still the division favourite at 69.4%, so most of the 49ers' gain came through the wild-card door, where their share rose from 46.4 points to 57.5, and the division is now a real but minority route at 23.2%. The Rams' loss is sharper on the division side, from 21.1% to 7.2%, a third of what it was, with the wild-card share down from 55.4 to 44.3. The 1 seed went from 4.7% to 14.3% for San Francisco and from 12.7% to 3.6% for Los Angeles.
For scale, Wednesday's game did less. Seattle went from 93.8% to 96.4% and New England from 72.1% to 64.3%, a 7.8-point loss for the loser of an 8.4-point move. Thursday's loser lost more than three times as much, because the move was four times as large and because both teams sit in the steep middle of the playoff curve, where a win buys the most probability. Everyone else paid for Thursday in small pieces: no other team moved as much as 1.1 points. Tampa Bay rose 1.08 and Minnesota fell 0.91, and in the other conference Miami, which visits San Francisco on September 20, fell 0.59. Seattle's own odds barely noticed.
Was the Move the Right Size?
A rating system that over-reacts to week 1 would show it in exactly this situation: a big result early, a big re-price, and then a season that drifts back toward where the team started. So I rebuilt the situation for every team since 2002. For each of the 24 seasons the harness replays the engine to opening day and freezes the board, then replays it through the last week-1 game and freezes it again. Against each frozen board it prices the team's remaining regular-season games, with no further updating. The difference between the two forecasts is the priced move: how many wins week 1 added to or took from the rest of the season. The difference between what the team actually won in those games and the opening forecast is the realised move. If week 1 were over-read, realised moves would come in systematically smaller than priced ones. 766 team-seasons qualify; the file has no week-1 game for Miami or Tampa Bay in 2017.
| Priced move after week 1 (wins) | Team-seasons | Average priced | Average realised |
|---|---|---|---|
| −1.2 to −0.6 | 54 | −0.70 | −0.74 |
| −0.6 to −0.2 | 258 | −0.38 | −0.30 |
| −0.2 to +0.2 | 151 | +0.01 | −0.19 |
| +0.2 to +0.6 | 248 | +0.38 | +0.40 |
| +0.6 to +1.2 | 55 | +0.74 | +0.92 |
Regress realised on priced across all 766 and the slope is 1.010, with a standard error of 0.284 once the errors are clustered by season. The 95% interval runs from 0.45 to 1.57, which excludes zero comfortably and includes one comfortably. On average, a win of priced movement after week 1 has turned into a win of realised movement. The bins say the same thing without a line: the teams marked down hardest came in at −0.74 against −0.70 priced, the teams marked up hardest at +0.92 against +0.74. The middle bin, teams whose forecast barely moved, lost 0.19 of a win it was not supposed to, which is inside its own interval and the kind of thing 151 team-seasons do.
Thursday's re-rating is worth +0.76 wins over the 49ers' sixteen remaining games and −0.74 over the Rams'. Of the 766 historical moves, 33 were larger than San Francisco's and 43 were larger than Los Angeles'. The largest in the file is 2017 Jacksonville, +1.13 after winning its opener by 22; the largest the other way is 2021 Tennessee, −0.94 after losing its opener by 25. So Thursday sits among the biggest twentieth or so of week-1 re-prices, not off the end of the scale.
Blowouts, Close Games, and the Base Rates
The average hides a split worth showing, because Thursday was a blowout and the question people actually ask in September is whether blowouts get over-read.
| Opener, 2002–2025 | Teams | Priced move | Realised move | Realised − priced (SE) | Made playoffs |
|---|---|---|---|---|---|
| Won by 20 or more | 65 | +0.57 | +1.00 | +0.43 (0.29) | 42 (64.6%) |
| Won by 1 to 19 | 315 | +0.34 | +0.16 | −0.18 (0.15) | 162 (51.4%) |
| Lost by 1 to 19 | 315 | −0.34 | −0.19 | +0.15 (0.16) | 86 (27.3%) |
| Lost by 20 or more | 65 | −0.54 | −0.64 | −0.10 (0.34) | 10 (15.4%) |
| Favourite, lost by 20 or more | 21 | −0.74 | −1.23 | −0.49 (0.73) | 4 (19.0%) |
| Underdog, won by 20 or more | 21 | +0.81 | +1.12 | +0.31 (0.59) | 11 (52.4%) |
Teams that won their opener by twenty or more were priced up 0.57 wins for the rest of the season and went on to win a full 1.00 more than their opening forecast; teams that lost by twenty or more were priced down 0.54 and finished 0.64 down. Teams whose openers were decided by less than twenty were priced up or down by about a third of a win and realised about half of it. Put the two sides of each together and the blowouts delivered 1.48 wins of realised spread for each win of priced spread, and the closer games 0.52. That is the direction you would expect if margin carries information the multiplier under-weights, and it fits this site's argument that one-score records are mostly luck. It is not established. The blowout excess is 0.27 wins at a z of 1.18, the close-game shortfall 0.16 at −1.51, and the gap between the two is 1.72 standard errors. Sixty-five blowouts a side is not enough, and I am not going to touch the multiplier on a 1.7.
The playoff column is the base rate people quote in September, so here it is plainly. Of the 65 teams that won their opener by twenty or more, 42 reached the postseason; of the 65 that lost by twenty or more, 10 did; across all 766, 39.2%. Split by result alone, 204 of 380 opener winners and 96 of 380 losers made it, 53.7% and 25.3%, which is where the week-1 signal page put the same split over 1999–2025. Blowout winners went on to win .591 of their remaining games, blowout losers .426.
The subset that looks most like Thursday is smaller still: favourites, by the engine's own opening price, who lost their opener by twenty or more. There are 21. They were priced down 0.74 wins for the rest of the season, the same as the Rams, and finished 1.23 down, with a standard error of 0.73; four of the 21 made the playoffs. The 21 underdogs who beat them were priced up 0.81, finished 1.12 up, and eleven made the playoffs. Read those with two cautions. Twenty-one teams is a sample in which one standard error is most of a win. And a base rate does not know who the team is: the Rams are still eighth on the board at 1580.3, and the simulation's 51.5% is the number that knows it. A pooled four in 21 is not a forecast for them.
What This Page Does Not Show
The simulation freezes the ratings. Every simulated season is played at one board's numbers with no updating from game to game. That is the playoff-odds page's method, and it is the right way to ask what the board says now, but real ratings keep moving, so the true spread of outcomes is wider than the simulation's and its odds at both ends are somewhat too confident. I have not measured by how much.
Ties are ignored. The convolution counts wins, and the engine prices a tie as nothing.
Tiebreakers are random. The simulation breaks equal records uniformly at random rather than by the league's head-to-head ladder, as the playoff-odds page discloses.
The history tests the average, not a team. The slope says week 1's information has been the right size across 766 teams. It does not say the 49ers are an eleven-win team or that the Rams are a nine-win one, and the blowout split that points the other way is 1.72 standard errors, reported because Thursday was a blowout and not because it justifies anything.
Playoff formats are pooled. The fields were twelve teams through 2019 and fourteen since, which lifts the later seasons' base rates.
No rosters, no quarterbacks. The ratings are 2025 results, a third of a regression and two 2026 scores.
Every other 2026 game is unplayed. Neither team plays again until September 20 and 21, but Sunday's thirteen games and Monday's will move all of these odds through the teams they are chasing. Everything above is a price as of September 12.
Method and Sources
Three inputs: the frozen ledger at /data/predictions.json for the ratings, the nflverse game log for 1999–2025 at /data/games.csv, and the 2026 schedule as pulled from nflverse on September 12 and saved to explainer_src/_2026_season_snapshot_2026-09-12.json, because the site's build republishes the June bundle over the served game file. The engine is explainer_src/nfl_elo.py, imported rather than copied; the harness is explainer_src/make_sf_la_repriced_chart.py. The two computations that carry the page are short:
# a season as a distribution: the played game fixed, the rest priced
def pmf(ps):
    d = [1.0]
    for p in ps:
        d = [(d[k] if k < len(d) else 0) * (1 - p) + (d[k - 1] if k else 0) * p for k in range(len(d) + 1)]
    return d                       # 49ers now: E 10.84, P(10+) .7648

# was week 1's re-price the right size? one row per team-season, 2002-2025
priced   = E_rest(board_after_week1) - E_rest(board_on_opening_day)
realised = wins_rest - E_rest(board_on_opening_day)
slope    = ols(realised ~ priced, cluster=season)     # 1.010 (SE 0.284)
The script asserts the 2026 pull against the served schedule row for row, the replay's reproduction of the frozen board and both post-game boards, every entry in the three tables above, the decomposition of each team's move into the game and the re-rating, every re-priced game quoted, the simulation's exact reproduction of all 96 published playoff odds before anything changes and every simulated figure after, the 766-team history with its slope, standard error, bins, groups and playoff counts, and that the tables on this page match the script's rows: 156 assertions, all green as of September 12, 2026.
Sources: the nflverse public game log (games.csv), with playoff participation read from the file's own postseason rows. The rating method is Arpad Elo's, from The Rating of Chessplayers, Past and Present (1978); the season-clustered standard errors follow Liang and Zeger, Biometrika (1986).
Further reading
- The Model Has No Good Years, Only Lucky Ones — the companion page: what a week-1 record says about the model's own season
- The First Miss — the same game graded as a rating move: 94th percentile, six rows of the board changed
- Elo-Implied 2026 Playoff Odds — the August table and the simulation re-run here
- Elo-Implied 2026 Win Totals — the August expected wins in the first column
- Does Week 1 Mean Anything? — the won-or-lost split over 1999–2025, and why the opener is an ordinary game
- What One Game Moves — the update rule behind the 34.4 points
- The First Four Games, Priced — the same forecast-versus-realised idea after four games instead of one
- One-Score Records Are Luck — why close results carry less than they seem to
- The 2026 NFC West — the division both teams are now priced into differently
- What Sunday Can Do — the thirteen games that move these odds next
- Power Rankings — the live board: 49ers fifth, Rams eighth
- The Prediction Ledger — the frozen numbers every figure here starts from
- San Francisco 49ers and Los Angeles Rams — the two schedules re-priced above
Go deeper
Want the code behind these metrics? Work through the 45-chapter NFL analytics tutorial.
Browse tutorials Free tools