The Blowout Discount Nobody Collects
Every September the same advice goes around once the first week is graded: buy the team that got embarrassed, because the number will be too generous, and sell the team that looked unbeatable, because the number will be too steep. It is the most natural story in football betting. One ugly game gets read as a verdict, the line lurches, and patient people collect the difference. It is also checkable, because the nflverse game log carries a closing spread on every regular-season game since 1999, so the whole history of week-1 results and the week-2 numbers that followed them is on disk.
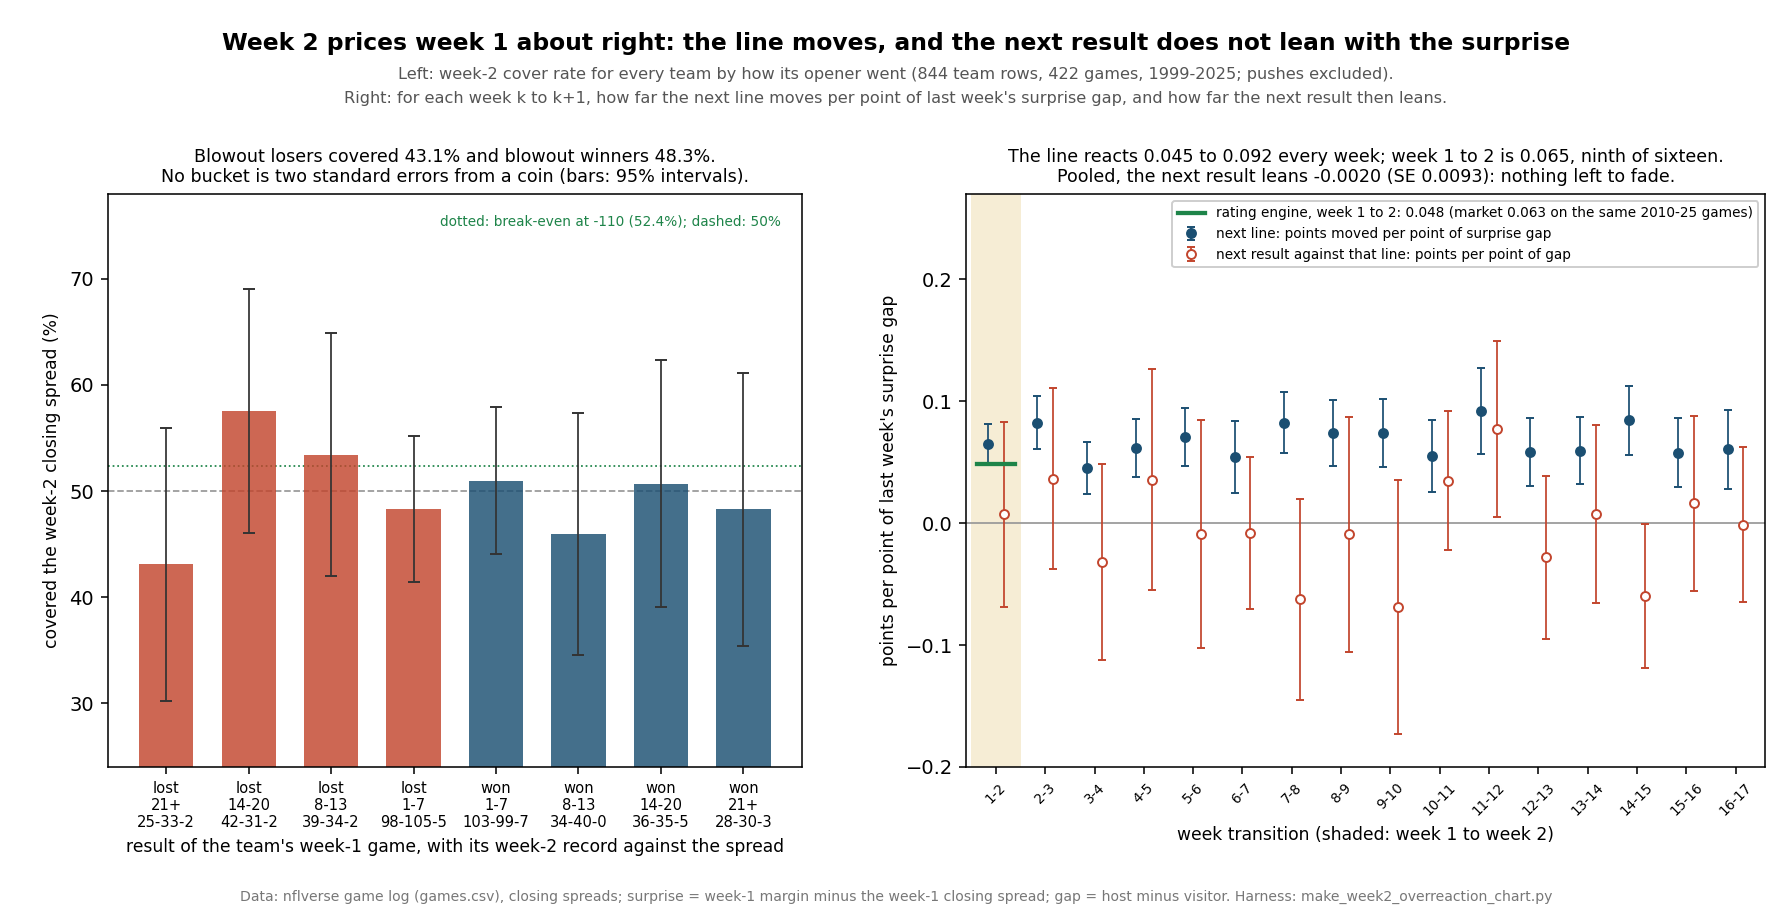
I took every week-2 game in which both teams had played in week 1: 422 games from 1999 through 2025, 844 team rows. The short version is that the story does not survive. Teams that lost their opener by 21 or more went 25–33–2 against the week-2 number; teams that won their opener by 21 or more went 28–30–3, so fading them at standard prices also lost money. The line does move after week 1, by about 0.065 points for every point a team beat or missed its week-1 number, which makes a 20-point surprise worth about 1.3 points the next week. And the week-2 results then lean with that surprise by +0.007 points per point, with a 95% interval from −0.069 to +0.083. The move has been about the right size, and there has been nothing left over to collect.
Two further findings sit under that one. The line moves in the same way after every week of the season, so week 1 gets no special treatment in either direction. And this site's rating engine, which only sees scores, moves about three-quarters as far as the market does; in the games where week 1 surprised most, that difference cost it.
Every Team, by How Its Opener Went
A team's week-2 result against the line is its margin plus the points it was getting, or minus the points it was laying; above zero it covered. Here are all 844 team rows, sorted by the team's own week-1 margin. The last column is the average week-2 handicap, positive when the team was getting points.
| Week-1 result | Team rows | Week-2 ATS | Cover rate | Avg. result vs line | Avg. week-2 handicap |
|---|---|---|---|---|---|
| Lost by 21 or more | 60 | 25–33–2 | 43.1% | −1.81 | +2.36 |
| Lost by 14 to 20 | 75 | 42–31–2 | 57.5% | −0.02 | +2.22 |
| Lost by 8 to 13 | 75 | 39–34–2 | 53.4% | −0.72 | +0.31 |
| Lost by 1 to 7 | 208 | 98–105–5 | 48.3% | +0.85 | +0.38 |
| Tied | 6 | 4–2–0 | 66.7% | −2.50 | +4.50 |
| Won by 1 to 7 | 209 | 103–99–7 | 51.0% | +0.05 | −0.56 |
| Won by 8 to 13 | 74 | 34–40–0 | 45.9% | −1.10 | −0.72 |
| Won by 14 to 20 | 76 | 36–35–5 | 50.7% | +0.06 | −1.26 |
| Won by 21 or more | 61 | 28–30–3 | 48.3% | +1.13 | −2.80 |
If week 2 overreacted, the top row would cover too often and the bottom row too rarely. The top row points the other way, and the bottom row is a coin that leans both ways at once. The blowout losers fell short of their week-2 number by 1.81 points on average and covered 43.1%; backing all 58 decided bets at −110 would have lost 10.27 units. The blowout winners beat their week-2 number by 1.13 points and covered 48.3%, so the fade went 30–28, a .5172 rate that sits under the .5238 a bettor needs at −110 and lost 0.73 units. No row in the table is two standard errors from a coin. The largest is the lost-by-14-to-20 row at 57.5%, 1.29 standard errors, and nine rows will produce one of those by chance with some regularity.
The handicap column shows that the number did move with the opener: blowout losers were getting 2.36 points on average in week 2 and blowout winners laying 2.80. That column mixes the move with who each team was playing and where, so it cannot say how much of the number was week 1. The next section can.
How Far the Line Moves
A raw margin is a poor measure of surprise. Losing by 21 as a 14-point underdog is a disappointment; losing by 21 as a 3-point favourite is a shock. So the measure used from here on is the surprise: the team's week-1 margin minus what the week-1 closing line expected, which is the same number as its result against the spread. For a week-2 game, the gap is the host's surprise minus the visitor's. Across the 422 games the gap has a standard deviation of 19.02 points.
The file has no week-2 line from before week 1 was played, so the move cannot be read directly. It can be estimated. The rating engine's opening-day board is a preseason view of every matchup built only from earlier seasons, and the week-1 surprise gap is uncorrelated with it (r = −0.009), as it should be if the week-1 line was fair. Regress the week-2 closing spread on the opening board and the surprise gap, and the gap's coefficient is how many points of the week-2 number are explained by week 1 beyond what the preseason already priced: 0.0651 points per point of gap, with a standard error of 0.0081 once the errors are clustered by season. Without the board the coefficient is 0.0632, as it should be for a regressor that is independent of the one left out. Split into its two halves, the host's own surprise moves the number 0.070 points toward it and the visitor's 0.060 toward the visitor, the same size in opposite directions.
So a team that beat its week-1 number by 20 points is priced about 1.3 points better in week 2 than it would otherwise have been. That is a modest move: a 20-point surprise gap is about one standard deviation of the gap, and it buys less than half a field goal. The obvious question is whether modest is right.
First, though, whether it is special. I ran the same regression for every transition in the season, week k to week k+1, from 1–2 through 16–17: 5,662 games. The line reacts to the previous week's surprise in all sixteen, every one past two standard errors, with coefficients from 0.045 (weeks 3–4) to 0.092 (weeks 11–12). Week 1 to week 2 is ninth of the sixteen. The market reads week 1 the way it reads any other week: one game's worth of new evidence, no more and no less.
Was the Move the Right Size?
If the line moved too far, teams with a good week 1 would fall short of their week-2 number and teams with a bad one would beat it: the host's week-2 result against the line would slope down as the gap goes up. If the line moved too little, the slope would be positive. Across the 422 games the host's week-2 result against the line, regressed on the surprise gap, has a slope of +0.0071 points per point, standard error 0.0389 clustered by season, 95% interval −0.069 to +0.083. On the raw margin gap instead of the surprise gap it is +0.0264 (SE 0.0325). Neither is distinguishable from zero, and the small tilt that is there points toward under-reaction, not over-reaction. A 20-point gap corresponds to a mispricing somewhere between 1.4 points too much and 1.7 points too little at the ends of the interval; the best estimate is 0.14 of a point.
The banded version needs no regression. Every week-2 game, from the host's side, by how far apart the two teams' week-1 surprises were:
| Week-1 surprise gap | Games | Host ATS | Avg. host result vs line (SE) |
|---|---|---|---|
| 30 or more against the host | 24 | 11–11–2 | −0.60 (2.52) |
| 10.5 to 29.5 against the host | 105 | 47–55–3 | −0.40 (1.26) |
| Within 10 either way | 166 | 83–77–6 | +0.83 (0.97) |
| 10.5 to 29.5 for the host | 99 | 46–52–1 | −0.26 (1.19) |
| 30 or more for the host | 28 | 11–16–1 | −0.61 (2.72) |
No band is within reach of two standard errors, and the two extreme bands land within a hundredth of a point of each other. Games in which the host was the big week-1 disappointment and games in which it was the big week-1 success produced the same week-2 result against the line, which is what a correctly sized move looks like.
Three checks on the null. Eras: from 1999 to 2011 the slope is +0.066 (SE 0.054) over 200 games, and from 2012 to 2025 it is −0.055 (SE 0.050) over 222. The sign flips and neither era reaches 1.3 standard errors, which is what two draws around zero look like; the line's own reaction was 0.071 in the first era and 0.059 in the second. The placebo weeks: the same residual slope for all sixteen transitions runs from −0.069 to +0.077; nine are negative and seven positive; two cross two standard errors (weeks 11–12 at +2.09 and weeks 14–15 at −1.97), and sixteen tests at the 5% level produce two or more such crossings 18.9% of the time with nothing real underneath. Pooled by inverse variance the sixteen slopes average −0.0020 with a standard error of 0.0093. Power: with week-2 results scattering 12.55 points around the line, 422 games cannot rule out a real mispricing of a point or so after a 20-point surprise. What they rule out is the version people bet on, the one worth a field goal.
The Exhibit
nfl_elo.py.The Engine Moves Less, and It Shows Where It Matters
This site's rating engine updates on the final score alone. It never sees a line, so it cannot know that a 21-point loss was a 7-point surprise; it knows only its own pre-game probability and the margin. Replaying it over the file and freezing its board on opening day and again after week 1 gives its reaction on the same terms. Over the 254 week-2 games in its graded window, 2010–2025, the engine moves 1.345 Elo points per point of surprise gap. At 27.75 Elo points per point of spread, fitted here on the 4,175 regular-season lines of that window, that is 0.048 points. The market, over the same 254 games, moves 0.063 (SE 0.012): 1.31 times as far.
| Week-2 price, 2010–2025 | Moves per point of gap | Result leans (SE) | Mean abs. error | Brier | Winners |
|---|---|---|---|---|---|
| Closing line | 0.063 | −0.057 (0.046) | 9.32 | .2158 | 160 of 253 |
| Engine after week 1 | 0.048 | −0.042 (0.051) | 9.61 | .2227 | 160 of 253 |
| Engine on opening day | 0 | — | 9.54 | .2221 | 158 of 253 |
Neither pricer's week-2 errors lean with week 1 by anything close to two standard errors. Both lean slightly the over-reaction way in this window, which is the 2012–2025 half of the era split showing through. On the 253 decided games with both moneylines, the engine and the vig-free market pick the same number of winners, and the market's Brier score is better by .0070, a paired standard error of .0058: not a gap the sample can call. The engine's own week-1 update did nothing measurable for its week-2 numbers either. Its Brier moved from .2221 on opening day to .2227 after week 1 (paired SE .0023), and its mean absolute error went from 9.54 to 9.61 points (SE 0.065).
The average hides the one place the two part company. Split the 253 games by how large the week-1 surprise gap was:
| Surprise gap at least | Games | Engine minus market, Brier (SE) | Engine minus its opening board (SE) |
|---|---|---|---|
| 10 points | 151 | +.0080 (.0068) | +.0040 (.0034) |
| 20 points | 61 | +.0329 (.0100) | +.0107 (.0067) |
| 30 points | 30 | +.0320 (.0141) | +.0195 (.0107) |
On the 61 games with a gap of 20 or more, the market's Brier is .1917, the engine's .2246, and the engine's own opening-day board .2139. The engine's deficit to the market there is 3.30 standard errors, and on the other 192 games the two are level (−.0013, SE .0068). This is the one number on the page that I would not have predicted, and I would hold it loosely: the 20-point cut is mine, it is one of three shown, the effect is weaker at 10 (1.2 standard errors) and still there at 30 (2.3), and 61 games is a small room. The reading that fits is simple enough. When week 1 goes badly against expectations, the market knows how far the result was from what it expected, and it usually knows why; the engine sees a margin. After the biggest surprises, updating on the margin alone left the engine's numbers slightly worse than not updating at all.
Worked Example: The Largest Surprise in the File
The largest week-1 surprise gap in 422 week-2 games belongs to New England at Miami in 2019. In week 1, Miami hosted Baltimore as a 7-point underdog and lost 59–10. Its surprise: a margin of −49 plus the 7 points it was getting, −42. New England hosted Pittsburgh laying 5.5 and won 33–3. Its surprise: 30 minus 5.5, +24.5. The gap, host minus visitor, is −42 − 24.5 = −66.5.
Week 2 closed with New England favoured by 18 at Miami. At the fitted reaction, 0.0651 × −66.5 = −4.33, so about 4.3 of those 18 points are week 1, over and above what the preseason already had between the two teams. The fitted residual line then expects the host to finish 0.092 + 0.0071 × (−66.5) = −0.38 points against the number, a rounding error. New England won 43–0. Miami's margin of −43 plus its 18 points is −25: New England covered by 25, and anyone who bought Miami low after 59–10 lost.
That looks like the move was too small. The mirror is four years earlier. In 2015 Cleveland lost 31–10 at the Jets as a 3.5-point underdog (−21 + 3.5 = −17.5) while Tennessee won 42–14 at Tampa Bay as a 3-point underdog (28 + 3 = +31). The gap for Tennessee at Cleveland was −17.5 − 31 = −48.5, tied for the fourth largest in the file, worth 0.0651 × −48.5 = −3.16 points toward Tennessee. Cleveland closed as a 1-point favourite and won 28–14, covering by 13. Here the buy-low story paid, by almost as much as it lost in Miami. Of the ten largest gaps in the file, six covered in the direction of the week-1 surprise, three against it, and one pushed. The anecdotes exist on both sides, which is why the 422-game slope is the number to use and the one game you remember is not.
The file's quarterback fields add a detail the arithmetic does not see: Cleveland started a different quarterback in week 2 than in week 1. The market's number knows things like that. A regression on scores does not, which is one more reason to read the slope as an average over situations and not a rule for any one of them.
Two 2026 Results, Priced the Same Way
Only two 2026 games had been graded when the snapshot this page uses was saved on September 11, and the rule can be applied to both without any other result. Seattle beat New England by 3 as a 3-point favourite at the close: a surprise of exactly zero for both teams. On history, the week-2 market has no reason to move either team's number for that game. The engine moved Seattle up 8.4 Elo points, 0.30 of a point of spread, because it had Seattle at .6785 and a win is a win.
San Francisco won 27–7 at a neutral site as a 3.5-point underdog: 20 + 3.5 = +23.5 for the 49ers and −23.5 for the Rams. At 0.0651 per point, that is about 1.53 points of each team's week-2 number, toward San Francisco and away from Los Angeles, relative to where each would otherwise stand. The engine moved the 49ers 34.4 Elo points, which is 1.24 points of spread; the market's historical habit is 1.23 times that. Those are the parts of the two week-2 numbers that belong to this result, as history prices them, and nothing more. Every other result that feeds those numbers is outside this page.
What This Page Does Not Show
No opening lines. The file keeps one spread per game, the close. The market's reaction here is inferred from week-2 closes against a preseason baseline, not observed as a move from an opening number, and it describes the part of the close that week 1 explains. Anyone who bets week-2 numbers early in the week faces a different price, and this page says nothing about whether those early numbers overreact.
The baseline is the engine's, not the market's. The identification rests on the week-1 surprise being uncorrelated with the preseason view (r = −0.009 against the opening board). A market preseason view would be a better control; the file does not have one. Because the surprise is close to independent of any fair preseason number, the estimate should not move much with a better control, but its standard error would shrink.
Power, not proof. The residual slope's interval allows a real mispricing of up to about a point and a half after a 20-point surprise gap. The test rules out a large, bettable over-reaction. It cannot rule out a small one.
Many cuts. This page shows nine margin buckets, five gap bands, sixteen week transitions, two eras and three thresholds. Some of those will cross two standard errors by chance, and two of the sixteen transitions do. The engine-versus-market split at 20 points is the one result here past three standard errors, and it comes from a threshold I picked; treat it as a lead, not a finding.
Team rows are mirror images. Each game appears twice in the margin table, once for each team, and a blowout loser can be meeting a blowout winner. The bucket rows are not independent samples, which is why the per-game regressions carry the argument.
No rosters. Quarterback changes, injuries and suspensions between week 1 and week 2 are in the market's number and not in the engine's or the regression's. The Cleveland example shows one in the file itself.
The engine's point scale is borrowed. Converting Elo to points uses a slope fitted to market spreads, so the engine's point errors are measured on the market's scale. The Brier comparisons do not depend on that conversion.
Standard prices. The strategy records assume −110 on both sides. Better prices shift the units, not the cover rates.
Method and Sources
One public file and one module: the nflverse game log, read from the June 2026 bundle (/data/games.csv, the same 1999–2025 games served at /data/games.csv), and explainer_src/nfl_elo.py, imported rather than copied, with the replay checked against the published backtest game for game. The two 2026 results come from the dated September 11 snapshot the grading pages saved. The harness is explainer_src/make_week2_overreaction_chart.py. The two regressions that carry the page are short:
# one row per week-2 game whose two teams both played in week 1 (422, 1999-2025)
surprise = margin_wk1 + handicap_wk1                 # points a team beat its week-1 close by
gap      = surprise_host - surprise_visitor
# how far the week-2 close moved, against the engine's opening-day board
spread_wk2 = a + b * open_board_diff + c * gap       # c = 0.0651 (SE 0.0081, clustered by season)
# was that the right size?
result_vs_line = host_margin_wk2 - spread_wk2
result_vs_line = a + d * gap                         # d = +0.0071 (SE 0.0389)
The script asserts the file's row counts and the absence of any 2026 score in it, the replay's reproduction of the published backtest, the 422-game sample and every row of the four tables above, both regressions with their plain and clustered standard errors and interval, the reaction estimate with and without the board and by side, all sixteen placebo transitions, the eras, the engine's reaction and point scale, every Brier and error comparison with its paired standard error, the threshold sweep, both worked examples to the half point, and the two 2026 results against the snapshot and the engine: 113 assertions, all green as of September 13, 2026.
Sources: the nflverse public game log (games.csv), including its closing spreads and moneylines. The overreaction question in its modern form comes from Werner De Bondt and Richard Thaler, "Does the Stock Market Overreact?" (Journal of Finance, 1985); Phillip Gray and Stephen Gray, "Testing Market Efficiency: Evidence from the NFL Sports Betting Market" (Journal of Finance, 1997), tested NFL lines for exploitable patterns and reported strategies that were profitable in sample with mixed results out of sample. Season-clustered standard errors follow Liang and Zeger (Biometrika, 1986). The rating method is Arpad Elo's.
Further reading
- Does Week 1 Mean Anything? — what winning or losing the opener says about a team's season
- One Night, 25 Points of Playoff Odds — the same question for the engine's season forecasts: week-1 re-pricing has been the right size there too
- The Shortest Lines of the Year — how the week-1 numbers this page starts from are set
- The Model Has No Good Years, Only Lucky Ones — a week-1 record as evidence about the model rather than the teams
- How Accurate Is the Point Spread? — why the close is nearly unbiased and still misses by ten points a game
- Do Big NFL Favorites Cover the Spread More Often? — another pattern that the win column shows and the cover column does not
- What a 60% Pick Is Worth — the market as the benchmark this engine rarely beats
- The New-Coach Bounce Is Just Regression — the market paying for news the engine cannot see
- What One Game Moves — the engine's update rule, margin multiplier included
- The First Miss — the 49ers' 27–7 win graded as a rating move
- The Week 10 Problem That Isn't — a placebo test of a different weekly pattern
- Our Prediction Model, Fully Stated — the engine and its constants
- The Prediction Ledger — the frozen probabilities for every 2026 game
- Power Rankings — the ratings behind every engine number here
Go deeper
Want the code behind these metrics? Work through the 45-chapter NFL analytics tutorial.
Browse tutorials Free tools