Three Teams Are Already 0-2
Fifteen teams lost in week 1, and tonight's game will almost certainly add a sixteenth. Next weekend three of the fifteen play each other: Carolina at Atlanta, Cleveland at Tampa Bay, and Washington at Dallas. Barring a tie, three teams are going to be 0-2 by next Monday, whatever else happens. The standard response is a number, and the number is real: of the 227 teams since 1999 that lost their first two games, 25 made the playoffs, 11.0%. Teams at 1-1 made it 42.9% of the time and teams at 2-0 61.8%.
The obvious objection is that 0-2 teams were mostly bad to begin with, so the 11% describes who they were, not what the two games did. That is testable, because this site's rating engine gives every team an opening-day rating built only from earlier seasons. The objection turns out to be mostly wrong. Holding the opening-day rating fixed, each of the first two results is still worth 21.2 points of playoff probability, against 25.0 without the rating. Who the team was accounts for about 15% of the gap. The rest is the two games: most of it the two results sitting in the standings for the rest of the year, and a smaller part what they reveal about the team.
This page is the two-game sequel to Does Week 1 Mean Anything?, which split every team by its opener alone, and it asks a different question from One Night, 25 Points of Playoff Odds, which measured whether week 1's re-pricing of a team's rating was the right size. Here the conditions are two games and a rating, and the 2026 part is the week-2 slate: who can still get to 0-2, and how likely each of them is to do it.
The Base Rates
Every team-season from 1999 to 2025, 861 of them, by its record after two games. Eight had a tie in one of the first two and are set aside. Playoff teams are the ones that appear in the game file's postseason rows. The rest-of-season column is win percentage from game three on, which keeps the two games that define each row out of it.
| After two games | Team-seasons | Made playoffs | Rate | Rest of season | Average final wins |
|---|---|---|---|---|---|
| 0-2 | 227 | 25 | 11.0% | .410 | 5.82 |
| 1-1 | 401 | 172 | 42.9% | .522 | 8.41 |
| 2-0 | 225 | 139 | 61.8% | .557 | 9.89 |
The format matters at the margins. Under the twelve-team playoff, through 2019, 0-2 teams got in 17 times in 176, 9.7%. Since the field went to fourteen in 2020 it is 8 in 51, 15.7%, and 2-0 teams have made it 39 times in 52. Six of the 25 playoff 0-2 teams came in the last two seasons: Baltimore, Denver and the Rams in 2024; Carolina, Chicago and Houston in 2025. Two of the 25 won the Super Bowl, the 2001 Patriots and the 2007 Giants. Of the 427 teams that lost their opener, 227 lost again, 53.2%, and the whole 0-1 group made the playoffs 108 times, the 25.3% the week-1 page reported.
Across seasons the league produces between five and eleven 0-2 teams, 8.41 on average; 2022 had the fewest and 2006, 2008 and 2020 the most.
Who Starts 0-2
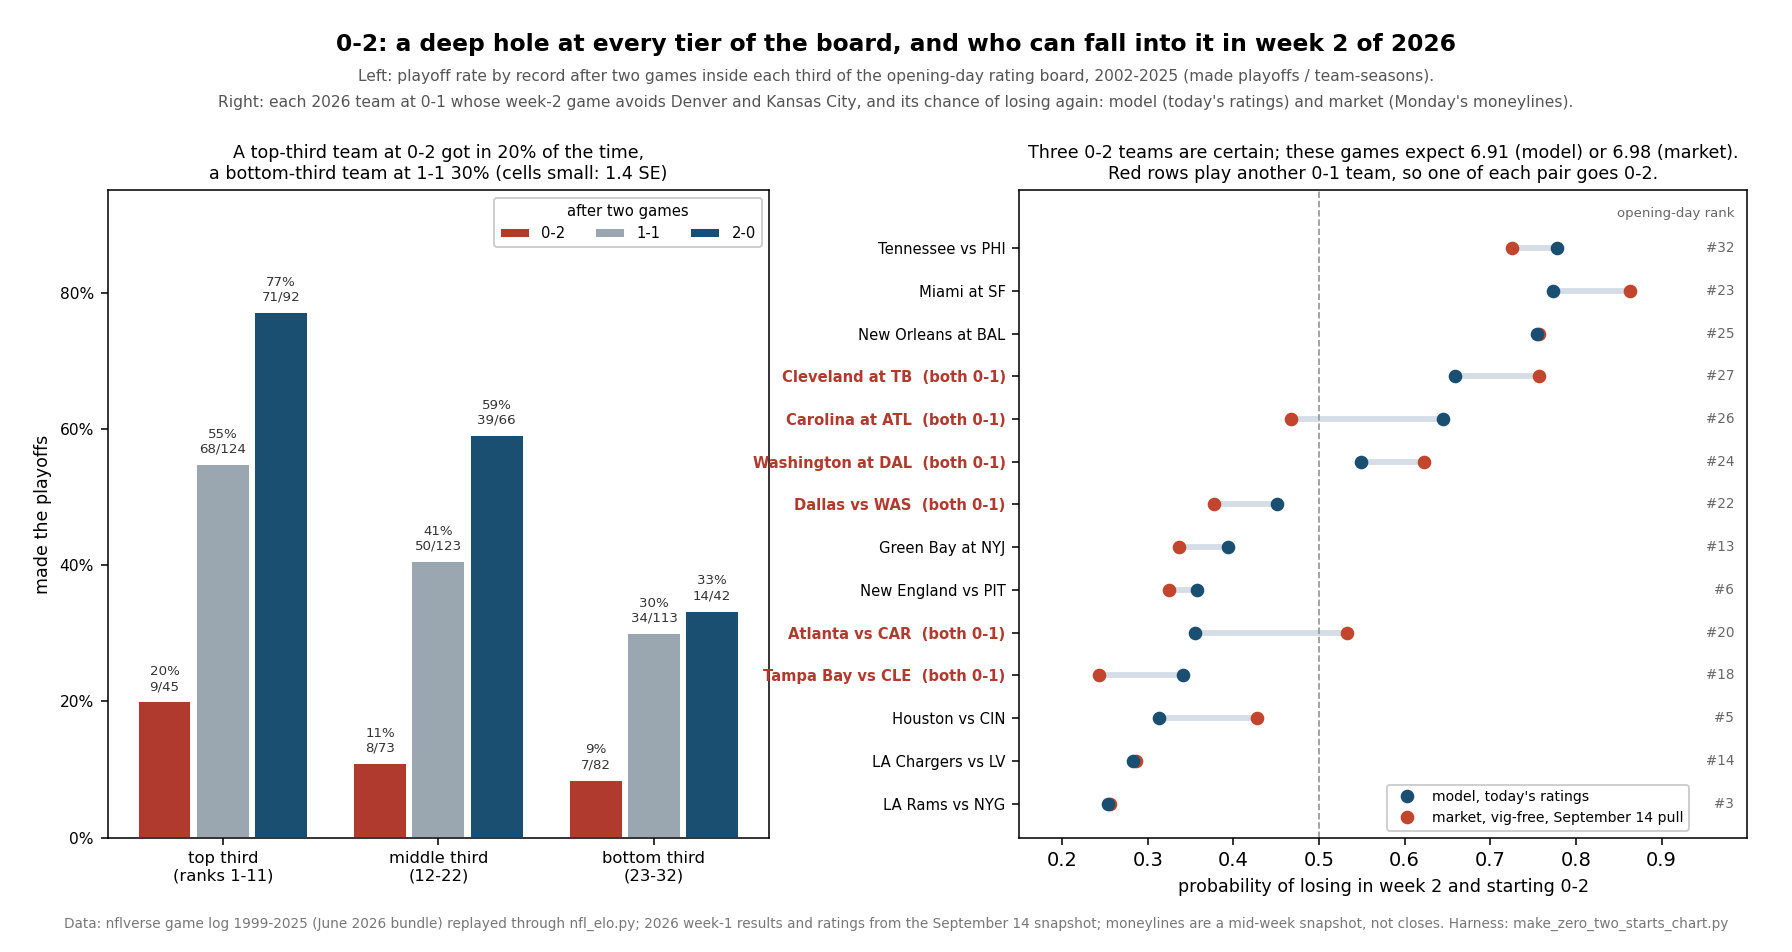
The objection has something to it. From 2002, the first season of 32 teams, the engine's opening-day rating averaged 1475.6 for teams that started 0-2, 1507.5 for 1-1 teams and 1531.0 for 2-0 teams. Bad teams lose early more often. So split every team-season by where its opening-day rating ranked, top eleven, middle eleven or bottom ten, and read the playoff rate inside each group:
| Opening-day rating, 2002–2025 | All | 0-2 | 1-1 | 2-0 |
|---|---|---|---|---|
| Top third (ranks 1–11) | 148 of 261, 56.7% | 9 of 45, 20.0% | 68 of 124, 54.8% | 71 of 92, 77.2% |
| Middle third (12–22) | 97 of 262, 37.0% | 8 of 73, 11.0% | 50 of 123, 40.7% | 39 of 66, 59.1% |
| Bottom third (23–32) | 55 of 237, 23.2% | 7 of 82, 8.5% | 34 of 113, 30.1% | 14 of 42, 33.3% |
Inside every tier, 0-2 is a deep hole. A top-third team that starts 0-2 made the playoffs 20.0% of the time, below a bottom-third team that starts 1-1 at 30.1%. The comparison that makes it strange is the football that followed. Those 45 top-third 0-2 teams played .507 the rest of the way, and the 113 bottom-third 1-1 teams played .446. The better teams played better and still got in less often, because they had spotted everyone two games. The cells are small, and the playoff difference between those two is about 1.4 standard errors, so read it as an illustration and not a finding. The next section has the finding.
Nine top-third teams have climbed out: Pittsburgh in 2002, Philadelphia in 2003, Kansas City in 2006, the Chargers in 2008, Indianapolis in 2014, Seattle in 2015 and 2018, Cincinnati in 2022 and Baltimore in 2024. Seattle in 2015 was first on the opening-day board.
The Exhibit
Two Games in the Standings, and a Little More
The tiers are coarse. A regression does the same job with the rating as a number. Across the 760 team-seasons from 2002 to 2025, a straight line fitted to playoff appearance, with standard errors clustered by season:
| 2002–2025, 760 team-seasons | Wins in first two, alone | Wins in first two, with rating | Rating, per 100 points |
|---|---|---|---|
| Made the playoffs | +0.250 (0.024) | +0.212 (0.024) | +0.137 (0.018) |
| Win percentage from game three on | +0.074 (0.008) | +0.051 (0.009) | +0.083 (0.008) |
The first row is the headline. The rating takes the value of an early win from 25.0 points of playoff probability to 21.2, so selection explains about 15% of it. For scale, the average top-third team opened 175.3 rating points above the average bottom-third team, and at 0.137 per hundred that whole gap is worth 24.0 points of playoff probability: a little more than one early win and about half of the 42.4-point difference between 0-2 and 2-0 at the same rating.
The second row says why. Beyond the rating, each early win predicts 0.051 more win percentage over the rest of the season, which over the fourteen or fifteen games that remain comes to about three-quarters of a win. So an 0-2 team and a 2-0 team with the same opening rating are separated by the two games themselves, which never leave the standings, and by roughly another win and a half of expected results later on, which is the part that is information about the team. On the rest-of-season row the whole top-to-bottom rating gap, worth 0.146, outweighs two early wins, worth 0.102. On the playoff row it is the other way round, 0.240 against 0.424, because the standings count the two games and do not count the rating.
That is my reading of 0-2. It is mostly not a verdict on the team. It is two games that are already gone, in a season of sixteen or seventeen, plus a modest downgrade. The downgrade is smaller than it feels, and the games already lost are larger than people remember in October.
When Two 0-1 Teams Meet
Every week 2 since 1999 has put some 0-1 teams against each other: 104 such games in 27 seasons, about 3.9 a year, every one of them in week 2. They are as close to a controlled experiment as the schedule offers, because both teams arrive in the same state.
The winners made the playoffs 39 times in 104, 37.5%; the losers 13 times, 12.5%. Twenty-five points of playoff probability changed hands in each of those games. The teams were barely separable beforehand. The engine's favourite won 57 of the 104, the eventual winners had been given .532 on average, and their opening-day ratings averaged 1498.6 against 1480.6 for the losers, an 18-point difference. From game three on, winners played .502 and losers .412. Since 2020 there have been 24 of these games; nine winners and five losers made the playoffs.
Those 25 points are about what the regression above puts on one early win, which is the point. The meeting of two 0-1 teams is not a special kind of game. It is an ordinary game whose loser falls into the bottom row of the base-rate table and whose winner climbs into the middle one.
Week 2, 2026
Fourteen of the sixteen week-2 games involve neither Denver nor Kansas City. They pair three sets of 0-1 teams, three sets of 1-0 teams, and eight games with one of each. Below is every 0-1 team in those fourteen games, with its chance of losing again two ways: the model's, from the board as it stands this morning, and the market's, from Monday morning's moneylines with the hold removed. None of these 28 teams plays tonight, so their ratings will not move before the ledger freezes week 2. Indianapolis is also 0-1, and its game is at Kansas City, so it is left out.
| 0-1 team | Week 2 | Opening-day rank | P(0-2), model | P(0-2), market |
|---|---|---|---|---|
| Tennessee | home to Philadelphia | 32 | .778 | .726 |
| Miami | at San Francisco | 23 | .774 | .863 |
| New Orleans | at Baltimore | 25 | .755 | .757 |
| Cleveland | at Tampa Bay (0-1) | 27 | .659 | .757 |
| Carolina | at Atlanta (0-1) | 26 | .644 | .468 |
| Washington | at Dallas (0-1) | 24 | .549 | .622 |
| Dallas | home to Washington (0-1) | 22 | .451 | .378 |
| Green Bay | at NY Jets | 13 | .394 | .336 |
| New England | home to Pittsburgh | 6 | .358 | .325 |
| Atlanta | home to Carolina (0-1) | 20 | .356 | .532 |
| Tampa Bay | home to Cleveland (0-1) | 18 | .341 | .243 |
| Houston | home to Cincinnati | 5 | .313 | .428 |
| LA Chargers | home to Las Vegas | 14 | .282 | .286 |
| LA Rams | home to NY Giants | 3 | .254 | .256 |
Add them up. Three 0-2 teams are certain from the three meetings. The eight mixed games add 3.91 more by the model and 3.98 by the market, so these fourteen games expect 6.91 0-2 teams by the model and 6.98 by the market, and exactly as many 2-0 teams, since every mixed game makes one of each. The model's exact distribution puts seven at 30.8%, six at 24.8% and eight at 21.4%. Nine or more is 10.2%, and five or fewer 12.9%.
Three of the fourteen opened the season in the top third of the board: the Rams (third), Houston (fifth) and New England (sixth). The model expects 0.92 of them to be 0-2 next week and the market 1.01. A top-third team at 0-2 has made the playoffs one time in five. The Rams' two numbers are within a quarter of a point of each other; Houston's are the furthest apart of the three, .313 against .428.
The biggest disagreement in the table is Carolina at Atlanta, one of the three meetings. The model gives Atlanta .644 at home, off a 55-point rating gap plus home field; the market has Carolina a small road favourite, so Atlanta's chance of 0-2 is .356 by one and .532 by the other. The model knows 2025 and Sunday. The market knows the rest, and on disagreements Sunday's grading page found it right three times in four.
Here is the arithmetic for the third meeting, Washington at Dallas, from the ratings on the power-rankings board this morning:
gap        = 1439.2 (Dallas) + 48 (home) - 1452.7 (Washington)       = 34.5
p(Dallas)  = 1 / (1 + 10 ** (-34.5 / 400))                            = .5495
P(0-2)     = Washington .5495, Dallas .4505

fitted playoff chance, Dallas (opened at 1460.7, 22nd):
at 0-2     = 0.1822 + 0.1368 x (1460.7 - 1505) / 100 = 0.1822 - 0.0606   = .1216
at 1-1     = .1216 + 0.2121                                            = .3337
before     = .1216 + .5495 x 0.2121 = .1216 + .1166                    = .2382
On the fitted line, Sunday afternoon in Arlington is worth 21 points of Dallas's playoff chance, from about 12% to about 33%, and the same for Washington from a slightly lower starting point. The line is pooled over eras and formats, and a fourteen-team field would lift both ends, but the size of the swing is the part to take away.
What This Page Does Not Show
The rating is the engine's, not the market's. The opening-day board is built from earlier seasons' scores and a one-third regression. It knows nothing about the offseason. A preseason view that knew about quarterbacks, coaches and signings would explain more of who starts 0-2, and the share this page gives to the two games would shrink. I cannot measure by how much; the file has no preseason market numbers.
A straight line for a probability. The regression is a linear probability model. It is easy to read and roughly right in the middle, and it will give nonsense at the extremes. The worked example sits in the middle.
Many cells. Nine tier cells, three base rates, two eras, a meeting table and fourteen 2026 teams. The top-third 0-2 against bottom-third 1-1 comparison is 1.4 standard errors, and I have said so where it appears. The regression coefficients are the part that survives: each is at least five standard errors from zero.
Formats are pooled. The playoff field was twelve teams through 2019 and has been fourteen since. Every rate on this page blends both, except the era split.
Selection is not the only confound. Teams that start 0-2 may change quarterbacks, lose players or give up on a season in ways that are consequences of the start. The rest-of-season numbers include all of that. Nothing here says the two losses cause what follows.
Monday's prices. The moneylines are a mid-week snapshot and will move before kickoff. The model's probabilities are today's board; the ledger freezes its week-2 numbers once week 1 is fully graded. Ties are ignored.
Method and Sources
History is the June 2026 nflverse bundle (/data/games.csv, served at /data/games.csv): 7,276 games from 1999 to 2025, of which 6,967 are regular season, with playoff teams read from the postseason rows. The opening-day ratings come from explainer_src/nfl_elo.py, imported rather than copied, replayed over the same file; the replay reproduces the ledger's August 12 board for all 32 teams. The 2026 week-1 results and this morning's ratings come from the dated snapshot saved after Sunday (explainer_src/_2026_week1_snapshot_2026-09-14.json), and the week-2 moneylines from the nflverse pull and ESPN scoreboard saved on the morning of September 14 (explainer_src/_2026_week2_lines_2026-09-14.json). The harness is explainer_src/make_zero_two_starts_chart.py. The regression that carries the page:
# one row per team-season, 2002-2025, first two games decided
made_playoffs = a + b * wins_in_first_two + c * (opening_rating - 1505) / 100
ols_clustered_by_season(...)     # b = 0.212 (SE 0.024), c = 0.137 (SE 0.018)
# the 2026 count: three meetings are certain, the eight mixed games convolve
expected_0_2 = 3 + sum(p_lose for each 0-1 team in a mixed game)   # 6.91 model, 6.98 market
The script asserts the bundle's row counts, the replay's reproduction of the August board, the base-rate table cell by cell with both eras and the conversion counts, the per-season counts, the 25 playoff teams and two champions, the tier table, both regressions with their clustered standard errors and the tier-gap arithmetic, the 104 meetings and every number quoted about them, the pinned ledger scoreboard, the 2026 records, the week-2 classification, all fourteen model and market probabilities, the expected counts and their distribution, the worked example to four places, and this page's own figures: 78 assertions, all green as of September 14, 2026.
Sources: the nflverse public game log (games.csv), with its moneylines; ESPN's public NFL scoreboard for week 2 of 2026. The rating method is Arpad Elo's, from The Rating of Chessplayers, Past and Present (1978); season-clustered standard errors follow Liang and Zeger, Biometrika (1986).
Further reading
- Does Week 1 Mean Anything? — the one-game version: 1-0 and 0-1, and why the opener is an ordinary game
- One Night, 25 Points of Playoff Odds — one week-1 result carried through two seasons, and whether the re-pricing was the right size
- Nine of Thirteen: Sunday, Graded — the week-1 results that made these fifteen teams 0-1
- The Model Has No Good Years, Only Lucky Ones — how little a short sample says, asked of the model instead of the teams
- Elo-Implied 2026 Playoff Odds — the August simulation these base rates sit beside
- One-Score Records Are Luck — another record that says less about a team than it seems
- Fifty Points a Game in Week 1 — the same week, read as points instead of wins
- Power Rankings — the ratings behind every model probability here
- The Prediction Ledger — week 2 freezes once week 1 is fully graded
- Washington, Dallas, Carolina, Atlanta, Cleveland and Tampa Bay — the six teams in week 2's three meetings
Go deeper
Want the code behind these metrics? Work through the 45-chapter NFL analytics tutorial.
Browse tutorials Free tools