Fifty a Game
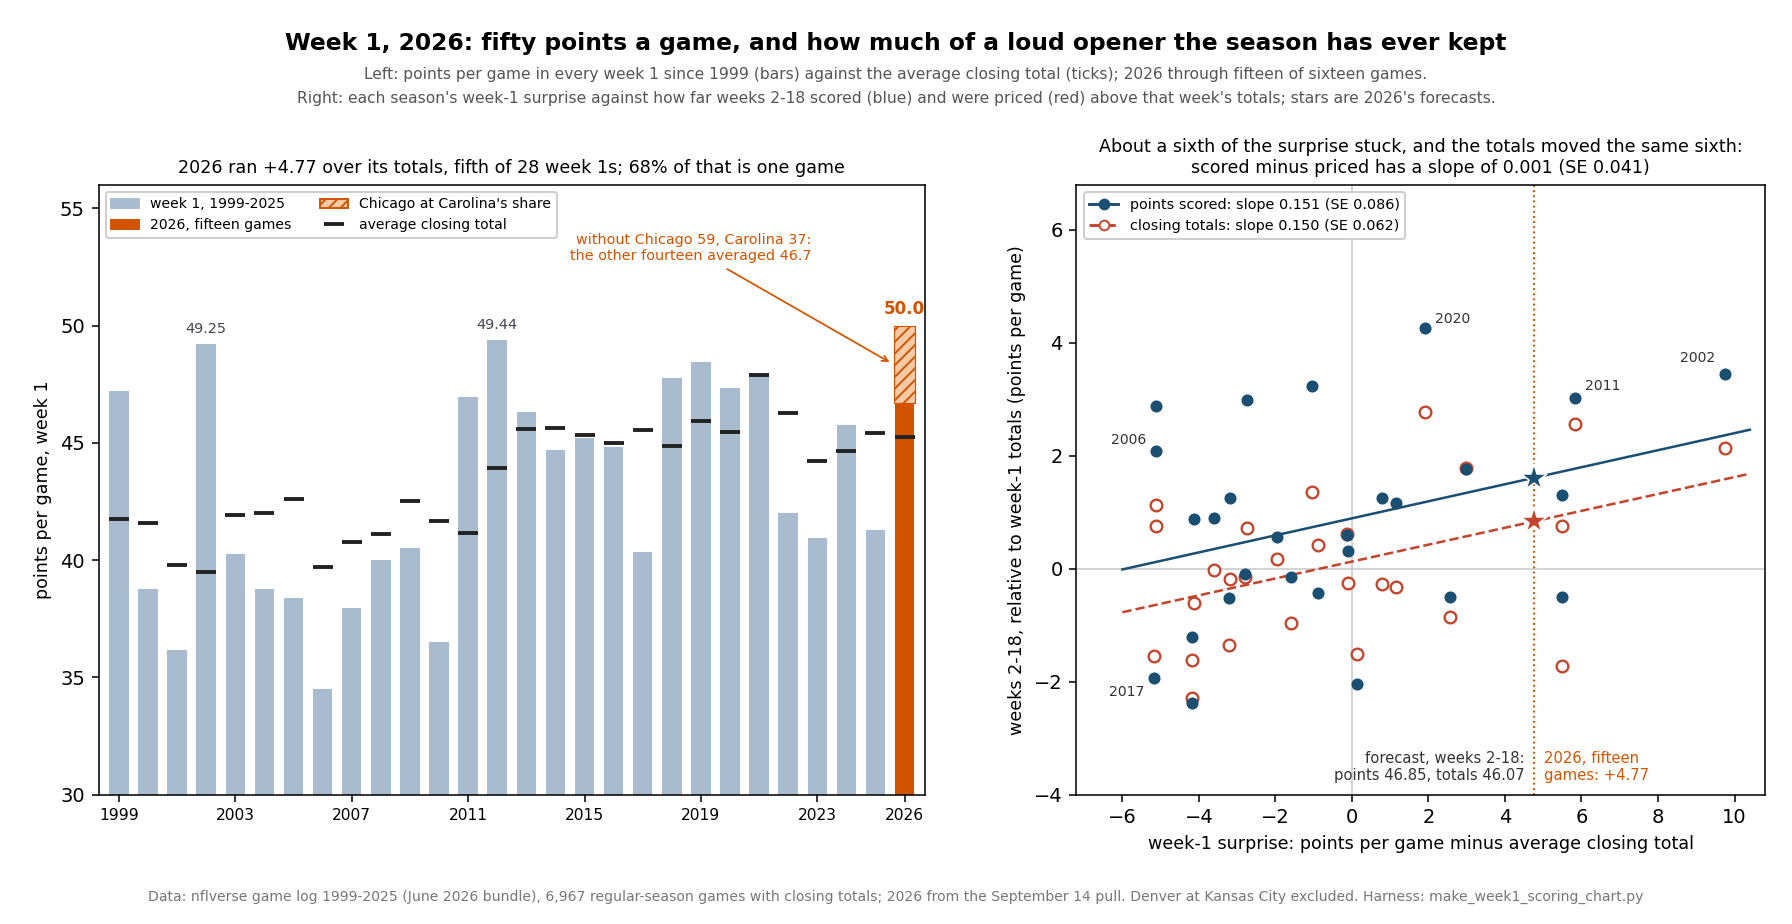
Fifteen of the sixteen week-1 games are final, and they produced 750 points. That is 50.0 points a game, and no week 1 in the nflverse game file comes close to it: the highest full opening week since 1999 is 2012's 49.44, over sixteen games. The closing totals on those same fifteen games averaged 45.23, so the week ran 4.77 points a game over what the market expected. Nine games went over and six under. Denver at Kansas City is tonight, and nothing on this page uses it.
The question a week like that raises is whether it means anything for the other seventeen. People will say the league has changed, the defences are behind, the rules have tilted again. The file has 27 opening weeks to check that against, each with a closing total on every game, and the answer is narrower than either the excitement or the shrug. A loud week 1 has carried about a sixth of its surprise into the rest of the season, and the totals for the rest of the season have moved by almost exactly that sixth. Weeks 2 through 18 then landed on those totals with nothing left over: 0.001 points per point of week-1 surprise.
So my position is that week 1's scoring is real information, that it is worth much less than it looks, and that the market has always priced the part that is worth anything. The rest of this page shows where the fifty came from, what history says it is worth, how this week's week-2 totals compare with what history says they should be, and what the rest of 2026 should score if the pattern holds.
Where the Fifty Came From
Here is every final, highest total first, against its closing total as the game file records it.
| Game | Final | Points | Closing total | Points minus total |
|---|---|---|---|---|
| Chicago at Carolina | CHI 59–37 | 96 | 47.5 | +48.5 |
| Buffalo at Houston | BUF 36–31 | 67 | 44.5 | +22.5 |
| Baltimore at Indianapolis | BAL 41–23 | 64 | 48.5 | +15.5 |
| New Orleans at Detroit | DET 31–30 (OT) | 61 | 49.5 | +11.5 |
| Green Bay at Minnesota | MIN 39–22 | 61 | 46.5 | +14.5 |
| Tampa Bay at Cincinnati | CIN 33–27 | 60 | 50.5 | +9.5 |
| Dallas at NY Giants | NYG 28–20 | 48 | 47.5 | +0.5 |
| Washington at Philadelphia | PHI 24–22 | 46 | 43.5 | +2.5 |
| Cleveland at Jacksonville | JAX 34–10 | 44 | 40.5 | +3.5 |
| Arizona at LA Chargers | ARI 26–14 | 40 | 47.5 | −7.5 |
| Miami at Las Vegas | LV 27–13 | 40 | 40.5 | −0.5 |
| San Francisco at LA Rams (Melbourne) | SF 27–7 | 34 | 47.5 | −13.5 |
| Atlanta at Pittsburgh | PIT 20–13 | 33 | 40.5 | −7.5 |
| NY Jets at Tennessee | NYJ 23–10 | 33 | 39.5 | −6.5 |
| New England at Seattle | SEA 13–10 | 23 | 44.5 | −21.5 |
One row does most of the work. Chicago's 59–37 win in Carolina put 96 points on the board, the most in any week-1 game since 1999 by eight (Tampa Bay and New Orleans combined for 88 in 2018), and tied for the fifth-highest total among all 6,967 regular-season games in the file. Chicago's 59 ties Baltimore's 59 at Miami in 2019 for the most points one team has scored in a week-1 game. The game beat its total by 48.5 points; the fifteen games together beat theirs by 71.5, so Chicago and Carolina supplied 68% of the week's surprise. Take that game out and the other fourteen averaged 46.71 points against totals of 45.07, a week that ran 1.64 points over. That is an ordinary loud week, not a historic one.
The median game was 46 points, less than a point above the average total, which says the same thing another way: a normal-looking week with one very long tail. The two biggest unders were the two games played first. Seattle and New England scored 23 on a 44.5 total, the lowest of the week, and San Francisco and the Rams scored 34 on 47.5.
Tonight's game decides only whether the average keeps its place. Sixteen games at 2012's 49.44 is 791 points, so a combined 42 or more tonight leaves 2026 on top of the table, 41 ties it, and 40 or fewer puts it second. None of the arithmetic below changes either way, because none of it uses that game.
Week 1 Is Usually the Quiet One
This is a strange week for the reason above, and also because week 1 normally goes the other way. Across the 27 seasons from 1999 to 2025, week 1 averaged fewer points than the rest of its own season in 20, and fewer than its own closing totals in 17. Game by game, 428 openers produced 192 overs, 232 unders and 4 pushes. The average week-1 surprise, points per game minus the average closing total, was −0.48, with a standard deviation of 3.89 from season to season. The scoring-by-week page has the same shape in raw points: early-season football is rusty, and the market's openers still lean a little high.
Against that history 2026's +4.77 ranks fifth of 28. Four week 1s beat their totals by more: 2002 (+9.75, at 49.25 points a game), 2011 (+5.84), and 1999 and 2012 (+5.50 each). Those four are the natural comparison set, and they are where the next section starts.
The Exhibit
Does It Stick?
The cleanest baseline for what a season was expected to score is the market's own first look at it: the average closing total in week 1, set before any of that season's games were played. Measure each season's weeks 2 through 18 against that number and regress the gap on the week-1 surprise, one point per season, 27 points in all. The slope is 0.151 points of later scoring per point of week-1 surprise, with a standard error of 0.086 and a correlation of .33. The intercept is +0.89: weeks 2–18 score about nine-tenths of a point more than week-1 totals imply, which is the quiet-opener pattern again.
A second baseline gives the same answer. Measure week 1 and the rest of the season against the previous season's full scoring average instead, for the 26 seasons that have one, and the slope is 0.207 (standard error 0.088, correlation .43). Between the two, a week-1 surprise has been worth something like a sixth to a fifth of itself over the rest of the year. It is a real relationship, a little under two standard errors on the first baseline and a little over on the second, and it is small.
The four loud openers show both the signal and the noise. In 2002 week 1 ran 9.75 points over and the rest of the season finished 3.45 over that week's totals; 2011 ran 5.84 over and the rest finished 3.03 over; 2012, 5.50 and 1.31. 1999 ran 5.50 over and the rest of the season finished 0.50 under its week-1 totals. The quiet openers scatter the same way. 2006 and 2010 each ran 5.12 under in week 1, and their seasons finished 2.08 and 2.89 over. Last year's week 1 ran 4.12 under, and weeks 2–18 of 2025 averaged 46.32 points, 0.88 over its opening totals and, as it happens, the fourth-highest-scoring rest of season in the file.
The Totals Already Move That Sixth
If a sixth of week 1 persists and nobody adjusts, the overs should cash after loud openers. They have not, because the totals move. The average closing total for weeks 2–18, measured the same way against week-1 totals, rises 0.150 points per point of week-1 surprise (standard error 0.062). That is the same size as the 0.151 that the scoring itself kept. The difference between the two, the rest-of-season points minus the rest-of-season totals, has a slope of 0.001 on the week-1 surprise, with a standard error of 0.041 and a correlation of .006.
The over/under record says it without a regression. After the four loudest week 1s, weeks 2–18 went 465 over and 480 under. Across all 27 seasons weeks 2–18 went 3,207 over, 3,237 under, with 95 pushes. The rest-of-season totals do run low on average, by 0.77 points a game, which is the same small low bias the over/under page measured on every game; it does not depend on how week 1 went.
The reaction starts immediately. The average week-2 total rises 0.179 points per point of league-wide week-1 surprise (standard error 0.026), the tightest relationship on this page at a correlation of .81: in a typical season the week-2 totals sit within about half a point (0.52) of what that line predicts. Week-2 results then land on those totals with a slope of 0.039 (standard error 0.215). The market takes its sixth, or a little more, straight away, and the next week gives none of it back.
The League or the Two Teams?
A week-2 total can move for two reasons: the teams in it scored a lot in week 1, or everyone did. The game file can separate them. For each of the 422 week-2 games since 1999 whose two teams both played in week 1, I took the average of the two teams' own week-1 surprises, split it into the league's surprise and each game's distance from it, and regressed the week-2 closing total on those two parts plus the average of the two teams' week-1 totals, with standard errors clustered by season:
| Week-2 closing total, 422 games | Points per point | Clustered SE | Week-2 result minus total | Clustered SE |
|---|---|---|---|---|
| The two teams' week-1 surprise, beyond the league's | 0.132 | 0.012 | −0.040 | 0.066 |
| The league's week-1 surprise | 0.190 | 0.027 | +0.026 | 0.179 |
| The two teams' week-1 closing totals | 0.924 | 0.031 | −0.058 | 0.177 |
Both parts move the number. A point of league-wide surprise moves every week-2 total by 0.190, a point of the two teams' own surprise beyond that by another 0.132, and neither leaves anything in the week-2 results. The Week-2 Line Moves Just Enough found the same thing for the spread; totals behave the same way, and they carry a league-wide component that a spread, being one team against another, cannot.
Here is that fit applied to one 2026 game, Minnesota at Chicago, with Monday morning's total:
own surprise   = (Minnesota +14.5 + Chicago +48.5) / 2            = 31.5
beyond league  = 31.5 - 4.767                                     = 26.733
base           = (Minnesota 46.5 + Chicago 47.5) / 2              = 47.0
fitted total   = 3.288 + 0.1317 x 26.733 + 0.1897 x 4.767 + 0.9235 x 47.0
               = 3.288 + 3.521 + 0.904 + 43.405                   = 51.12
Monday's total = 49.5                                             (1.62 under the fit)
The team that scored 59 is playing in a game the market has set a point and a half below what history's average reaction implies. That is not a bet. The fit misses week-2 totals by 2.80 points (standard deviation) in its own sample, and the market knows about quarterbacks, weather and a summer of practice film that a regression on scores does not.
2026, Written Down in Advance
Applied to this season, the fits give four numbers that can be checked in January. The arithmetic for the first:
weeks 2-18 scoring = week-1 totals + intercept + slope x surprise
                   = 45.233 + 0.893 + 0.1508 x 4.767
= 45.233 + 0.893 + 0.719 = 46.85 points a game| What the history expects | Expected | Checkable |
|---|---|---|
| Weeks 2–18 scoring, against week-1 totals | 46.85 | January; 95% band 43.5 to 50.2 |
| Weeks 2–18 scoring, against 2025's 46.03 | 47.39 | January |
| Weeks 2–18 closing totals | 46.07 | January |
| Weeks 2–18 points minus totals | +0.77 | January; the week-1 surprise adds 0.01 |
| Week-2 totals, league average | 46.08 | Monday's snapshot: 45.64 on fourteen games |
The band on the first number is wide, 3.32 points either way, because 27 seasons of residuals scatter by 1.69 points and the fit cannot tell a 2026 with new rules or a new style of offence from any other year. The forecast is a centre, not a promise. What the history says with more confidence is the last column of the fourth row: however the season scores, the totals should keep pace with it, and a loud week 1 is no reason to expect otherwise.
The week-2 row can be checked now, with a caveat. Monday morning's totals for the fourteen week-2 games that do not involve Denver or Kansas City average 45.64. ESPN's scoreboard, pulled the same morning, lists the same total on all fourteen. The league-level fit expected 46.08, so the market has moved a little less than usual, 0.44 below the line, inside the half-point the fit usually misses by. The fourteen are not the sixteen, and the matchup mix differs from week 1's, so this is a loose check. Game by game, the same fit as above:
| Week 2 | Two teams' week-1 surprise | Fitted total | Monday's total | Difference |
|---|---|---|---|---|
| Washington at Dallas | +1.5 | 45.78 | 50.5 | +4.72 |
| Detroit at Buffalo | +17.0 | 49.21 | 53.5 | +4.29 |
| Miami at San Francisco | −7.0 | 43.28 | 46.5 | +3.22 |
| NY Giants at LA Rams | −6.5 | 46.58 | 48.5 | +1.92 |
| Las Vegas at LA Chargers | −4.0 | 43.67 | 44.5 | +0.83 |
| Green Bay at NY Jets | +4.0 | 43.80 | 44.5 | +0.70 |
| Pittsburgh at New England | −14.5 | 40.90 | 41.5 | +0.60 |
| Philadelphia at Tennessee | −2.0 | 41.63 | 40.5 | −1.13 |
| Minnesota at Chicago | +31.5 | 51.12 | 49.5 | −1.62 |
| Seattle at Arizona | −14.5 | 44.14 | 41.5 | −2.64 |
| Cincinnati at Houston | +16.0 | 49.54 | 46.5 | −3.04 |
| New Orleans at Baltimore | +13.5 | 50.59 | 47.5 | −3.09 |
| Carolina at Atlanta | +20.5 | 46.90 | 43.5 | −3.40 |
| Cleveland at Tampa Bay | +6.5 | 46.44 | 40.5 | −5.94 |
The fourteen differences average −0.33 and miss the fit by 2.65 points on average, against 2.16 in the 422 historical games. That is a little wider than usual, spread across both directions, and I would not read a game into it. The biggest gaps are the ones where the market plainly knows something about the teams rather than about week 1: Washington and Dallas are priced for a shootout neither team's opener suggested, and Carolina, which gave up 59, is in a game priced well below the fit.
What This Page Does Not Show
Twenty-seven seasons. The season-level fits rest on 27 points, and the persistence slope is under two standard errors on one baseline. A sixth is an estimate with a wide interval: anywhere from nothing to about a third is consistent with the data.
The eras differ. From 1999 to 2012 the persistence slope is 0.075 (standard error 0.090); from 2013 to 2025 it is 0.386 (0.164). Week 1 may say more about a season than it used to. The totals moved with it in both halves, 0.093 and 0.333, and the leftover stayed near zero in both, −0.018 and +0.052. I would not lean on the split: two halves of 14 and 13 seasons, cut where I cut them. Dropping 2020, the season played largely without crowds, gives 0.131 for the scoring and 0.134 for the totals.
Several fits, one story. This page reports six season-level regressions, one game-level model and an era split. They all describe the same few numbers from different sides, which is why I trust the pattern more than any single slope. Any one of them, looked at alone, could be chance.
Fifteen games, one of them enormous. 2026's surprise is 68% one game. A league-level fit treats +4.77 as a league-wide number. The 14-game +1.64 is at least as honest a description of what happened on the field, and it would cut the week-1-based forecasts above by about half a point and the one built on 2025's average by about two-thirds.
A snapshot, not closes. Monday's week-2 totals are a mid-week pull; they will move before kickoff, and the historical fits use closing totals. The two sources that agree on them may share an upstream.
Scores and totals only. Nothing here sees pace, weather, injuries, quarterbacks or rule changes. The market's totals do, which is the most likely reason they keep pace so well.
Method and Sources
Three files. History is the June 2026 nflverse bundle (/data/games.csv, served at /data/games.csv): 6,967 regular-season games from 1999 to 2025, every one with a closing total, and no 2026 score in it. The fifteen 2026 finals come from the dated snapshot saved after Sunday's games (explainer_src/_2026_week1_snapshot_2026-09-14.json). Monday's week-2 totals come from a fresh nflverse pull and ESPN's public week-2 scoreboard, both saved on the morning of September 14 to explainer_src/_2026_week2_lines_2026-09-14.json; the pull agrees with the snapshot on all fifteen scores and closing totals. The harness is explainer_src/make_week1_scoring_chart.py. The regressions that carry the page:
# one row per season, 1999-2025
surprise    = mean(week1_points) - mean(week1_total_line)
kept        = mean(weeks2_18_points) - mean(week1_total_line)
priced      = mean(weeks2_18_total_line) - mean(week1_total_line)
ols(kept ~ surprise)             # slope 0.151 (SE 0.086)
ols(priced ~ surprise)           # slope 0.150 (SE 0.062)
ols(kept - priced ~ surprise)    # slope 0.001 (SE 0.041)
The script asserts the bundle's row counts and the absence of any 2026 score in it, the snapshot and Monday's pull against each other, every 2026 row in the first table, the week-1 records and ranks, the historical over/under counts, all six season-level fits with their standard errors, the game-level model with season-clustered standard errors, the era splits and the 2020 check, every forecast and the worked examples to the hundredth, the fourteen week-2 fits against both Monday sources, and this page's own figures: 90 assertions, all green as of September 14, 2026.
Sources: the nflverse public game log (games.csv), including its closing totals; ESPN's public NFL scoreboard for week 2 of 2026, used only to confirm Monday's totals. Season-clustered standard errors follow Kung-Yee Liang and Scott Zeger, Biometrika (1986). Regression toward the mean is Francis Galton's, from 1886.
Further reading
- Nine of Thirteen: Sunday, Graded — the same fifteen games graded as picks rather than as points
- The Week-2 Line Moves Just Enough — the spread's version of this page: week 1 moves the number the right amount
- What Sunday Can Do — the thirteen Sunday games priced as one distribution before kickoff
- The Model Has No Good Years, Only Lucky Ones — another question about how much one week can tell you
- NFL Scoring by Week — why week 1 is usually one of the quieter weeks
- Is the NFL Higher-Scoring Than It Used to Be? — 27 seasons of points, and the totals keeping up
- How Accurate Is the Over/Under? — the total is nearly unbiased on average and wide on any one game
- Weather and NFL Scoring: It's the Wind, Not the Cold — one of the things the totals see and this page does not
- The 2026 NFL Preseason So Far — August's scoring, for the record
- Chicago Bears and Carolina Panthers — the 96-point game, from both sides
- The Prediction Ledger — the frozen probabilities for every 2026 game
Go deeper
Want the code behind these metrics? Work through the 45-chapter NFL analytics tutorial.
Browse tutorials Free tools