Nine of Thirteen
On Friday a page here did something a grading page can use. It took the thirteen probabilities the ledger froze on August 12 for Sunday's games and published, before any of them kicked off, what each outcome would mean: how many picks to expect, how likely a losing Sunday was, what every count would do to the season's miss budget, what the market thought of the same thirteen picks, and what the afternoon could do to the top ten. All thirteen games are final. This page grades What Sunday Can Do number by number, with a harness that recomputes every figure from the refreshed game file and the ledger, and checks every score against a second source.
Nine of the thirteen picks landed. Pittsburgh, Baltimore, Chicago, Jacksonville, Detroit, Cincinnati, Minnesota, Philadelphia and the Giants won; the Chargers, Miami, Houston and Tennessee lost. The ledger is ten for fifteen with a Brier score of .2176, and Denver at Kansas City, tonight, is the one week-1 game still unplayed.
The short version is that Sunday was ordinary on almost every number written down in advance, and I would rather say so plainly than dress it up. Nine was the second most likely count and the exact break-even Friday's page named: the season's miss budget now reads 98.44, under its opening 99.11. The Brier score for the thirteen, .2174, was a little better than the model's own probabilities expected. The market's favourites went ten for thirteen and beat the model by about the margin they usually do, and all of that margin came from the four games Friday singled out. The one number that looks dramatic, seven of the top ten seats changing hands, at the very top of the published range, turns out to be about margins rather than winners: the same thirteen winners at seven points apiece would have moved three.
The Count, on Friday's Table
Here are the thirteen games in order of the model's confidence, with the market's number for the same pick as of Friday morning's pull, the hold stripped. That pull is a snapshot two days before kickoff, not a close, and it is the number Friday's page pre-registered.
| Game | Model's pick | Model | Market, Sep 11 | Final | Pick |
|---|---|---|---|---|---|
| Cleveland at Jacksonville | Jacksonville | .7534 | .7867 | 34–10 | hit |
| Arizona at LA Chargers | Chargers | .7431 | .8000 | ARI 26–14 | miss |
| New Orleans at Detroit | Detroit | .7343 | .7258 | 31–30 (OT) | hit |
| Washington at Philadelphia | Philadelphia | .7280 | .6854 | 24–22 | hit |
| Atlanta at Pittsburgh | Pittsburgh | .6317 | .6690 | 20–13 | hit |
| Green Bay at Minnesota | Minnesota | .5970 | .5261 | 39–22 | hit |
| Miami at Las Vegas | Miami | .5857 | .3962 | LV 27–13 | miss |
| Chicago at Carolina | Chicago | .5777 | .6038 | 59–37 | hit |
| Tampa Bay at Cincinnati | Cincinnati | .5573 | .6369 | 33–27 | hit |
| Buffalo at Houston | Houston | .5540 | .4826 | BUF 36–31 | miss |
| NY Jets at Tennessee | Tennessee | .5519 | .5325 | NYJ 23–10 | miss |
| Baltimore at Indianapolis | Baltimore | .5516 | .6092 | 41–23 | hit |
| Dallas at NY Giants | Giants | .5096 | .4066 | 28–20 | hit |
Friday's distribution gave nine correct exactly 20.5%, second only to eight at 22.6%. Fewer than nine carried 58.9% and nine or fewer 79.3%, so nine sits at about the 69th percentile by mid-rank, 0.54 standard deviations above the expected 8.08. That is about as unremarkable as a result gets without being the mode. The losing Sunday the page gave 17.9% did not happen, and neither did the all-chalk Sunday it gave one chance in 547. Four misses is what a board of thirteen picks priced between .51 and .75 produces most weeks.
The budget is where nine matters. The fifteen games through Sunday were expected to produce 5.67 misses and produced five, so the season's expected misses read 99.11 − 5.67 + 5 = 98.44, the row Friday's table printed for nine correct. Eight would have left it at 99.44, a third of a game over. The budget has been under its opening number once before, at 98.79 after Wednesday's hit, and Thursday's miss took it back over; Sunday puts it two-thirds of a game under. On the season the model is ten for fifteen against a stated 9.33. The week now expects 10.58 correct, up from Friday's 9.66, and will finish at ten or eleven of sixteen depending on tonight.
The Exhibit
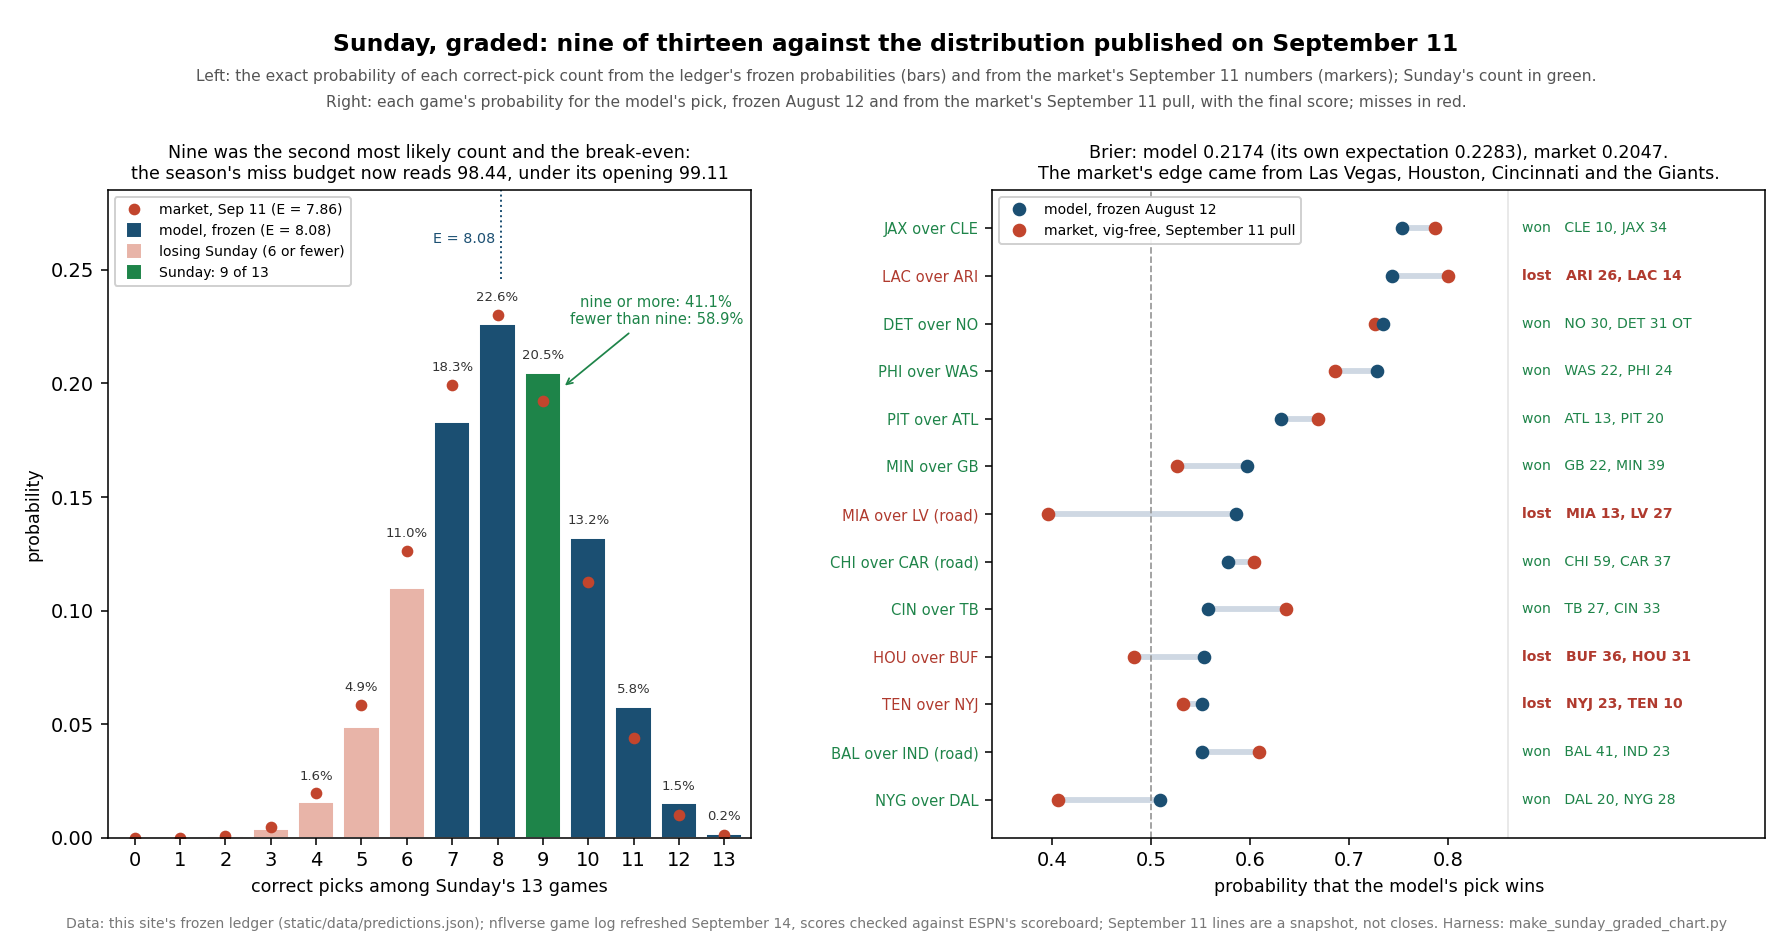
A Better Brier Than the Model Expected of Itself
The count ignores confidence; the Brier score does not. Sunday's thirteen probabilities scored .2174. The same probabilities, if exactly right, expect .2283 over thirteen games, with a standard deviation of .0366, and the exact distribution over all 8,192 ways Sunday could have gone puts a score this good or better at 41.3%. The model did slightly better than its own numbers said it would, by about three-tenths of a standard deviation, which is the kind of margin that turns up four Sundays in ten. The four misses cost 1.507 between them, the Chargers' .5522 the largest single cost on the ledger this season; the nine hits cost 1.319. For the season, fifteen games score .2176 against an expected .2287. After two games it was .2193. A coin scores .2500.
None of that says the model is having a good year, and I am not going to let a nine-for-thirteen Sunday say it for me. The page on good years measured how much a sample can tell you about the rest of a season, given that this model's seasons have never scattered by more than coin flips would make them scatter. At the largest real year-to-year spread sixteen seasons allow, fifteen games carry 2.40% of their surprise. Ten for fifteen against a stated 9.33 lifts the forecast for the remaining 257 regular-season games by 0.27 of a game at that bound, and by nothing at the point estimate. The same page put the ceiling on a five-for-thirteen Sunday at 1.37 games the other way. A good Sunday is worth about a fifth of what a bad one would have cost, at the ceiling, and the ceiling is not a forecast.
The Market's Grade
Friday's page asked the market what it thought of the model's thirteen picks, and the answer was 7.86 expected correct, with nine or more at 36.0%. Nine landed. The market's own favourites expected 8.29 by its own numbers and won ten, a result it gave 24.3%. By the count, the market beat the model by one game.
By Brier, the market's Friday numbers scored .2047 on the thirteen, and the closing prices the game file now carries scored .2012, against the model's .2174. That is a gap of .0127 on the numbers written down in advance. Over the 4,174 regular-season games since 2010 with both moneylines, the fair-prices page measured the same gap at .0101, .2205 for the model against .2104 for the market. Sunday was the market being about as much better than this model as it usually is. No favourite changed between Friday's pull and the close.
Friday named four games where the two disagreed most on the model's pick: three where the market sided against it, and Cincinnati, where both liked the Bengals and the market liked them eight points more.
| Game | Model | Market, Sep 11 | Gap | Final | Brier, model | Brier, market | Landed on |
|---|---|---|---|---|---|---|---|
| Miami at Las Vegas | MIA .5857 | .3962 | +18.9 | LV 27–13 | .3430 | .1570 | market |
| Dallas at NY Giants | NYG .5096 | .4066 | +10.3 | NYG 28–20 | .2405 | .3521 | model |
| Tampa Bay at Cincinnati | CIN .5573 | .6369 | −8.0 | CIN 33–27 | .1960 | .1318 | market |
| Buffalo at Houston | HOU .5540 | .4826 | +7.1 | BUF 36–31 | .3069 | .2329 | market |
Three of the four landed on the market's side. Las Vegas beat Miami by fourteen, Buffalo won in Houston, and Cincinnati won, which on a shared pick rewards the more confident number. The Giants beat Dallas by eight and landed on the model's. Summed, the four games cost the model 1.086 of Brier and the market 0.874, a difference of .213. On the other nine, where the two agreed on the winner, the model scored 1.740 and the market 1.787, so the model was ahead by .047. The whole of Sunday's gap, and more than a quarter again, came from the four games Friday said would decide it.
That is four games, and I will treat it as four games. The page that graded Thursday called two market moves toward the eventual loser the smallest possible amount of a pattern, and four split games going three to one is the next smallest. It is also the least surprising way for the afternoon to have gone. The market's numbers know about quarterbacks, injuries and a summer of camps; the model's know about 2025 and a third of a regression. On Miami at Las Vegas, the argument of the week since June, the market's .6038 on the Raiders won. Friday said one game would not settle which number was right, and it has not.
One more count, because on Thursday I said I would keep it. Between Friday's pull and the close the market moved toward the eventual winner in seven Sunday games, toward the loser in five, and not at all in Las Vegas, where the moneylines closed at the same +142 and −170. The largest move was Pittsburgh, from 5.5 points to 6.5, and Pittsburgh won by seven. Wednesday's and Thursday's moves had both gone toward the loser, so the week's count is seven each way with one unmoved. The windows differ (June to the close for the opener, a mid-week pull to the close since) and the file does not say when its closing number was captured, so this is bookkeeping rather than evidence. It now looks like what it always was.
The Top Ten: Right Range, Different Reason
Friday's page enumerated all 8,192 combinations of Sunday winners at a fixed seven-point margin, weighted each by the model's own probabilities, and made five claims about the board. Seattle would be first in every one. Between three and seven of the top ten's seats would change hands. About 22.4 of the 32 rows would change, never fewer than 14 or more than 29. The largest swing on offer was a Cleveland upset of Jacksonville at 28.79 rating points. And Houston would finish second, seventh or sixth. Here is the pipeline's board this morning, which a replay of the engine reproduces to the tenth on all 32 teams:
| # | Team | Sep 11 | Now | Change | Rank Sep 11 | Sunday |
|---|---|---|---|---|---|---|
| 1 | Seattle | 1683.0 | 1683.0 | · | 1 | played Wednesday |
| 2 | Buffalo | 1615.9 | 1635.5 | +19.6 | 2 | won 36–31 at Houston |
| 3 | Denver | 1612.6 | 1612.6 | · | 3 | plays tonight |
| 4 | San Francisco | 1593.8 | 1593.8 | · | 5 | played Thursday |
| 5 | Philadelphia | 1581.2 | 1586.8 | +5.6 | 7 | beat Washington 24–22 |
| 6 | Houston | 1605.6 | 1586.1 | −19.5 | 4 | lost to Buffalo |
| 7 | New England | 1584.4 | 1584.4 | · | 6 | played Wednesday |
| 8 | Jacksonville | 1565.9 | 1580.5 | +14.6 | 9 | beat Cleveland 34–10 |
| 9 | Los Angeles Rams | 1580.3 | 1580.3 | · | 8 | played Thursday |
| 10 | Baltimore | 1553.4 | 1579.4 | +26.0 | 12 | won 41–23 at Indianapolis |
Graded one at a time. Seattle is first, 47.5 points clear of Buffalo after leading by 67.1 on Friday: held. Twenty-three rows changed against an expected 22.4, a count the enumeration gave 12.5% exactly and 50.7% at or above: dead centre. Houston is sixth, the branch Friday gave .121, and Buffalo second, the .446 branch. Seven top-ten seats changed hands, the top of the published range and a 12.1% outcome on the grid. Detroit won by a point in overtime and still fell out of the top ten, from tenth to twelfth, while Baltimore came in from twelfth. And the Cleveland upset never happened: Jacksonville won by 24, which moved 14.59 points rather than 28.79.
Here is the part the grid could not see. Put the same thirteen winners on Friday's board, each winning by seven, and the enumeration's own arithmetic changes three seats and 18 rows, with Houston seventh. The real afternoon changed seven seats and 23 rows. The winners were the same and the margins were not. Only one game finished at exactly seven, Pittsburgh's; eight were wider, four were closer, and the average was 11.46 points. The average rating move was 20.41 points, against 17.88 for the same winners at seven. Swap each real margin into the all-sevens board on its own and five of them move seats: Baltimore's 18, Jacksonville's 24 and Minnesota's 17 add two each, Detroit's single point and Buffalo's five add one each, and the other eight add none. The effects overlap, which is why eight seats' worth of single swaps comes to four together. Friday's page said in its limitations that a blowout in one game and a field goal in another would produce a different set of seat changes with the same thirteen winners. That is what happened, and the range came out right for a reason the range did not model.
The largest swing on offer was a statement about the grid, and the afternoon went past it. The biggest move anywhere on Friday's grid was 28.79. Two real moves were larger: Arizona's win in Los Angeles moved 35.17 and Las Vegas's win over Miami 30.88, while the Jets' win in Nashville, at 28.66, fell just short. All three were misses, which is the engine paying out at the odds it quoted.
The rankings page does not show any of this as movement yet. Its movement column is a dash in all 32 rows, because it compares against the last fully graded week and week 1 has one game left, and the rankings state file still holds only the opening snapshot. The arrows arrive once tonight's game grades.
The Four Misses, by How Sure the Model Was
The Chargers were Sunday's second most confident pick, .7431 at home to Arizona, behind only Jacksonville. Arizona won 26–14. The market was more confident still, .8000 on Friday's pull and .7867 at the close, so its Brier on the game was worse than the model's, .6400 against .5522. The update rule published on September 8 turns the result into a rating move this way:
gap        = 1530.9 + 48 - 1394.4                          = 184.5   (Chargers at home; published ratings, to the tenth)
p(LAC)     = 1 / (1 + 10 ** (-184.5 / 400))                = 0.7431
multiplier = ln(12 + 1) * (2.2 / (0.001 * 184.5 + 2.2))    = 2.5649 * 0.9226 = 2.3665
shift      = 20 * 2.3665 * (0 - 0.7431)                    = -35.17
Chargers   1530.9 -> 1495.8 (14th to 18th)     Arizona   1394.4 -> 1429.6 (29th to 26th)   (the engine carries unrounded ratings)
Against the 7,276 rating moves the engine has made since 1999, a 35.17-point move is the 95.1st percentile: 357 games moved a rating further. It is the largest rating move of 2026 so far, just past the 34.39 of Thursday's night in Melbourne, which the first grading page put at the 94.3rd percentile. Both were modest-to-heavy favourites losing by double digits, and that is the recipe: the miss pays out at the odds, and the margin multiplies it.
Miami at Las Vegas was the argument of the week, and the model lost it. The model had Miami at .5857 as a road favourite; the market had the Raiders at .6038; Las Vegas won 27–13. The move was 30.88 points, the 89.6th percentile. The Raiders are still thirty-first, now at 1381.8 from 1351.0, and Miami fell from 1459.1 and 23rd to 1428.3 and 27th. The model's case was a 108-point gap built from 2025 results; the market's case was everything since. Sunday voted once.
Houston at .5540 was the only meeting of two top-ten teams, and Buffalo won 36–31. The move, 19.52 points, sits at the 60th percentile, and it is the result that kept Seattle's lead from growing: Buffalo is second at 1635.5, and Houston sixth at 1586.1. Tennessee at .5519, home to the Jets, lost 23–10 and moved 28.66, the 86.1st percentile, without changing a rank: the Titans were last at 1349.8 and are last at 1321.1, and the Jets stay thirtieth.
Four hits moved more than Houston's miss did: Baltimore winning by 18 as a .5516 pick (25.98 points), Chicago by 22 at .5777 (25.84), Minnesota by 17 (22.59) and the Giants by eight at a coin-flip .5096 (21.49). A modest favourite winning big can be a bigger night for this rule than a modest favourite losing narrowly, which is part of why the board moved more than Friday's seven-point grid implied.
It is tempting to call a 35-point move an overreaction to one game, and yesterday's page is the reason I will not. Arizona, an 8.5-point underdog at the close, won by 12, which is 20.5 points better than the line expected and the largest result against the close on Sunday; Chicago beat its number by 19, and Jacksonville and Minnesota by 15.5 each. Across 422 week-2 games since 1999 the market has moved its week-2 number by about 0.0651 points per point of week-1 surprise, which would put about 1.33 points of Arizona's result into its next line, and that habit has been the right size. The engine's 35.17 Elo points come to 1.27 points of spread at 27.75 Elo per point. Both are about a point and a quarter for a twenty-point surprise. That is not a lurch.
What the moves do to next week is small. No week-2 pick changes sides on Sunday's results. The largest price change is the Chargers at home to Las Vegas, from .7879 to .7175; the Jets at home to Green Bay went from .3258 to .3936. The week-2 rows are not frozen in the ledger until week 1 is fully graded, so these are today's prices from today's ratings, not ledger entries.
Tonight, Priced Before Kickoff
Denver at Kansas City is unplayed, and everything in this section is a pre-game price. The ledger's .5805 on Denver was frozen on August 12 and still re-derives from the current board, because neither team played on Sunday. The game carries the week's last .4195 of expected misses, and its own page priced it in advance.
What Sunday changed is what a result tonight is worth on the board. Friday's page said any Denver win would make the Broncos second. Buffalo's 19.6-point gain ended that: with Buffalo at 1635.5 and Denver at 1612.6, it now takes a Denver win by 16 or more to reach second, and any smaller Denver win leaves them third. A Kansas City win by seven would drop Denver to fourth (Friday's page said fifth, on Friday's board), a win by ten to sixth, and a win by fourteen to seventh.
What This Page Does Not Show
One Sunday is thirteen games. The count, the Brier score and the market comparison are each one draw. At the most generous bound sixteen seasons allow, the whole of week 1 through Sunday is worth 0.27 of a game to the forecast for the rest of the season.
The Brier comparison is noisy. The model's .2174 against its expected .2283 is 0.30 of a standard deviation. The .0127 by which the market beat it is close to the historical .0101, and thirteen games cannot distinguish the two.
The market numbers are a snapshot. Friday's lines come from the game file as pulled on the morning of September 11, two days before kickoff. The closing prices are the file's, updated after the games; I have no independent record of when they were captured or whether they were the consensus close.
Four split games are four games. Three going the market's way is consistent with the market being better on disagreements, which is what the history says, and with luck, which is what four games allow.
The board claims were made at a fixed margin. This page grades what Friday's page actually said, and the all-sevens comparison is arithmetic on the same rule. The single-game seat swaps overlap, so they explain the gap between three seats and seven without adding up to it.
Scores only. The engine sees final scores and a neutral-site flag, nothing else. Every score here was checked against a second source; nothing about how the games were played enters any number.
Tonight is unplayed. Every Denver and Kansas City figure above is a price.
Method and Sources
Four files and one module. The nflverse game log as refreshed just after midnight on September 14, saved by the harness as a dated snapshot (explainer_src/_2026_week1_snapshot_2026-09-14.json) because the site's build republishes the June bundle over the served copy at /data/games.csv. The frozen ledger at /data/predictions.json, which nfl_elo.py graded from that pull. Friday's snapshot of the September 11 lines. ESPN's public scoreboard for September 13, pulled at the same time and saved beside the snapshot: all thirteen scores agree with the nflverse file, including the one overtime final, in Detroit. And explainer_src/nfl_elo.py, imported rather than copied, whose replay reproduces the August board, Friday's board and this morning's board to the tenth. The harness is explainer_src/make_sunday_graded_chart.py. The lines that grade Friday's page:
D = pmf([max(p, 1 - p) for p in sunday_p_home])        # Friday's convolution, recomputed from the frozen rows
sum(D[:9]), sum(D[:10])                                # .5886, .7934 -> nine sits at the 69th percentile
at_seven = board_after([(g, shift(g, 7 if home_won(g) else -7)) for g in sunday])
seats_changed(at_seven), seats_changed(ledger_board)   # 3, 7: the same winners, different margins
The script asserts the snapshot and every Sunday score against the lead list and against ESPN, the ledger's scoreboard and all fifteen results, the replay's reproduction of the three boards, Friday's distribution and market numbers recomputed from the frozen rows, the count and its percentiles, the budget arithmetic, the bound from the good-years page, the exact Brier distribution, the market's Brier on the pull and the close, the four splits game by game, the pull-to-close moves, Friday's full 8,192-outcome enumeration and every board claim against the real board, the all-sevens counterfactual and the single-game swaps, the four misses and their percentiles, the worked example, the week-2 prices, tonight's ladder, the rendered rankings page, and this page's own figures: 81 assertions, all green as of September 14, 2026.
Sources: the nflverse public game log (games.csv), with fifteen 2026 games graded and its closing lines; ESPN's public NFL scoreboard for September 13, 2026, used only to confirm the scores. The Brier score is Glenn Brier's, from Verification of Forecasts Expressed in Terms of Probability (1950).
Further reading
- What Sunday Can Do — the page graded here: Sunday's thirteen as one distribution, published before kickoff
- The First Miss — Thursday's result graded against its own pre-registered ladders
- The Opener, Graded — Wednesday's hit, and why one game grades a pick and not a probability
- The Model Has No Good Years, Only Lucky Ones — why nine for thirteen is worth a quarter of a game
- The Week-2 Line Moves Just Enough — how far a week-1 surprise should move next week's number
- Nobody Moved — how many ranks a full week 1 usually changes
- What One Game Moves — the update rule and the 7,276-move percentile scale
- What a 60% Pick Is Worth — the market as the benchmark this model rarely beats
- The Road Favorite Discount That Isn't There — Miami at Las Vegas, the argument since June
- Kansas City Is 17th — tonight's game, priced in advance
- The Miss Budget — the 99.11 that now reads 98.44
- The Prediction Ledger — ten for fifteen, one to go this week
- Power Rankings — the board after Sunday, movement column filling in once week 1 completes
Go deeper
Want the code behind these metrics? Work through the 45-chapter NFL analytics tutorial.
Browse tutorials Free tools