The One Thing It Admits It Cannot See
The engine behind this site's weekly numbers reads final scores and nothing else. The page that states it in full says so in plain terms: it does not know who the quarterback is. That is usually filed as a charming limitation. This page puts a number on it.
Across the sixteen seasons the model has graded, there are 656 regular-season games in which exactly one of the two teams started a different quarterback from the one it started the week before. The model gave those teams a 45.8% chance of winning. The closing market gave them 38.9%. They won 36.5%. The model was 9.28 points too high, the market 2.39, and the model's shortfall is 5.2 standard errors from zero where the market's is 1.4.
Priced as a rating rather than a probability, the model would have needed to dock the changing team 78 Elo points to get those games right — more than the 48-point home-field edge it applies for playing at home. That is the size of the blind spot, and my position is that it is the largest single correction available to this model that it can never make, because the input does not exist in the file it reads.
How a Change Is Counted
The game log records both starting quarterbacks for every played game, by player id. The harness walks the file in date order, and flags a team as having changed if it has already played that season and the id differs from its previous game. A team's first game of a season is never a change, so a new starter installed in the offseason does not count — this is strictly about changes the model could not have absorbed from a full week's scores.
That gives 766 team-games starting a new quarterback from 2010 through 2025, spread across 286 team-seasons, between 27 and 64 of them a season: fewest in 2012, most in 2021. Of the games those teams played, 55 had both sides changing at once, which cancels the comparison and is set aside. The 656 that remain are the clean cases, and all of them carry a two-way closing moneyline, so both forecasters can be graded on the same games.
The comparison is deliberately one-sided in the model's favour. The model's rating already knows everything the team's scores have shown, including any games the departing quarterback played badly. The only thing it cannot know is who is taking the snaps on Sunday. The market knows that, and the gap between the two is what the information is worth.
The Exhibit
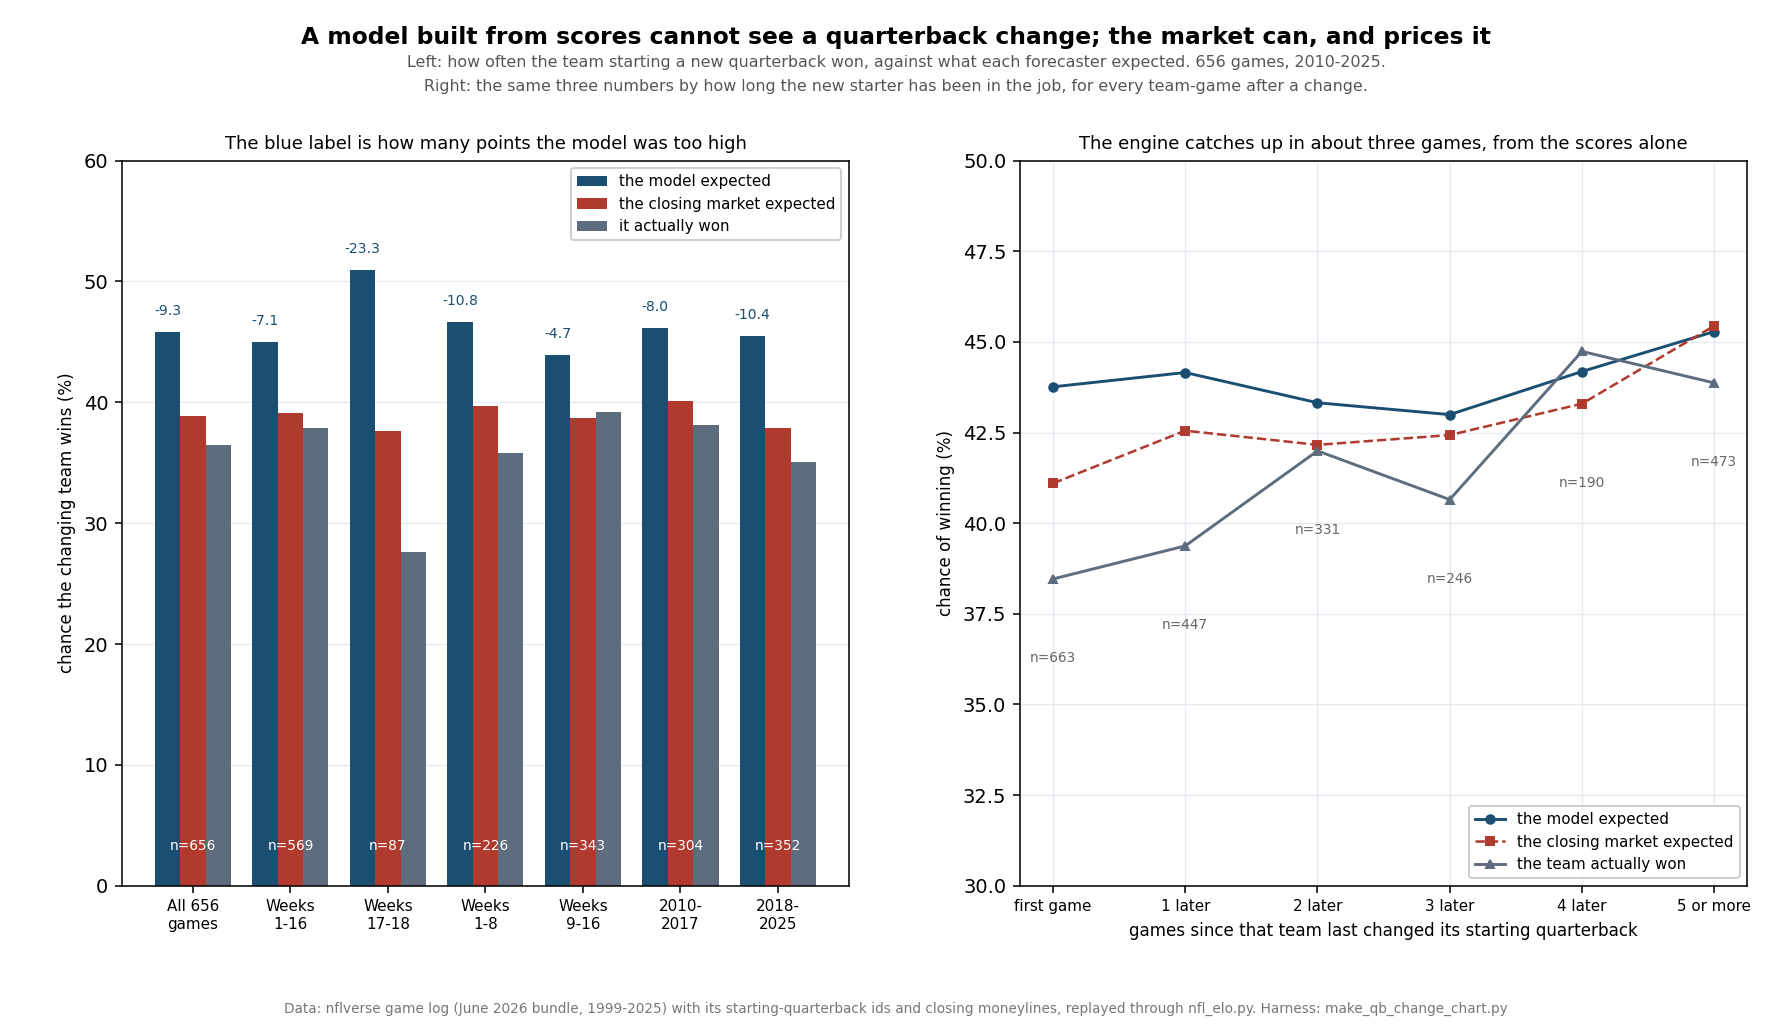
Seven Cuts, One Direction
| The changing team's chance of winning | Games | Model | Market | Actual | Model gap | Market gap |
|---|---|---|---|---|---|---|
| All 656 games | 656 | 45.8% | 38.9% | 36.5% | -9.3 | -2.4 |
| Weeks 1–16 | 569 | 45.0% | 39.1% | 37.9% | -7.1 | -1.2 |
| Weeks 17–18 | 87 | 50.9% | 37.6% | 27.6% | -23.3 | -10.1 |
| Weeks 1–8 | 226 | 46.7% | 39.7% | 35.8% | -10.8 | -3.9 |
| Weeks 9–16 | 343 | 43.9% | 38.7% | 39.2% | -4.7 | +0.5 |
| 2010–2017 | 304 | 46.1% | 40.1% | 38.2% | -8.0 | -2.0 |
| 2018–2025 | 352 | 45.5% | 37.8% | 35.1% | -10.4 | -2.7 |
The third row is the obvious objection, and it is a good one. Weeks 17 and 18 are when teams with a playoff seat settled rest their starters, and those 87 games are the worst the model has ever looked: it expected the changing team to win half the time and the team won 27.6%, a gap of 23.3 points. If that were the whole story, this page would be about the late-season rest pattern and not about quarterbacks.
It is not the whole story. Strip those two weeks out and the remaining 569 games still run 7.1 points under the model's number, which is four standard errors of the season-level estimate. The effect is worst in the first half of the season, 10.8 points across weeks 1 to 8, and smallest from week 9 to week 16, where it is 4.7 points and the market is actually a shade low. It has grown a little across eras, from 8.0 points in 2010–2017 to 10.4 since, which is what you would expect in a league that now changes quarterbacks 50-odd times a year rather than 30-odd.
In all seven cuts the market sits between the model and the truth, and much closer to the truth. That is the pattern that makes this a story about missing information rather than about a broken rating.
Could 656 Games Do This by Chance?
Two checks. Averaged season by season, the model's shortfall is 9.30 points with a standard error of 1.79, and the market's is 2.37 with a standard error of 1.72 — 5.2 standard errors against 1.4. The model overrated the changing team in 14 of the 16 seasons; the market in nine, which is what a fair coin does. The two seasons that went the other way for the model, 2014 and 2015, were also the two best seasons for the market, so they are a shared quiet spell rather than evidence against the effect.
The second check does not assume anything about standard errors. Draw the same number of games from each season at random, assign each one a random side, and measure how far that side's results fell below the model's expectation. In 2,000 such draws, the shortfall was never as large as the real one: the random draws centre on zero with a spread of about a point, and the observed value is 9.3 points below it. Whatever is happening in these games, it is not the accident of having chosen 656 of them.
Graded as Forecasts
Probabilities are cheap; scores are not. On the 656 change games the model's Brier score is .2329 and the market's is .2025. On the 3,463 control games where neither side changed, the model scores .2181 and the market .2119. So the market's usual edge of about six thousandths widens to about thirty on the change games — a factor of roughly five — and the market's score on them is better than its score on ordinary games, because a game with a backup quarterback in it is an easy game to price if you know that.
Straight up, on the 655 decided change games, the model goes .6305 and the market .6855. For scale, the model's overall accuracy is .6469 and the market's is a little under .68, so these games cost the model about a point and a half of hit rate while the market gains. The changing team is also outscored by 4.30 points a game on average, which is close to a field goal and a half of margin that no rating in this system can anticipate.
Worked Through: The Worst One
The single worst game in the file for the model is week 17 of 2020, the Chargers at Kansas City. The Chiefs had clinched and started Chad Henne; the engine, which cannot know that, had the best rating in the league next to a team it had beaten all year:
gap      = (1782.7 Kansas City + 48 home) - 1430.6 Chargers        = 400.1
p(KC)    = 1 / (1 + 10 ** (-400.1 / 400))                          = .9091

the market, same game
  Chargers -282 -> .7382     Kansas City +244 -> .2907     hold 2.89%
  p(KC)    = .2907 / (.7382 + .2907)                               = .2825

result: Chargers 38, Kansas City 21
  Brier, model  = (.9091 - 0) ** 2 = .8264        Brier, market = (.2825 - 0) ** 2 = .0798
Two forecasters 62.7 points apart on the same game, and the gap is one roster decision. The model's .8264 on that game is worth about a fifth of a point of its Brier score for the entire 2020 season on its own. In the five worst such games the market was lower on the changing team than the model every time, which is the cleanest way to see that this is information the model lacks rather than variance it was unlucky with.
The Engine Catches Up in About Three Games
A rating system that reads scores will learn a new quarterback the hard way: by watching the team play worse and marking it down. Here is every team-game after a change, grouped by how many games the new starter has had:
| Games since that team changed quarterback | Team-games | Model | Market | Actual | Model gap |
|---|---|---|---|---|---|
| The first game with the new starter | 663 | 43.8% | 41.1% | 38.5% | -5.3 |
| 1 game later | 447 | 44.2% | 42.6% | 39.4% | -4.8 |
| 2 games later | 331 | 43.3% | 42.2% | 42.0% | -1.3 |
| 3 games later | 246 | 43.0% | 42.4% | 40.7% | -2.3 |
| 4 games later | 190 | 44.2% | 43.3% | 44.7% | +0.6 |
| 5 or more games later | 473 | 45.3% | 45.4% | 43.9% | -1.4 |
The bill is paid in the first two games, 5.3 points and then 4.8, and by the third it is inside a point and a half, where it stays. Two poor results at K = 20 are worth enough rating points to close most of a 78-point gap, which is the update rule doing its job slowly and after the fact. The market's line is flatter throughout, as it should be: it knew on day one, so it has nothing to learn. Note that these rows pool the whole population of post-change team-games rather than the 656 clean matchups, which is why the first row holds 663 and not 656.
What This Page Does Not Show
The file does not say why. An injury, a benching and a rested starter in week 17 all look identical here — a different id in the quarterback column. Those three have different meanings, and the week 17–18 row is the only one of them this page can isolate. The continuity page has the season-level version of the same ambiguity.
Selection is real and only partly controlled. Teams change quarterbacks because something has gone wrong, and a team in that state may be worse for reasons beyond the position. The model's rating absorbs the team's results to date, and the market's price is the benchmark for everything else, but neither is a randomised experiment. Nothing here says the change caused the shortfall.
Seven cuts and a decay table. That is a lot of slicing on one dataset, and the 87-game week 17–18 cell is small. The claims I would defend are the pooled 9.28 points, its season-clustered standard error, the permutation test and the market comparison, all of which are computed on the full 656 before any cut.
78 Elo points is a description, not a patch. It is the constant that would have priced these games correctly in hindsight, fitted on the same games. It cannot be applied going forward, because the 2026 rows in the game file name no quarterback at all until a game is played, and the ledger's frozen rows have no quarterback field in any week.
The market numbers are the file's closing prices, de-vigged proportionally. A different de-vig moves them by a fraction of a point. I have no independent record of when each was captured, and a closing price already contains the news this page treats as the market's advantage.
This is history, not a 2026 claim. Every figure above comes from games played between 2010 and 2025.
Method and Sources
One file and one module. The June 2026 nflverse bundle (/data/games.csv, served at /data/games.csv): 7,276 games from 1999 to 2025, every played one carrying both starting quarterback ids and, from 2010, a two-way closing moneyline; its 272 2026 rows are schedule only and name nobody. And explainer_src/nfl_elo.py, imported rather than copied, whose replay reproduces the published backtest. The harness is explainer_src/make_qb_change_chart.py. The core of it:
changed = prev_starter.get((season, team)) not in (None, qb_id)   # a first game is never a change
# 656 games where exactly one side changed, 2010-2025
model  = mean(p assigned to the changing team)      = .4579
market = mean(vig-free closing price, same side)    = .3890
actual = mean(it won)                               = .3651
# what rating shift would price it:  solve for d in  mean(P(win | rating - d)) == actual  ->  78
The script asserts the engine constants, the bundle's row counts and the absence of any 2026 score or quarterback name, the replay's 4,175 graded regular-season games, the change counts and the team-seasons they span, all three headline rates and both gaps, the season-clustered standard errors and the count of seasons in each direction, all seven cuts cell by cell, the permutation test, both Brier scores and both control Brier scores, the straight-up records, the average margin, the Elo solution, the worked example down to the ratings, the hold and both Brier scores on it, the six decay rows, and the pre-kickoff snapshot's frozen scoreboard: 71 assertions, all green as of September 17, 2026.
Sources: the nflverse public game log (games.csv), including its starting-quarterback ids and closing moneylines. The Brier score is Glenn Brier's, from Verification of Forecasts Expressed in Terms of Probability (1950); the permutation argument is R. A. Fisher's, from The Design of Experiments (1935). The rating method is Arpad Elo's.
Further reading
- Where the Overconfidence Is Not — today's other page: the model's probabilities are well calibrated overall, which this bias survives
- Does QB Continuity Matter? — the season-level count of starters, and the same causation problem
- Our Prediction Model, Fully Stated — the engine that says it cannot see this
- What a 60% Pick Is Worth — the market benchmark, measured over every game rather than these
- What One Game Moves — the update rule that closes the gap two results at a time
- The Offseason Haircut — the one-third regression, which is the same admission made annually
- The Model Has No Good Years, Only Lucky Ones — why a handful of bad games says so little about a season
- Passer Rating vs QBR — how the position gets measured when somebody is measuring it
- The New-Coach Bounce Is Just Regression — another offseason change the ratings cannot see
- The Prediction Ledger — the frozen rows, which contain no quarterback
- Power Rankings — the ratings a change takes about three games to correct
Go deeper
Want the code behind these metrics? Work through the 45-chapter NFL analytics tutorial.
Browse tutorials Free tools