376 Points, and Nothing Unusual
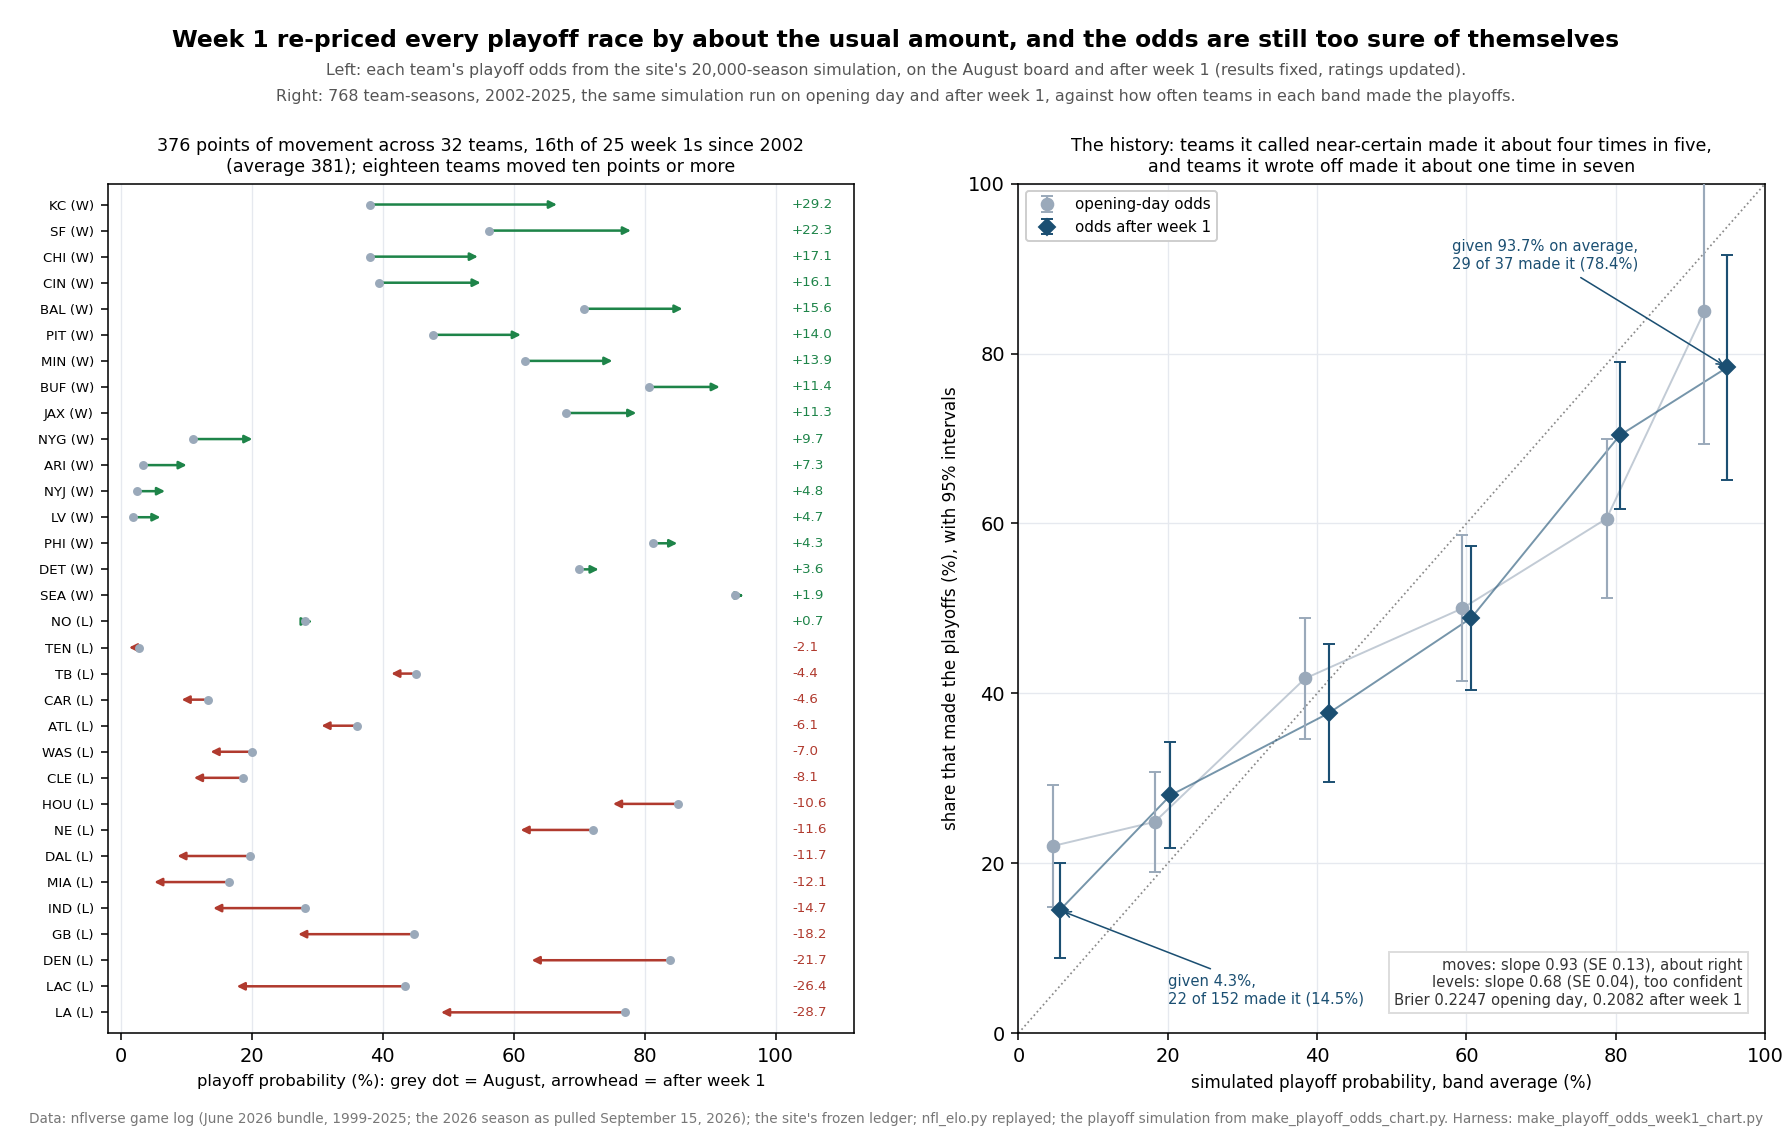
Week 1 is graded, which means this site's playoff simulation can be run again. The August playoff-odds page played the 2026 schedule out 20,000 times from the frozen ratings. I re-ran it first, and all 96 of its published odds reproduce to the tenth. Then I ran it again with the sixteen week-1 results fixed as certainties and the other 256 games priced from this morning's ratings. Across the 32 teams the odds moved by a combined 376 points. Kansas City gained the most, +29.2, from 38.0% to 67.2%. The Rams lost the most, −28.7, from 77.0% to 48.3%. Eighteen teams moved by ten points or more, and three divisions changed favourite.
That reads like upheaval, and it is the ordinary amount. I ran the same simulation on opening day and again after week 1 for every season from 2002 to 2025. The average week 1 moved the board by 381 points, from 292.4 in 2016 to 442.5 in 2005, and 2026's ranks 16th of 25.
The same history answers the question any odds table should face. The moves have been about the right size: across 768 team-seasons, how often a team made the playoffs moved 0.93 points for every point week 1 moved its simulated odds, with a standard error of 0.13. The odds themselves have not been right. Teams the simulation put at 90% or better after week 1 made the playoffs 29 of 37 times, 78.4%; teams it put under 10% made it 22 of 152 times, 14.5%. My position is that the moves on this page deserve belief and the numbers at either end do not, and that the reason is built into the simulation: it treats every rating as exactly right.
Where the 376 Went
Every team, largest gain first. “The result” is the move with the week-1 game fixed but August's ratings kept for everything else; “the re-rating” is the rest, from pricing the other sixteen games with this morning's ratings. All three runs share the same random numbers, and the columns are rounded to the tenth, so a row's parts can miss its total by a tenth.
| Team | Week 1 | August | After week 1 | Change | The result | The re-rating | Division title |
|---|---|---|---|---|---|---|---|
| Kansas City | won | 38.0 | 67.2 | +29.2 | +12.8 | +16.4 | 14.5 → 47.9 |
| San Francisco | won | 56.2 | 78.5 | +22.3 | +11.0 | +11.3 | 11.4 → 23.2 |
| Chicago | won | 38.0 | 55.1 | +17.1 | +6.7 | +10.4 | 13.4 → 19.1 |
| Cincinnati | won | 39.5 | 55.6 | +16.1 | +7.7 | +8.4 | 18.4 → 18.5 |
| Baltimore | won | 70.8 | 86.4 | +15.6 | +7.6 | +8.0 | 49.5 → 56.7 |
| Pittsburgh | won | 47.7 | 61.7 | +14.0 | +6.9 | +7.1 | 24.3 → 22.9 |
| Minnesota | won | 61.8 | 75.7 | +13.9 | +7.0 | +6.9 | 30.5 → 39.3 |
| Buffalo | won | 80.7 | 92.1 | +11.4 | +7.7 | +3.7 | 54.0 → 75.6 |
| Jacksonville | won | 68.0 | 79.3 | +11.3 | +5.0 | +6.3 | 31.6 → 52.4 |
| NY Giants | won | 11.0 | 20.7 | +9.7 | +3.7 | +6.0 | 5.6 → 10.2 |
| Arizona | won | 3.4 | 10.7 | +7.3 | +3.0 | +4.3 | 0.2 → 0.8 |
| NY Jets | won | 2.6 | 7.4 | +4.8 | +1.6 | +3.2 | 0.5 → 1.3 |
| Las Vegas | won | 2.0 | 6.7 | +4.7 | +1.4 | +3.3 | 0.6 → 3.1 |
| Philadelphia | won | 81.3 | 85.6 | +4.3 | +3.8 | +0.5 | 73.6 → 79.9 |
| Detroit | won | 70.0 | 73.6 | +3.6 | +3.9 | −0.3 | 39.1 → 36.0 |
| Seattle | won | 93.8 | 95.7 | +1.9 | +1.8 | +0.1 | 62.5 → 68.8 |
| New Orleans | lost | 28.2 | 28.9 | +0.7 | −0.9 | +1.6 | 22.3 → 26.3 |
| Tennessee | lost | 2.8 | 0.7 | −2.1 | −1.4 | −0.7 | 0.5 → 0.1 |
| Tampa Bay | lost | 45.1 | 40.7 | −4.4 | −4.4 | 0.0 | 37.9 → 38.0 |
| Carolina | lost | 13.3 | 8.7 | −4.6 | −2.3 | −2.3 | 10.3 → 8.0 |
| Atlanta | lost | 36.2 | 30.1 | −6.1 | −2.4 | −3.7 | 29.5 → 27.6 |
| Washington | lost | 20.1 | 13.1 | −7.0 | −4.7 | −2.3 | 10.8 → 6.2 |
| Cleveland | lost | 18.7 | 10.6 | −8.1 | −3.7 | −4.4 | 7.7 → 1.9 |
| Houston | lost | 85.2 | 74.6 | −10.6 | −5.7 | −4.9 | 60.2 → 43.7 |
| New England | lost | 72.1 | 60.5 | −11.6 | −5.4 | −6.2 | 40.6 → 22.2 |
| Dallas | lost | 19.8 | 8.1 | −11.7 | −7.0 | −4.7 | 10.0 → 3.8 |
| Miami | lost | 16.6 | 4.5 | −12.1 | −6.7 | −5.4 | 4.9 → 0.9 |
| Indianapolis | lost | 28.2 | 13.5 | −14.7 | −7.6 | −7.1 | 7.6 → 3.8 |
| Green Bay | lost | 44.7 | 26.5 | −18.2 | −9.3 | −8.9 | 17.0 → 5.6 |
| Denver | lost | 83.9 | 62.2 | −21.7 | −6.4 | −15.3 | 67.0 → 41.3 |
| LA Chargers | lost | 43.5 | 17.1 | −26.4 | −14.0 | −12.4 | 17.9 → 7.8 |
| LA Rams | lost | 77.0 | 48.3 | −28.7 | −9.8 | −18.9 | 25.9 → 7.2 |
Every winner rose, and one loser did too: New Orleans lost in Detroit by a point and gained 0.7, because the teams around it in the NFC South lost ground. On average the sixteen winners gained 11.70 points and the losers gave up the same.
Three divisions changed favourite. In the AFC West, Denver went from 67.0% to 41.3% and Kansas City from 14.5% to 47.9%, on one Monday night and the re-rating it caused. In the AFC South, Houston fell from 60.2% to 43.7% while Jacksonville rose to 52.4%. In the NFC North, Detroit won by a point and still slipped from 39.1% to 36.0%, and Minnesota's 17-point win over Green Bay took it to 39.3%. Buffalo's win in Houston moved the AFC's likeliest 1 seed from Houston, now 9.5%, to Buffalo at 28.9%. Seattle stays the NFC's, at 44.3%.
For the two teams one page here has already followed through the season: One Night, 25 Points of Playoff Odds had San Francisco at 80.7% and the Rams at 51.5% after Thursday. Sunday and Monday took both down a little, to 78.5% and 48.3%, as the teams around them won and the seats filled.
The Result, and the Re-Rating
The split in the table matters more than it looks. A week-1 win counts once in the standings, and it also moves the rating that prices every remaining game. Across the league the two parts are about the same size, 183.1 points for the results and 195.2 for the re-rating, and among the eighteen teams that moved ten points or more the re-rating was the bigger part for ten. Kansas City is the clearest case, because its rating moved almost 35 points on a 21-point win as an underdog:
Kansas City, expected wins over 17 games (the ledger's probabilities)
  August board                                        8.37
  + the win over Denver (.4195 becomes 1)          + .5805   =  8.95
  + the other sixteen games, re-priced             + .7706   =  9.72

Kansas City, playoff odds (20,000 seasons, the same random numbers in each run)
  August 38.0%  ->  the win fixed, August ratings 50.8%  ->  ratings after week 1 67.2%
The win alone is worth 12.8 points of playoff odds; the sixteen re-priced games are worth 16.4 more. Next Sunday's game shows how that happens: Indianapolis at Kansas City was .6224 for the Chiefs on the August board and is .7007 now. The Rams went the other way for the same reason. Their 20-point loss in Melbourne cost 9.8 points as a result and 18.9 as a re-rating. The Chargers show the other shape: losing at home as a .7431 favourite made the result itself, −14.0, the larger part, as it was for eight of the eighteen.
The Exhibit
Twenty-Four Week 1s
The simulation was written for 2026, and running it on 2002 to 2025 needs two changes and nothing else: a six-team playoff field per conference through 2019 and seven from 2020, and a tie counted as half a win for each side, which three week-1 games since 2002 needed. On 2026 the adjusted version reproduces the shipped one exactly. For each season I ran it once from the engine's opening-day ratings and once from its ratings after week 1, with the week-1 results fixed, and counted how far the 32 odds moved.
The average is 381 points and the middle season 389. The quietest week 1 was 2016's at 292.4; the loudest was 2005's at 442.5. 2026's 376 ranks 16th of 25. Against the six seasons with a fourteen-team field, which average 388.3, it ranks fourth of seven. A typical week 1 moves 18.4 teams by ten points or more, and its single largest move averages 26.7 points; Kansas City's 29.2 ranks ninth of 25 by that measure, short of the largest, Chicago's 32.0 in 2019. Nothing about the size of this week's re-pricing is out of the ordinary. What is worth knowing is whether re-pricings like it have been right.
The Moves Were the Right Size
Take each team-season's playoff result, one if the team appears in that season's postseason rows and zero if not, subtract its opening-day odds, and regress that on how far week 1 moved the odds. A slope of one means the moves were exactly the right size. The slope is 0.93, with a season-clustered standard error of 0.13. The SF-LA page found the same thing in expected wins, 1.01, and this is the playoff-odds version of it.
Split by the week-1 result, the 380 winners averaged .443 on opening day and .563 after week 1, and .537 of them made the playoffs; the 380 losers went from .340 to .220, and .253 made it. The simulation spread the two groups 34.3 points apart after week 1, and the real gap was 28.4. That difference belongs to the next section rather than this one: the slope above says the week-1 move itself was about the right size, and the next section says where the odds started.
The moves also made the forecast better. The Brier score of the opening-day odds across 768 team-seasons is .2247; after week 1 it is .2082, an improvement of .0166 with a standard error of .0051 across seasons, and it improved in 20 of 24 seasons (2002, 2003, 2014 and 2018 were the exceptions). For scale, giving every team its league's playoff share, twelve or fourteen in thirty-two, scores .2373. Week 1 is real information and the simulation uses it about correctly.
Too Sure at Both Ends
The trouble is where the odds start. Sort the 768 team-seasons into bands by their simulated odds and count who made the playoffs:
| Simulated odds | Opening day | After week 1 | ||||
|---|---|---|---|---|---|---|
| Teams | Average | Made playoffs | Teams | Average | Made playoffs | |
| Under 10% | 127 | 5.9% | 28 (22.0%) | 152 | 4.3% | 22 (14.5%) |
| 10 to 30% | 205 | 19.5% | 51 (24.9%) | 200 | 19.2% | 56 (28.0%) |
| 30 to 50% | 182 | 39.6% | 76 (41.8%) | 138 | 40.4% | 52 (37.7%) |
| 50 to 70% | 130 | 60.6% | 65 (50.0%) | 133 | 59.4% | 65 (48.9%) |
| 70 to 90% | 104 | 80.0% | 63 (60.6%) | 108 | 79.3% | 76 (70.4%) |
| 90% or more | 20 | 93.1% | 17 (85.0%) | 37 | 93.7% | 29 (78.4%) |
Above 50% the realised rate falls short in every band, and below 30% it runs over. On opening day, teams the simulation gave under 10% made the playoffs 22.0% of the time, and teams it gave 70 to 90% made it 60.6%. After week 1 it is better and still off: 29 of 37 teams given 90% or more made it, and 22 of 152 given under 10%. Regress the result on the odds, and a calibrated forecast would have a slope of one. The opening-day odds have a slope of 0.60 (standard error 0.04), and the odds after week 1 have 0.68 (standard error 0.04). Both are several standard errors short of one.
The cause is not mysterious. The simulation draws every game at the probability the ratings imply, as if those ratings were exactly right, so its only uncertainty is the bounce of each game. The August page said as much: its band holds “even if they're exactly right.” They are not. A rating built from last season's scores and a one-third regression cannot see new quarterbacks, injuries, or its own error, and a season simulated from a rating that is ten or twenty points wrong spreads further than one simulated from the truth. A team the simulation calls a lock is partly a team whose rating happens to be too high. Week 1 helps, because it replaces some of that guess with evidence, and the slope rises from 0.60 to 0.68. How far later weeks close the rest of the gap is a question for a later page; I have not measured it.
For 2026 that is a reading instruction, not a new table. Seattle at 95.7% and Buffalo at 92.1% are the two teams in the top band, and the simulation expects 1.88 of them to make the playoffs; at the history's 78.4% it would be 1.57. Carolina, Dallas, the Jets, Las Vegas, Miami and Tennessee are the six under 10%, and the simulation expects 0.36 of them to get in; the history's 14.5% would say 0.87. I would not publish those history rates as corrected odds. The bands pool 24 seasons and two playoff formats, and a proper correction would be a different model, which this page is not. What the history does say plainly is that the ends of this table are too far from the middle.
What This Page Does Not Show
A re-run, not a new forecast. The August page is the site's published playoff-odds table and it stays as written. The after-week-1 numbers here are the same simulation run on this morning's ratings, dated September 15, and they will be out of date by Monday.
Ratings treated as exact. That is the finding and also the limitation. Correcting for it properly would mean simulating the uncertainty in each rating, which is a different model from the one the site ships.
Ties in the standings broken at random. The shipped simulation does not apply head-to-head or division records. The August page flagged this; it matters most for teams near the cut line and least for the teams at either end.
Replayed ratings, not published ones. The history uses the engine's replay of each season, built the same way as the 2026 ratings. Nobody published those odds at the time, so the test is of the method, not of any page.
768 team-seasons, not 768 independent tests. Within a season the odds are tied together, since the playoff seats are fixed, so the standard errors are clustered by season. The top band after week 1 holds only 37 team-seasons, and its 78.4% has a standard error of about seven points.
Two formats pooled. The field was twelve teams through 2019 and has been fourteen since. The week-1 totals are compared within the fourteen-team era as well; the calibration bands are not split, because the newer era has only 192 team-seasons.
Method and Sources
Three files and one module. The 2026 season as pulled on the morning of September 15, after Monday's game, with the frozen August ratings and the ratings after week 1 (explainer_src/_2026_week1_snapshot_2026-09-15.json). The June 2026 nflverse bundle for 1999–2025 (/data/games.csv, served at /data/games.csv), with each season's playoff teams read from its postseason rows. The published August table in explainer-2026-playoff-odds, which the harness parses and reproduces cell by cell. And explainer_src/nfl_elo.py, imported rather than copied, for the ratings and the probability of each game. The simulation is the one in make_playoff_odds_chart.py, copied term for term. The harness is explainer_src/make_playoff_odds_week1_chart.py. The lines that carry the history:
# every season 2002-2025, the shipped simulation (20,000 seasons, seed 2026)
opening = simulate(schedule, ratings_on_opening_day, wild_cards=2 if season <= 2019 else 3)
after_1 = simulate(schedule, ratings_after_week_1, fixed=week_1_results)     # a tie is half a win
# 768 team-seasons; made = 1 if the team appears in that season's postseason rows
ols(made - opening ~ after_1 - opening)    # slope 0.93 (SE 0.13, clustered by season): moves right-sized
ols(made ~ after_1)                         # slope 0.68 (SE 0.04): odds too far from the middle
The script asserts the snapshot and the June bundle against each other, the replay's reproduction of the August ratings and the ratings after week 1, the shipped and generalised simulations against each other, all 96 published August odds, every row of the 32-team table and every figure quoted about it, the three division changes and the 1-seed change, the split into the result and the re-rating with Kansas City's worked example, the 24-season history's counts, totals, ranks and largest moves, the Brier scores and their season-level standard error, both regressions, all six calibration bands in both states, the 2026 band counts, and this page's own figures: 68 assertions, all green as of September 15, 2026.
Sources: the nflverse public game log (games.csv). The Brier score is Glenn Brier's, from Verification of Forecasts Expressed in Terms of Probability (1950); season-clustered standard errors follow Liang and Zeger, Biometrika (1986). The rating method is Arpad Elo's.
Further reading
- Elo-Implied 2026 Playoff Odds — the August table re-run here, and the simulation behind it
- Ten of Sixteen: Kansas City 31, Denver 10, Graded — the game that moved the AFC West, graded
- One Night, 25 Points of Playoff Odds — Thursday's result carried through the season, and why the moves are the right size
- The 0-2 Hole Is Mostly the Two Games — the same question asked of real playoff rates, two games in
- Does Week 1 Mean Anything? — 1-0 and 0-1 teams, and how often each made the playoffs
- The Model Has No Good Years, Only Lucky Ones — a different calibration question, asked of the model's picks
- 2026 Win Totals — the expected wins the simulation turns into odds
- The Six Games That Count Double — why division games move division odds so much
- Kansas City Is 17th — the rating that made the Chiefs 38% in August
- The Offseason Haircut — the one-third regression the ratings start from, and what it cannot see
- Power Rankings — the ratings after week 1
- The Prediction Ledger — week 2's frozen probabilities
Go deeper
Want the code behind these metrics? Work through the 45-chapter NFL analytics tutorial.
Browse tutorials Free tools