Kansas City 31, Denver 10
The last game of week 1 went the other way. The ledger froze Denver at .5805 on August 12, a home probability of .4195 for Kansas City, and the Chiefs won by 21. The refreshed nflverse file has the final as Kansas City 31, Denver 10, and ESPN's public scoreboard for September 14, pulled this morning, has the same score. The miss costs the ledger .3370 of Brier score for the game and leaves week 1 at ten of sixteen, with a Brier score of .2251.
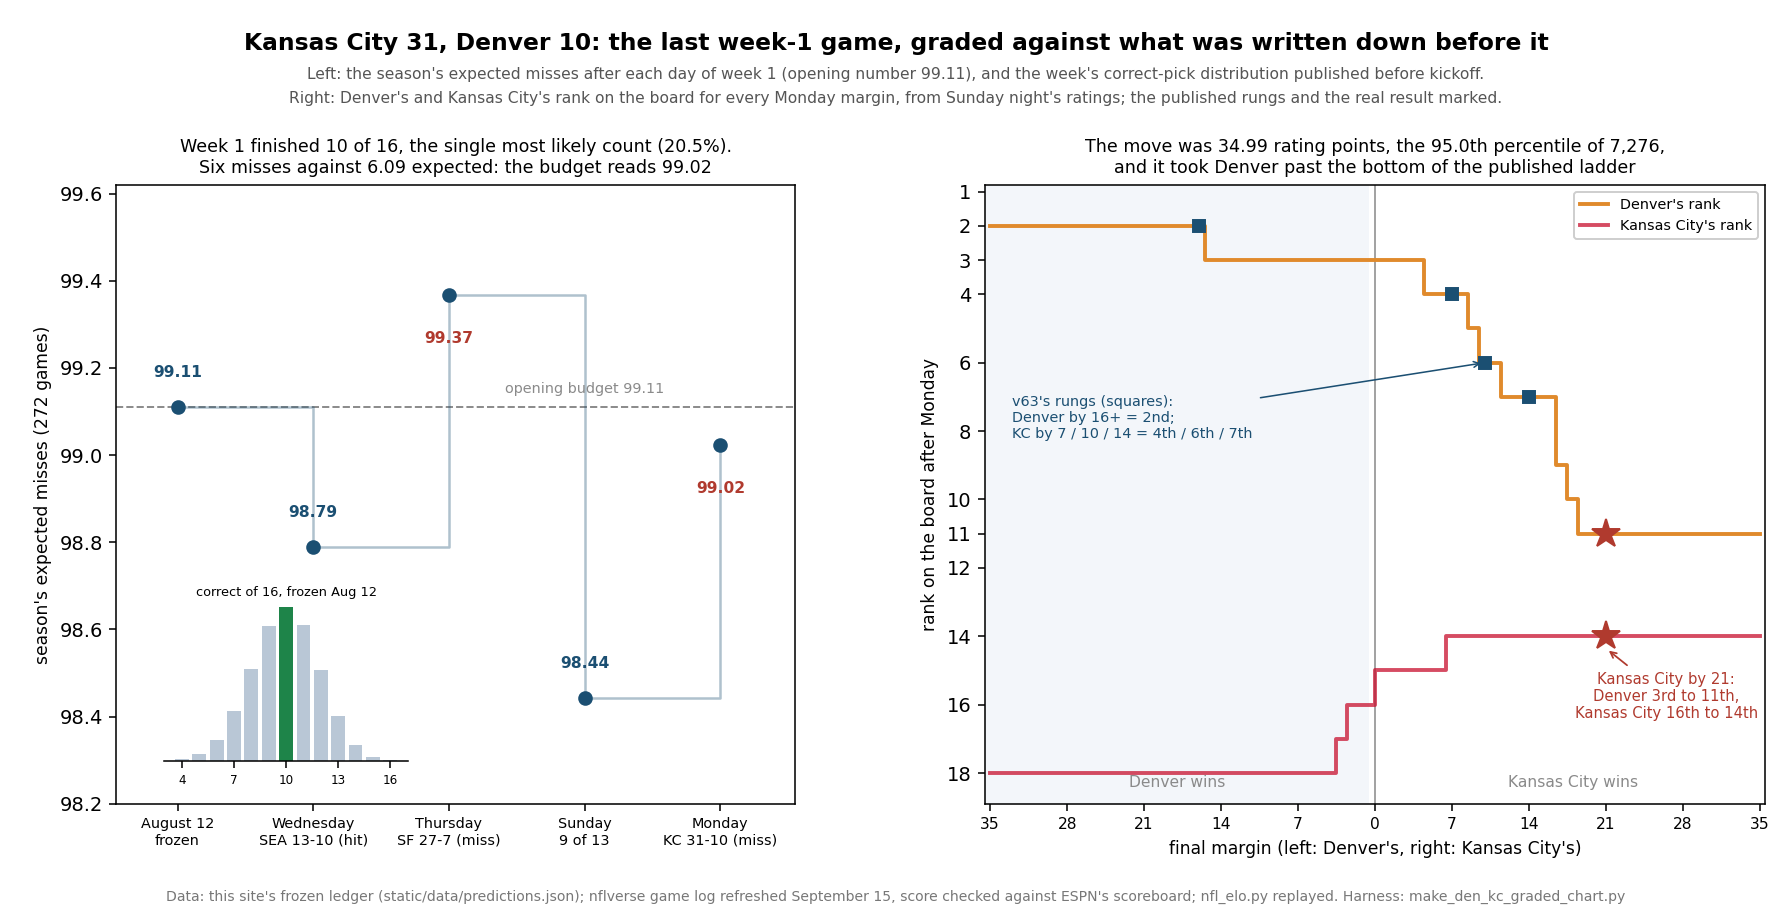
One night produced two different kinds of result, and I want to keep them apart. The week as a whole is about as dull as a graded week gets. Ten correct is the single most likely count the model published before the season, six misses against 6.09 expected is the miss budget to within a tenth of a game, and the Brier score finished slightly better than the model's own probabilities expected. Monday itself was not dull. The rating move, 34.99 points, is at the 95.0th percentile of every move the engine has made since 1999, and it took Denver from third on the board to eleventh, below the bottom rung of the ladder yesterday's grading page printed. The 41 points the two teams scored also did something oddly exact: they left 2026's week 1 tied with 2012's for the most points in the file, to the point.
This page grades each of those against what was written down in advance: the pick and the market's numbers for the game, the full week against the pages that pre-registered it, Monday's ladder against the board the pipeline published this morning, the scoring threshold, and what Denver's loss does to yesterday's 0-2 page.
The Pick, and the Market's Summer
The row is arithmetic on two ratings neither team had changed since August, because neither had played:
gap      = (1508.2 + 48) - 1612.6            = -56.4     (Kansas City at home, published ratings)
p(KC)    = 1 / (1 + 10 ** (56.4 / 400))      = .4195     -> the pick is Denver at .5805
Brier    = (.4195 - 1) ** 2                  = .3370
Kansas City Is 17th set this game up on September 4 as a live test: the model on Denver at 58.05%, the market on Kansas City at 58.30%, the two 16.35 percentage points apart. Here is the market's number for Kansas City at every pull the site saved, with the hold stripped:
| Source | Line | Moneylines (DEN / KC) | Kansas City | Brier on the game |
|---|---|---|---|---|
| June bundle | KC by 2.5 | +130 / −155 | .5830 | .1739 |
| September 11 pull | KC by 2.5 | +124 / −148 | .5721 | .1831 |
| September 14, just after midnight | KC by 2.5 | +114 / −135 | .5514 | .2012 |
| September 14, morning | KC by 2.5 | +110 / −130 | .5427 | .2091 |
| Close, as the file now records it | KC by 2.5 | +110 / −130 | .5427 | .2091 |
| The model, frozen August 12 | — | — | .4195 | .3370 |
The market had Kansas City as the favourite all summer and drifted toward Denver the whole way, from .5830 to .5427, without moving the spread off 2.5. At the close the two numbers were still 12.3 points apart on Denver, the second-widest gap of the sixteen games behind Miami at Las Vegas. The close scored .2091 on the game and the model .3370. That settles the game and not the argument. The Chiefs page made its case about one-score games: the engine had docked Kansas City for going 1–9 in them in 2025 and credited Denver for 11–2, and that page's own research says those records are mostly noise. A 21-point game says nothing about one-score games either way.
The bookkeeping I have been keeping since Thursday takes one more entry. From the September 11 pull to the close the market moved toward Denver, the loser. With Sunday's count, the week finishes with seven moves toward the eventual winner, eight toward the loser, and one unmoved. It remains bookkeeping, and it now looks like a coin.
Week 1, Complete
Five pages here, and the model’s own probabilities, said in advance what an ordinary week 1 would look like. All of them can be graded now.
| Written in advance | What it said | Week 1 |
|---|---|---|
| The Model Gets Louder, Not Smarter | 9.91 correct expected; ten the most likely count at 20.5%; 7 to 13 holds 93.6% | Ten. The mode, at the 51st percentile |
| The Miss Budget | 6.09 misses; a 10–6 week “is the budget, not a stumble” | Six misses; the season reads 99.02 |
| The model's own probabilities | An expected Brier score of .2296 | .2251; 46.9% of outcomes do this well or better |
| The Week 10 Problem That Isn't | A week means something only past 11.80 points of spread error, or under .550 for the model | 11.28 and .625: neither |
| What a 60% Pick Is Worth | The market has beaten this model's Brier by .0101 a game since 2010 | Closing favourites won 12 of 16; market .2136, a gap of .0115 |
| The Model Has No Good Years | A sixteen-game week carries at most 2.55% of its surprise | About 0.04 of a game for the other 256 |
The count is the easy one. The exact distribution of sixteen frozen probabilities puts 40.8% below ten and 61.3% at or below it, so ten sits almost exactly in the middle. The miss budget is nearly as exact: 6.0868 misses expected, six recorded, and the season's expected misses read 99.11 − 6.09 + 6 = 99.02, 0.09 under the opening number. It has had a busy week getting there, 98.79 after Wednesday's hit, 99.37 after Thursday's miss, 98.44 after nine of thirteen on Sunday, and 99.02 now.
The Brier score of .2251 beat the .2296 the model expected of itself by 0.14 standard deviations; over all 65,536 ways the week could have gone, 46.9% score this well or better. The market's closing favourites went twelve of sixteen against the model's ten, and the market's Brier of .2136 beat the model's by .0115, a hair more than the .0101 it has averaged over 4,174 games. Neither of the week-10 page's bars was tripped. And at the most generous bound the good-years page allows, ten correct against 9.91 expected is worth about 0.04 of a game to the forecast for the rest of the season. I will say it plainly: week 1 told us nothing about this model that August did not.
The Exhibit
The Board: Below the Bottom Rung
Yesterday's page priced Monday on Sunday night's board: a Denver win by 16 or more would make the Broncos second and any smaller Denver win would leave them third; a Kansas City win by seven would drop Denver to fourth, by ten to sixth, by fourteen to seventh. All four rungs reproduce on the same board, and the real result went past all of them. The ladder keeps going: a Kansas City win by seventeen puts Denver ninth, eighteen tenth, and nineteen or more eleventh, where it stops. Even a 35-point loss would leave Denver at 1572.0, above Detroit's 1567.3. Kansas City's seat was never in much doubt: fifteenth for a win of one to six points, fourteenth for seven or more, and no margin lifts it higher.
| # | Team | Rating | Sunday night | Monday |
|---|---|---|---|---|
| 1 | Seattle | 1683.0 | 1 | unchanged |
| 2 | Buffalo | 1635.5 | 2 | unchanged |
| 3 | San Francisco | 1593.8 | 4 | up one as Denver fell |
| 4 | Philadelphia | 1586.8 | 5 | up one |
| 5 | Houston | 1586.1 | 6 | up one |
| 6 | New England | 1584.4 | 7 | up one |
| 7 | Jacksonville | 1580.5 | 8 | up one |
| 8 | LA Rams | 1580.3 | 9 | up one |
| 9 | Baltimore | 1579.4 | 10 | up one |
| 10 | Minnesota | 1578.7 | 11 | up one, into the top ten |
| 11 | Denver | 1577.6 | 3 | lost 31–10, −34.99 |
| 12 | Detroit | 1567.3 | 12 | unchanged |
| 13 | Chicago | 1554.5 | 13 | unchanged |
| 14 | Kansas City | 1543.2 | 16 | won 31–10, +34.99 |
| 15 | Pittsburgh | 1530.7 | 14 | down one |
| 16 | Green Bay | 1513.3 | 15 | down one |
Twelve rows changed: eight teams moved up one place as Denver fell through them, Pittsburgh and Green Bay moved down one as Kansas City passed them, and the two teams that played moved eight places and two. Denver is now eleventh and Kansas City fourteenth. Seattle is 47.5 points clear of Buffalo, as it was on Sunday night. Twelve rows is a lot for one game; Nobody Moved put the median game at four rows and the most any game has ever reordered at seventeen.
That page also said how much of the board a whole week 1 rearranges: on average 26.2 of the 32 ranks between the August board and the Tuesday after the first Monday night game, never fewer than 22 and as many as 30. This Tuesday the count is 23 of the 32, at the quiet end of the range, with Seattle still first. Since August, San Francisco has risen seven places to third and the Giants five; Denver has fallen seven to eleventh and the Rams five to eighth.
The rankings page now shows those arrows. Two pages here said it would start once Monday's game graded, and the build this morning froze its “after week 1” snapshot. The arrows measure movement since the August board, not since Sunday, so Denver's shows a fall of seven, not eight.
The Move, Worked Through
The update rule turns the result into rating points in three lines. Kansas City won, so the damping term uses the size of the winner's rating edge, which was negative here: the Chiefs were the lower-rated side even with home field.
winner edge = (1508.2 + 48) - 1612.6                      = -56.4
multiplier  = ln(21 + 1) * (2.2 / (0.001 * 56.4 + 2.2))    = 3.0910 * 0.97500 = 3.0138
shift       = 20 * 3.0138 * (1 - .4195)                    = 20 * 3.0138 * .5805 = 34.99
Kansas City   1508.2 -> 1543.2 (16th to 14th)       Denver   1612.6 -> 1577.6 (3rd to 11th)
Against the 7,276 rating moves in the file, 34.99 sits at the 95.0th percentile: 366 games moved a rating further. It is the second-largest move of 2026, a fifth of a point behind Arizona's win over the Chargers at 35.17 and just ahead of Thursday's in Melbourne at 34.39. The three share a shape: a side the model preferred, beaten by twelve points or more. What made Monday's large was the margin and the damping term, which barely damped at 0.975 because the rating edge was small.
For scale in points: Kansas City, a 2.5-point favourite at the close, won by 21, which is 18.5 points better than the line expected. At the 27.75 rating points per point of spread the week-2 page fitted, the engine's 34.99 is 1.26 points of spread; the week-2 line's historical habit of 0.0651 points per point of surprise would move 1.20. About a point and a quarter either way, again.
Forty-One Points, Exactly 2012
Fifty Points a Game in Week 1 wrote down what Monday would do to its table before kickoff: sixteen games at 2012's 49.44 is 791 points, so 42 or more would leave 2026 on top, 41 would tie, and 40 or fewer would put it second. Denver and Kansas City scored 41. I recomputed it from the scores rather than the rounded averages. 2012's week 1 produced 791 points in sixteen games, the most of any week 1 from 1999 to 2025, and 2026's sixteen games produced 791. Both are 49.4375 points a game. 2026 neither leads 2012 nor trails it: the two are tied for the highest-scoring week 1 in the file.
The game went under its 42.5 total by a point and a half, so the week finished with nine overs and seven unders. Over all sixteen games the closing totals averaged 45.06, which makes the full week's surprise +4.38 points a game rather than the +4.77 of fifteen games; it is still fifth of 28 opening weeks, and 2012 beat its totals by 5.50 with the same points. None of that page's forecasts used Monday's game, so its 46.85 points a game for weeks 2 through 18 stands as written.
What Denver's Loss Does to 0-2
Yesterday's 0-2 page left Denver and Kansas City out of its count because their game was unplayed, and made one claim this morning could check: none of the 28 teams in the other fourteen week-2 games played on Monday, so their ratings would not move before the ledger froze week 2. The ledger froze week 2 this morning, and all fourteen probabilities are the ones that page printed, to the third decimal.
Denver is the sixteenth team at 0-1. Its week-2 game is at home to Jacksonville, which is 1-0, so it is not a fourth meeting of 0-1 teams; the three meetings are still Carolina at Atlanta, Cleveland at Tampa Bay and Washington at Dallas. Indianapolis, 0-1, plays at Kansas City, now 1-0. Both are mixed games, each making one 0-2 team or none:
expected 0-2 teams, all sixteen week-2 games (frozen ledger probabilities)
  three meetings of 0-1 teams                  3
  the eight mixed games on the 0-2 page      + 3.9066     (6.9066, the page's 6.91)
  Denver loses at home to Jacksonville       +  .4354
  Indianapolis loses at Kansas City          +  .7007
                                             = 8.0427
So the full slate expects 8.04 teams at 0-2 by the model. Denver's .4354 is the ledger's number; this morning's moneylines, Jacksonville +114 and Denver −135, put it at .4486. Denver opened the season fourth on the board, so the top-third teams at 0-1 are now four rather than three: the Rams, Denver, Houston and New England, of whom the model expects 1.36 to be 0-2 next week, where the page had 0.92 of three. On that page's fitted line, a team that opened at Denver's 1612.6 has a playoff chance of about .3294 at 0-2 and .5415 at 1-1. Sunday in Denver is worth 21 points of that either way, from a starting point of .4491.
What This Page Does Not Show
One game grades a pick. The model's .4195 lost and the market's .5427 won, and a single result cannot say which probability was closer to right. It also says nothing about the one-score argument the Chiefs page made, since the game was not close.
The week is one draw. Ten of sixteen and a Brier score of .2251 sit 0.14 standard deviations from what the model expected of itself. At the most generous bound the good-years page allows, the whole week is worth about 0.04 of a game to the forecast for the rest of the season.
The market numbers are snapshots. The June, September 11 and September 14 lines are the game file as pulled on those dates. The closing prices are the file's; I have no independent record of when they were captured.
The ladder is arithmetic, not a forecast. Ranks at a stated margin are the update rule applied to Sunday night's ratings, in whole points, with the build's tie-break. It was a statement about the board, and it is graded as one.
A tie in points is only that. 2012 and 2026 scored the same number of points against different closing totals, in leagues with different rules. The scoring page covers what that is worth for the rest of the season.
The 0-2 numbers are the same kind as yesterday's. The expected count assumes independent games; the fitted playoff line is a linear probability model pooled over 24 seasons and both playoff formats; Tuesday's moneylines will move before Sunday.
Method and Sources
Four files and one module. The nflverse game log as refreshed on the morning of September 15, saved as a dated snapshot with the ledger fields it produced (explainer_src/_2026_week1_snapshot_2026-09-15.json), because the site's build republishes the June bundle over the served copy at /data/games.csv. ESPN's public scoreboard for September 14, pulled with default headers and saved raw beside it (explainer_src/_espn_nfl_scoreboard_2026-09-14.json): one game, final, Kansas City 31, Denver 10, the same as the nflverse row. The earlier snapshots from September 11 and 14 for the market's pre-game numbers. The frozen ledger at /data/predictions.json. And explainer_src/nfl_elo.py, imported rather than copied, whose replay reproduces the August board, Sunday night's board and this morning's board to the tenth. The harness is explainer_src/make_den_kc_graded_chart.py. The lines that grade the ladder:
def board_at(margin):                                    # Kansas City's margin; negative = Denver's
    b = dict(sunday_night_ratings)
    s = shift(den_at_kc, margin, sunday_night_ratings)   # nfl_elo's update rule
    b["KC"] += s; b["DEN"] -= s
    return ranks(b)                                      # rating desc, code asc (the build's order)
[board_at(m)["DEN"] for m in (7, 10, 14, 17, 18, 19, 21)]  # 4, 6, 7, 9, 10, 11, 11
board_at(21) == ranks(ledger_ratings)                      # True
The script asserts the snapshot, the score against ESPN and against the earlier snapshots, the ledger's scoreboard and every week-1 and week-2 row, the replay's reproduction of three boards, the worked example and the move's percentile, the week's distribution, budget path, exact Brier distribution and the good-years bound, the market's numbers at every pull with their Briers and the week's market comparison, the week-10 bars, every rung of the ladder and the board table, the full-week rank count, the scoring tie recomputed from the scores, the 0-2 arithmetic against the 0-2 page's printed column, the rendered rankings page and its snapshot file, and this page's own figures: 79 assertions, all green as of September 15, 2026.
Sources: the nflverse public game log (games.csv), with all sixteen 2026 week-1 games graded and its closing lines; ESPN's public NFL scoreboard for September 14, 2026, used only to confirm the score. The Brier score is Glenn Brier's, from Verification of Forecasts Expressed in Terms of Probability (1950); the rating method is Arpad Elo's.
Further reading
- Nine of Thirteen: Sunday, Graded — the page whose Monday ladder is graded here
- Kansas City Is 17th — the case for and against the Chiefs' rating, and this game as its live test
- Playoff Odds After Week 1 — the whole week carried through the season simulation, and how much to trust it
- Fifty Points a Game in Week 1 — the 791-point threshold, and what a loud week 1 is worth
- The 0-2 Hole Is Mostly the Two Games — the week-2 count Denver's loss adds to
- The Miss Budget — the 99.11 that now reads 99.02
- The Model Gets Louder, Not Smarter — the week-1 distribution, published before the season
- Nobody Moved — how much a game, and a week, usually rearranges
- What One Game Moves — the update rule and the 7,276-move scale
- The First Miss — Thursday's result graded the same way
- The Prediction Ledger — ten for sixteen, and week 2 frozen
- Power Rankings — the board after week 1, with its first arrows
Go deeper
Want the code behind these metrics? Work through the 45-chapter NFL analytics tutorial.
Browse tutorials Free tools