One Number, Fitted Honestly
Yesterday's page ended with a complaint and no repair. Run this site's playoff simulation over 24 past seasons and its week-1 moves are about the right size, but its levels are not: teams it put at 90% or better made the playoffs 78.4% of the time, teams under 10% made it 14.5%, and regressing what happened on what was forecast gives a slope of 0.684 where a calibrated forecast gives one. On opening day the slope is 0.596. I wrote that a proper correction would be a different model and left it there.
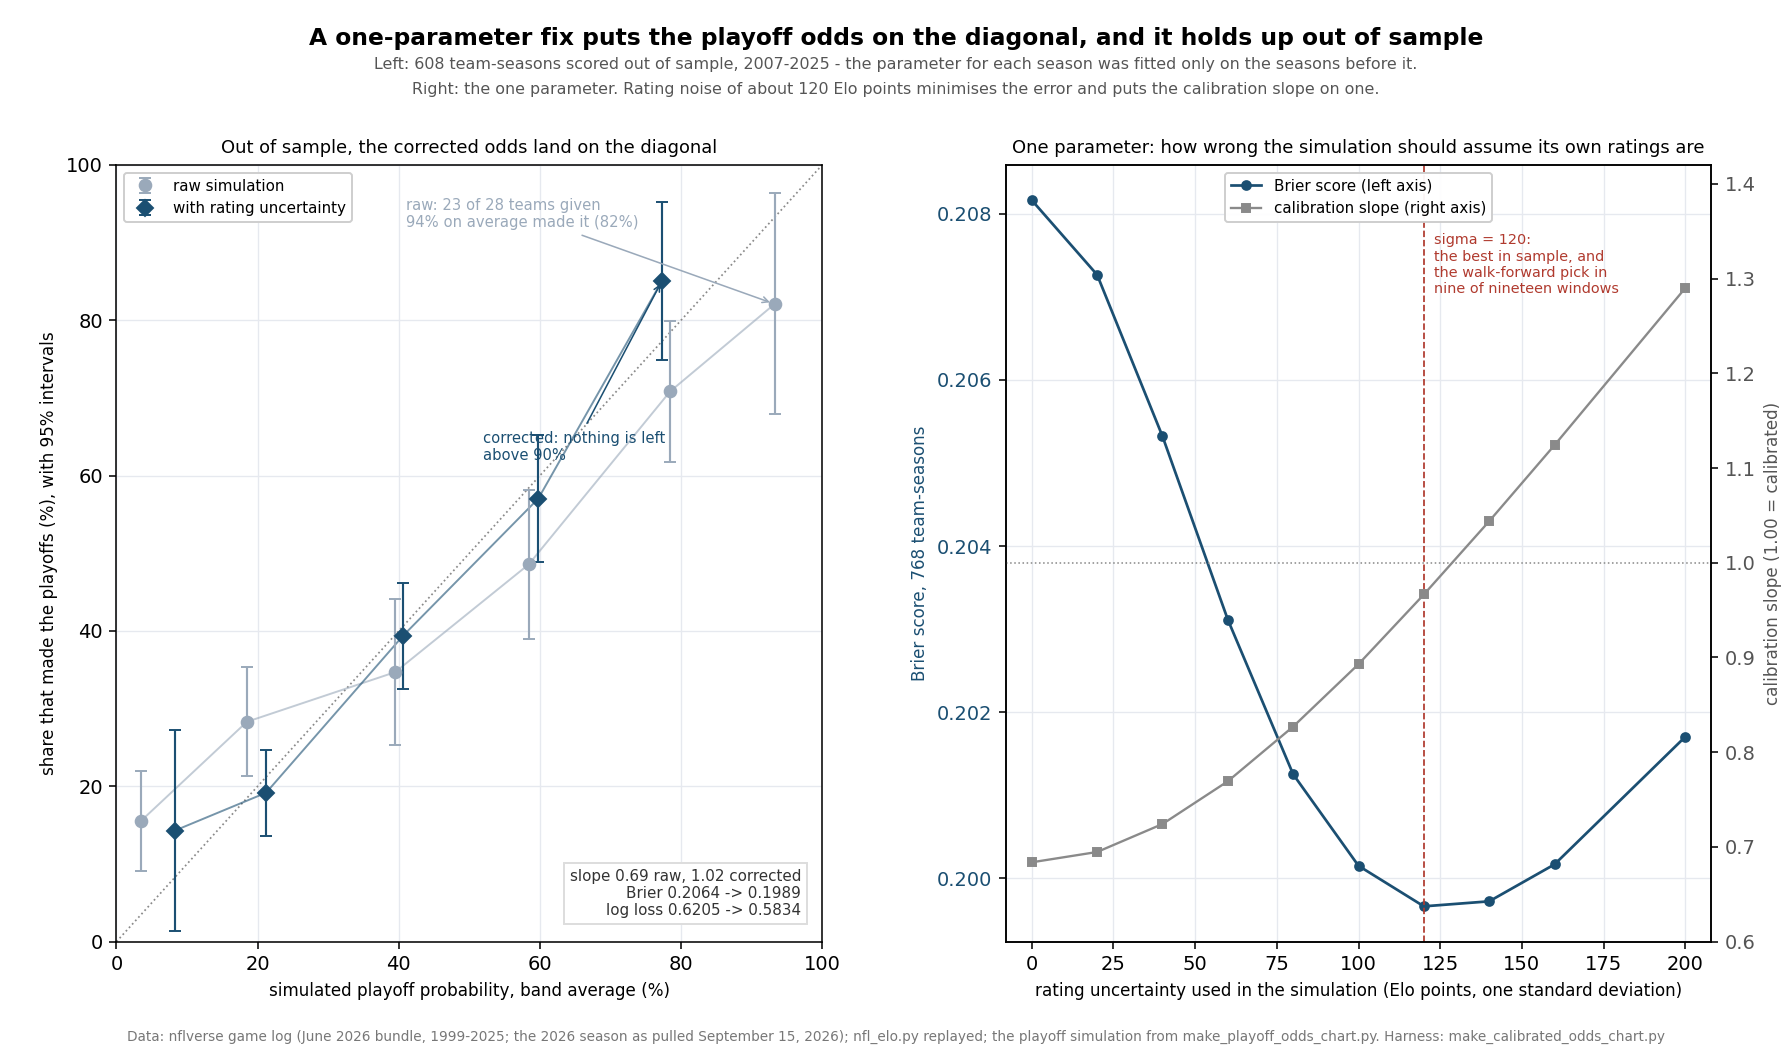
This page builds it. There is one parameter, it is fitted only on seasons before the one being scored, and the answer is that the repair is real: across 608 team-seasons scored out of sample the Brier score falls from .2064 to .1989 and the log loss from .6205 to .5834, a gain of 0.0075 with a season-level standard error of 0.0024, better in 15 of 19 seasons. The calibration slope goes from 0.694 to 1.015. The parameter barely moves as seasons are added.
My position is that this is good enough to adopt, and that the version worth adopting is the one that fixes the simulation rather than its output. It also costs something, which the last third of this page is about. What this page does not do is quietly restate the site's published odds: the August table stands as written, and the corrected 2026 column below is labelled as what it is.
Two Repairs, One Parameter Each
The diagnosis says the simulation is too sure of itself because it treats each rating as exactly right and draws every game at the probability that rating implies. Its only uncertainty is the bounce of the football. So there are two places to intervene, and I tried both.
Shrink the answers. Take each team's simulated probability, move it toward the share of teams that make the field, and leave everything else alone. In log-odds that is one multiplication:
base = 14/32 for a fourteen-team field, 12/32 before 2020
logit(p') = logit(base) + lambda * (logit(p) - logit(base))     # lambda < 1 flattens
Admit the ratings are wrong. Before each simulated season, add an independent normal draw with standard deviation sigma to every team's rating, hold it for that season, and price the 272 games off the perturbed numbers. A team the simulation calls a lock is now sometimes a team whose rating is twenty points too high, which is exactly the objection. This changes the machine, not its output, and it is the fix the diagnosis actually implies.
Both have one knob. The first is free; the second costs a re-simulation for every value tried, which is why it is fitted on a grid.
How Wrong Should It Think It Is?
Across all 768 team-seasons from 2002 to 2025, run after week 1 of each season, the sweep looks like this:
| Rating uncertainty (Elo points) | Brier score | Log loss | Calibration slope |
|---|---|---|---|
| 0 | 0.2082 | 0.6218 | 0.684 |
| 40 | 0.2053 | 0.6080 | 0.724 |
| 80 | 0.2013 | 0.5901 | 0.827 |
| 120 | 0.1997 | 0.5839 | 0.966 |
| 160 | 0.2002 | 0.5851 | 1.124 |
| 200 | 0.2017 | 0.5891 | 1.290 |
The error bottoms out at 120 points and rises again by 200, so the best value is an interior one rather than the edge of the grid I happened to choose. The slope rises all the way, crossing one somewhere between 120 and 160: more noise always flattens the forecast, but past the bottom it is flattening a forecast that was already flat enough. For scale, 120 Elo points is about three points of spread and roughly the distance from the fourth team on this morning's board to the fourteenth. That is the simulation being told to assume it could be that wrong about any team, every season.
The shrinkage version lands in the same place: fitted on the same 768 team-seasons, lambda is 0.560.
The Exhibit
Fitted Forward, Never Backward
A correction fitted on the seasons it is then scored on proves nothing. So for each season from 2007 to 2025 the parameter was chosen using only the seasons before it, with 2002 to 2006 as training data that is never scored. Nineteen test seasons, 608 team-seasons, and the parameter for 2025 has never seen 2025.
| Out of sample, 2007–2025 | Brier | Log loss | Calibration slope | Playoff seats a season |
|---|---|---|---|---|
| The simulation as it ships | .2064 | .6205 | 0.694 | 12.632 |
| Shrunk probabilities | .1987 | .5834 | 1.001 | 12.287 |
| Rating uncertainty | .1989 | .5834 | 1.015 | 12.632 |
The two repairs cannot be told apart on accuracy: shrinkage gains 0.0077 of Brier score, rating uncertainty 0.0075, each with a season-level standard error of 0.0024, and the difference between them is a fifth of its own standard error. Shrinkage helps in 16 of 19 seasons and rating uncertainty in 15 of 19. The gain survives both playoff formats: 0.0083 over the thirteen twelve-team seasons in the window and 0.0063 over the six fourteen-team ones.
The last column is what separates them. The playoff field is twelve teams a conference-pair through 2019 and fourteen after, so the 32 odds have to add up to the real number of seats, and over these nineteen seasons that average is 12.632 teams. The raw simulation hits it by construction, because every simulated season fills the bracket exactly. So does the rating-uncertainty version, for the same reason. Shrinking the probabilities does not: it returns 12.287 teams a season, a third of a playoff seat that has gone missing. A table of team odds that does not add up to the number of seats is not a set of odds; it is a set of opinions that happen to be printed together. That decides it.
The parameter is also steady. Across the nineteen expanding windows lambda never leaves 0.49 to 0.585 and ends at 0.58; leaving each season out of the full sample in turn moves it only between 0.540 and 0.580, with a mean of 0.561. The grid picks 120 Elo points in nine of the nineteen windows, 140 in nine and 160 once, and ends at 120. Nothing here depends on a knife-edge.
What the Bands Look Like Afterwards
The same 608 team-seasons, sorted into bands by what they were given and counted against what happened:
| Simulated odds | As it ships | With rating uncertainty | ||||
|---|---|---|---|---|---|---|
| Teams | Average | Made playoffs | Teams | Average | Made playoffs | |
| Under 10% | 122 | 4.3% | 19 (15.6%) | 28 | 7.4% | 4 (14.3%) |
| 10 to 30% | 159 | 19.3% | 45 (28.3%) | 193 | 20.4% | 37 (19.2%) |
| 30 to 50% | 98 | 40.3% | 34 (34.7%) | 198 | 39.8% | 78 (39.4%) |
| 50 to 70% | 105 | 59.2% | 51 (48.6%) | 142 | 59.0% | 81 (57.0%) |
| 70 to 90% | 96 | 79.2% | 68 (70.8%) | 47 | 76.5% | 40 (85.1%) |
| 90% or more | 28 | 94.1% | 23 (82.1%) | 0 | 0.0% | 0 (0.0%) |
Read the left half first. Out of sample the shipped simulation gave 28 team-seasons 90% or better and 23 of 28 made it; it gave 122 less than 10% and 19 of 122 made it. Every band above the middle falls short of its own claim and both bands below it run over.
The right half is the repair, and the honest reading of it has three parts. From 10% to 70% the corrected forecast lands within three points of what it claimed, which is as close as 600 team-seasons can measure. The top band disappears entirely: after the correction nothing is ever given 90% again, which is a real consequence and not a rounding one. And the surviving 70-to-90 band overshoots in the other direction, 47 team-seasons given 76.5% of whom 85.1% got in. Fixing a forecast that was too sure has left it, in that one band, slightly not sure enough.
The same thing shows in the week-1 split. Winners of their opener were given .563 by the raw simulation and .517 after the correction, against .537 realised; losers were given .220 raw and .266 corrected, against .253. The raw numbers are too far apart and the corrected ones are a little too close together, and the truth is between them nearer the correction.
Worked Through: Seattle
Seattle is 1–0, first on the board, and the simulation gives it 95.7% after week 1. Both repairs move it to the same place from opposite directions. The shrinkage arithmetic, with the field share as the anchor:
logit(0.957)      = ln(0.957 / 0.043)          =  3.1026
logit(14/32)      = ln(0.4375 / 0.5625)        = -0.2513
shrunk log-odds   = -0.2513 + 0.560 * (3.1026 - (-0.2513))
                  = -0.2513 + 0.560 * 3.3539   =  1.6269
shrunk probability = 1 / (1 + e^-1.6269)        =  0.8357   ->  83.6%
The rating-uncertainty run never touches 95.7. It re-draws Seattle's rating 20,000 times around 1683.0 with a standard deviation of 120, re-prices Seattle's sixteen remaining games in each one, and counts: 83.6%. Two different repairs, agreeing to a tenth of a point on the team they were most likely to disagree about. That is not a coincidence, since both are monotone flattenings fitted to the same data, but it is a useful check that neither is doing something strange at the end of the curve.
The 2026 Board, Both Ways
Every team, with the August table, the same simulation re-run after week 1, and the corrected column. The correction moves the 32 numbers by a combined 283.2 points and reorders nothing.
| Team | August | After week 1 | Corrected | Change |
|---|---|---|---|---|
| Seattle | 93.8 | 95.7 | 83.6 | −12.1 |
| Buffalo | 80.7 | 92.1 | 78.8 | −13.3 |
| Baltimore | 70.8 | 86.4 | 73.3 | −13.1 |
| Philadelphia | 81.3 | 85.6 | 71.9 | −13.7 |
| Jacksonville | 68.0 | 79.3 | 68.5 | −10.8 |
| San Francisco | 56.2 | 78.5 | 66.2 | −12.3 |
| Minnesota | 61.8 | 75.7 | 64.6 | −11.1 |
| Houston | 85.2 | 74.6 | 64.1 | −10.5 |
| Detroit | 70.0 | 73.6 | 62.6 | −11.0 |
| Kansas City | 38.0 | 67.2 | 60.0 | −7.2 |
| Denver | 83.9 | 62.2 | 55.7 | −6.5 |
| Pittsburgh | 47.7 | 61.7 | 56.5 | −5.2 |
| New England | 72.1 | 60.5 | 55.3 | −5.2 |
| Cincinnati | 39.5 | 55.6 | 52.5 | −3.1 |
| Chicago | 38.0 | 55.1 | 51.9 | −3.2 |
| LA Rams | 77.0 | 48.3 | 46.4 | −1.9 |
| Tampa Bay | 45.1 | 40.7 | 39.4 | −1.3 |
| Atlanta | 36.2 | 30.1 | 33.4 | +3.3 |
| New Orleans | 28.2 | 28.9 | 32.1 | +3.2 |
| Green Bay | 44.7 | 26.5 | 33.4 | +6.9 |
| NY Giants | 11.0 | 20.7 | 31.2 | +10.5 |
| LA Chargers | 43.5 | 17.1 | 28.0 | +10.9 |
| Indianapolis | 28.2 | 13.5 | 25.0 | +11.5 |
| Washington | 20.1 | 13.1 | 23.8 | +10.7 |
| Arizona | 3.4 | 10.7 | 22.9 | +12.2 |
| Cleveland | 18.7 | 10.6 | 21.8 | +11.2 |
| Carolina | 13.3 | 8.7 | 17.6 | +8.9 |
| Dallas | 19.8 | 8.1 | 19.0 | +10.9 |
| NY Jets | 2.6 | 7.4 | 19.8 | +12.4 |
| Las Vegas | 2.0 | 6.7 | 18.6 | +11.9 |
| Miami | 16.6 | 4.5 | 15.6 | +11.1 |
| Tennessee | 2.8 | 0.7 | 6.7 | +6.0 |
The shape of the change is the whole argument in one column. The eight teams the simulation had written off gain nine to twelve points each; the seven it had made near-certainties give up ten to fourteen. The Jets go from 7.4 to 19.8 and Philadelphia from 85.6 to 71.9, the two largest moves. Nobody crosses fifty per cent, because a monotone flattening cannot reorder a board, and no division changes favourite. Tennessee, last of the 32, goes from 0.7 to 6.7: the corrected simulation will not tell you a team is finished in September, and the history says it should not.
The corrected column still adds to fourteen teams a conference. The shrunk version of the same board adds to 13.7, which is the defect the history section already priced.
What It Costs
Yesterday's page found one thing the simulation was already doing right: its week-1 moves were the right size, a slope of 0.929 with a season-clustered standard error of 0.134. Run the same test on the corrected forecasts and that slope goes the wrong way. With rating uncertainty it is 1.266 (standard error 0.190); with shrunk probabilities 1.345 (0.205). A slope above one means the moves are now too small: the corrected board reacts to week 1 by less than week 1 turns out to be worth.
That is arithmetic, not a bug. Flattening the levels flattens the differences between them, and the difference between two odds is what a move is. It is also not established: none of the three slopes, 0.929, 1.266 or 1.345, is two standard errors from one, and 768 team-seasons cannot separate them. But the direction is real and I would rather print it than not. The honest summary is that one knob cannot fix the levels and keep the moves exactly where they were, and on this evidence the levels are the more broken of the two, being several standard errors from calibrated while the moves are within one.
The correction is not only for week 1, either. Applied to the opening-day board, the same 120 points of rating uncertainty take the Brier score from .2247 to .2141 and the slope from 0.596 to 0.888 — a bigger repair, and still short of calibrated, which fits the story that a preseason rating is the one the simulation should trust least.
What This Page Does Not Show
The site's published odds are unchanged. The August page remains the site's playoff-odds table and today's corrected column is an argument about it, not a replacement for it. Adopting the correction means changing the simulation in make_playoff_odds_chart.py so every future table carries it, which is a build change and a separate decision. On this evidence I would make it, with the raw column kept beside the corrected one.
One parameter, chosen on a grid. Sigma was fitted over ten values from 0 to 200. A finer grid would land between 120 and 140 and would not change anything here. The shrinkage lambda was fitted on a 0.005 grid, which is fine enough not to matter.
Nineteen test seasons is nineteen observations. The standard errors are computed across seasons, because team-seasons inside a season are tied together by the fixed number of seats. A gain of 0.0075 at a standard error of 0.0024 is about three standard errors, which is good but not a law of nature, and six of those seasons have a different playoff format from the other thirteen.
The noise is the simplest possible kind. Independent, normal, the same width for every team, drawn once a season and held. Real rating error is not independent across a division, is fatter in the tails, and grows during a season for teams whose quarterback changes. A better error model would presumably do better; this one is chosen because it has a single parameter that can be fitted honestly.
Ties are still broken at random. The simulation does not apply head-to-head or division records, which the August page flagged. The correction does not touch that, and it matters most for teams near the cut line, which is the part of the table the correction moves least.
Two comparisons, not a search. This page reports two candidate repairs and one grid each. It is not a sweep over dozens of transforms with the best one reported, which is the usual way a result like this turns out to be nothing. The reliability bands are descriptive; the claims that carry weight are the out-of-sample Brier, the log loss, the slope and the seat count.
Replayed history, not published forecasts. Nobody published these odds in 2007. The test is of the method against what the engine would have said, which is the only version of the question the data can answer.
Method and Sources
Three files and one module. The June 2026 nflverse bundle for 1999–2025 (/data/games.csv, served at /data/games.csv), with each season's playoff teams read from its own postseason rows. The 2026 season as pulled on the morning of September 15, with the ledger's frozen August ratings and its ratings after week 1 (explainer_src/_2026_week1_snapshot_2026-09-15.json), because the build republishes the June bundle over the served copy. The frozen ledger at /data/predictions.json, which still reads ten of sixteen with week 2 ungraded. And explainer_src/nfl_elo.py, imported rather than copied. The simulation is the one in make_playoff_odds_chart.py, with the field size as a parameter and a tie as half a win, exactly as yesterday's page generalised it. The harness is explainer_src/make_calibrated_odds_chart.py. The whole repair is these lines:
# rating uncertainty: one draw per team per simulated season, then price the games
e   = rng.normal(0.0, sigma, size=(20000, 32))            # sigma fitted walk-forward
gap = (rating[home] + e[:, home]) - (rating[away] + e[:, away]) + home_field
p   = 1 / (1 + 10 ** (-gap / 400))                        # now one probability per season

for season in 2007..2025:                                  # never fitted on itself
    sigma = argmin over the grid of Brier on seasons < season
    odds[season] = simulate(perturbed_probabilities, sigma)
# 608 team-seasons: Brier .2064 -> .1989, slope 0.694 -> 1.015, seats 12.632 -> 12.632
The script asserts the engine constants and the replay's reproduction of both 2026 boards, the ledger's scoreboard and the fact that week 2 is ungraded, every figure yesterday's page published, the full sigma sweep and its interior minimum, the monotonicity of the slope in sigma, both fitted parameters, the walk-forward paths and the leave-one-season-out range, every out-of-sample metric with its season-level standard error, the era split, the seat counts in all three states, all six reliability bands in both states, the week-1 winner and loser averages, the move-sizing slopes, the opening-day results, all 32 rows of the 2026 table, the worked example to four places, and this page's own figures: 67 assertions, all green as of September 16, 2026.
Sources: the nflverse public game log (games.csv). The Brier score is Glenn Brier's, from Verification of Forecasts Expressed in Terms of Probability (1950); the reliability-diagram framing follows Allan Murphy and Robert Winkler, Journal of the Royal Statistical Society (1977); fitting a one-parameter squash to an overconfident probability is John Platt's (1999), here anchored at the base rate rather than free. The rating method is Arpad Elo's.
Further reading
- Playoff Odds After Week 1 — the page that measured the problem and declined to fix it
- Elo-Implied 2026 Playoff Odds — the August table, which stands as written
- Two Division Races, One Thursday — the same simulation used on a single game, with this correction's caveat attached
- The Model Has No Good Years, Only Lucky Ones — the same calibration question asked of the weekly picks
- The Model Gets Louder, Not Smarter — where the game-level probabilities are and are not calibrated
- The Offseason Haircut — the one-third regression that is the engine's own admission that its ratings are wrong
- One Night, 25 Points of Playoff Odds — the move-sizing result this correction disturbs
- 2026 Win Totals — the expected wins the simulation turns into odds
- Our Prediction Model, Fully Stated — the engine the replay imports
- Power Rankings — the ratings the simulation now assumes it has wrong by about 120 points
- The Prediction Ledger — ten of sixteen, with week 2 frozen
Go deeper
Want the code behind these metrics? Work through the 45-chapter NFL analytics tutorial.
Browse tutorials Free tools