The Game Nobody Disagrees About
Week 2 opens on Thursday night at Highmark Stadium, Detroit at Buffalo, both 1–0, and the two parties this site keeps score between have almost nothing to argue about. The ledger froze Buffalo at .6612 on Tuesday morning. This morning's moneylines, with the hold stripped, make Buffalo .6636. A quarter of a point apart, the third-closest of the sixteen week-2 games.
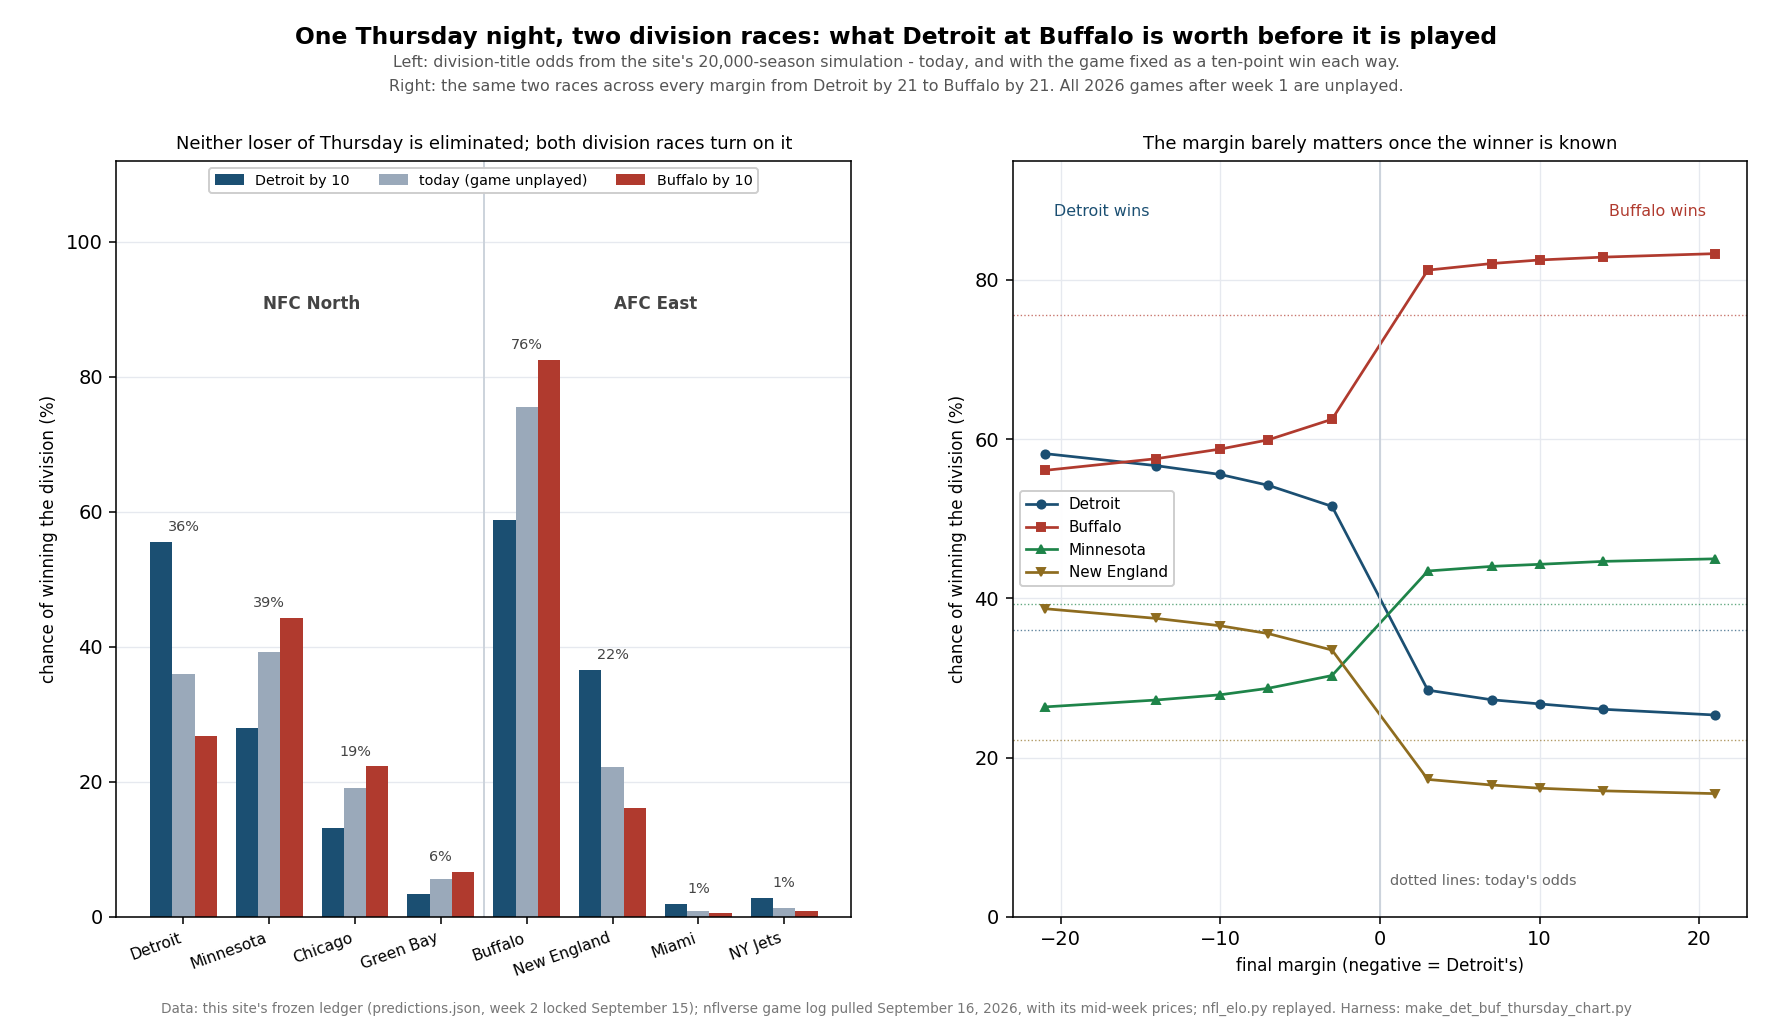
That agreement is the least interesting thing about the game, because what Thursday actually decides is not what either team is worth. It is two division races, and one of the teams with most riding on it is not playing. Run the result through the site's 20,000-season simulation and a ten-point Detroit win makes the Lions 55.6% to win the NFC North against 26.8% if Buffalo wins by ten — and it moves New England's hold on the AFC East by 20.4 points, from 16.2% to 36.6%, without the Patriots leaving the building.
Every 2026 game after week 1 is unplayed. Everything below is priced before kickoff, from the frozen ledger and from prices pulled this morning, and none of it is a prediction of the score.
The Price, and the Two Days the Market Had
The model's number is arithmetic on two ratings that have not moved since Monday night, because neither team has played since:
gap      = 1635.5 (Buffalo) + 48 (home) - 1567.3 (Detroit)   = 116.2
p(BUF)   = 1 / (1 + 10 ** (-116.2 / 400))                     = .6612   -> the pick is Buffalo
Buffalo is second on the board and Detroit twelfth. The market got to the same place by a different route, and it took two days to do it:
| Source | Line | Moneylines (DET / BUF) | Buffalo, vig-free |
|---|---|---|---|
| Monday morning | BUF by 3.5 | +160 / −192 | .6309 |
| Wednesday morning | BUF by 5.5 | +185 / −225 | .6636 |
| The model, frozen Tuesday | — | — | .6612 |
Two points of spread in forty-eight hours, and 3.3 points of probability, all of it toward Buffalo. The market started below the model and has finished above it. The hold on this morning's two-way price is 4.32%, and ESPN's public scoreboard, pulled the same morning, lists the same number: Buffalo by 5.5, total 54.5, game not started.
Across the whole week-2 board the model and the market are usually further apart than this. Las Vegas at the Chargers is closer, the Giants at the Rams is closer, and then this game; the widest is Carolina at Atlanta, where they are 19.6 points apart on who wins. A tight game with a tight disagreement is the least useful kind for telling two forecasters apart, which is the same point Monday's grading page made about a game they disagreed on by twelve.
The total, 54.5, is the highest on the week-2 board and the one number here with a published forecast against it. Monday's scoring page fitted this game's total at 49.21 from the two teams' week-1 scoring and the league's, against a market number of 53.5 that morning. It has since gone up another point. That fit misses week-2 totals by 2.80 points in its own sample and knows nothing about who is playing, so the gap is a reminder of what a regression on scores cannot see rather than a case against the number.
The Exhibit
Two Division Races, Priced Both Ways
Every team in the two divisions, with its chance of winning the division today, after a ten-point Detroit win, and after a ten-point Buffalo win. Ten points is used because it is close to the average margin of an NFL game; the next section shows how little the number matters.
| Team | Division | Today | Detroit by 10 | Buffalo by 10 | Swing |
|---|---|---|---|---|---|
| Detroit | NFC North | 36.0 | 55.6 | 26.8 | +28.8 |
| Minnesota | NFC North | 39.3 | 27.9 | 44.3 | -16.4 |
| Chicago | NFC North | 19.1 | 13.1 | 22.3 | -9.2 |
| Green Bay | NFC North | 5.6 | 3.4 | 6.7 | -3.3 |
| Buffalo | AFC East | 75.6 | 58.8 | 82.5 | -23.7 |
| New England | AFC East | 22.2 | 36.6 | 16.2 | +20.4 |
| Miami | AFC East | 0.9 | 1.9 | 0.5 | +1.4 |
| NY Jets | AFC East | 1.3 | 2.8 | 0.8 | +2.0 |
Three things are worth stopping on. The first is that Detroit is not the NFC North favourite this morning: Minnesota is, by 3.3 points, on the back of a seventeen-point win in Green Bay. Thursday is the game that settles which of them the simulation prefers, and it settles it without Minnesota playing.
The second is New England. The Patriots are 0–1, sixth on the board, and hosting Pittsburgh on Sunday, and Thursday night is worth 20.4 points of their division title — more than it is worth to any team other than the two playing. Of the thirty teams not involved, New England moves most and Minnesota second at 16.4 points. That is what a division race is: the leader's every result is your result, inverted.
The third is the asymmetry between the two divisions. A Detroit win moves 76.4 points of division title across the league; a Buffalo win moves 34.1. Buffalo winning is the expected thing, already priced into the 75.6, and it mostly confirms a board that already exists. Detroit winning rearranges two divisions at once.
Playoff odds move less than division odds, because a team that loses its division can still be one of the three wild cards each conference hands out. Detroit's chance of playing in January runs from 89.2% down to 63.3%, and Buffalo's from 95.9% down to 79.8%. Buffalo's expected wins on the current board are 11.60 across the seventeen games, which is why both its numbers start so high and why a loss on Thursday dents rather than damages them. Neither loser is in trouble; both losers are simply behind. The AFC's top seed is the exception, and it is the most violent number on the page: Buffalo's chance of it is 28.9% today, 38.7% after a ten-point win and 12.8% after a ten-point loss. Seeding is decided by a margin thinner than a division.
The Margin Hardly Matters
Every rung, from a three-point game to a three-touchdown one, with the rating move the engine's update rule produces and what the board looks like afterwards:
| Result | Rating move | DET playoffs | DET division | BUF playoffs | BUF division |
|---|---|---|---|---|---|
| Detroit by 21 | -38.83 | 90.7 | 58.2 | 77.2 | 56.1 |
| Detroit by 14 | -34.02 | 89.9 | 56.7 | 78.6 | 57.6 |
| Detroit by 10 | -30.12 | 89.2 | 55.6 | 79.8 | 58.8 |
| Detroit by 7 | -26.12 | 88.4 | 54.2 | 80.7 | 59.9 |
| Detroit by 3 | -17.41 | 86.7 | 51.6 | 83.0 | 62.5 |
| Buffalo by 3 | +8.92 | 65.6 | 28.5 | 95.4 | 81.2 |
| Buffalo by 7 | +13.38 | 64.1 | 27.3 | 95.8 | 82.1 |
| Buffalo by 10 | +15.43 | 63.3 | 26.8 | 95.9 | 82.5 |
| Buffalo by 14 | +17.43 | 62.5 | 26.1 | 96.1 | 82.9 |
| Buffalo by 21 | +19.89 | 61.5 | 25.4 | 96.3 | 83.3 |
Detroit's division chance runs from 51.6% at a field goal to 58.2% at 21 points — seven points of spread across the whole range of plausible Detroit wins, against the 28.8-point cliff between winning by three and losing by three. The step is at zero. Everything else is detail.
The rating column is lopsided in a way worth naming. A three-point Buffalo win is worth 8.92 rating points; a three-point Detroit win is worth 17.41, almost exactly twice as much, and at 21 points it is 19.89 against 38.83. The update rule pays the winner (outcome − probability), so the favourite collects the .3388 it was not already given and the underdog collects .6612. A favourite winning barely teaches the model anything, which is the mechanism the update-rule page works through in general.
A Check the Board Has to Pass
If the simulation is coherent, today's odds must already be the average of Thursday's two branches, weighted by the model's own probability. Strip out the rating move and fix only the result, and it is:
Buffalo's playoff odds, the result alone, no re-rating
  Buffalo wins   94.5      Buffalo loses   86.9
  .6612 x 94.5 + .3388 x 86.9 = 62.48 + 29.44          = 91.9
  today's board                                        = 92.1   (0.2 apart, on 20,000 seasons)

Detroit, the same way
  Detroit wins   82.8      Detroit loses   68.9
  .3388 x 82.8 + .6612 x 68.9                          = 73.6   = today's board
Across all 32 teams the largest gap between the weighted average of the branches and the board as it stands is a tenth of a point, which is simulation noise. So the honest description of today's 92.1 is not a forecast waiting for news; it is already Thursday's two answers, blended at the price.
That split also separates what the result does from what the re-rating does. A Buffalo win taken alone is worth 2.4 points of Buffalo's playoff odds; the rating move a ten-point win adds brings it to 95.9, another 1.4. For Detroit the re-rating is far bigger, 6.4 points on top of the result, because the model would be learning something. The same asymmetry, one layer up.
The Series, and the Short Week
These teams meet about once every four years, and the games have a signature. There have been seven meetings in the file, 2002 through 2024, and Buffalo has won six; Detroit's only win was 2006. The margins were 7, 3, 2, 3, 1, 3 and 6 points: not one of the seven was decided by more than a touchdown, and the average margin is 3.57. The most recent, in 2024, was Buffalo 48, Detroit 42, the highest-scoring of the seven. The market has this one at 5.5, which would be the fourth-largest number the series has carried; the biggest was ten.
Seven games across a quarter-century say nothing about Thursday — different rosters, different coaches, mostly different stadiums — and I would not use the series to price anything. It is a nice fact and it is not evidence.
The short week is shared. Both teams played on Sunday and both come in on four days of rest, so the scheduling complaint that follows every Thursday game applies equally to both sidelines and cancels. In the 290 regular-season games since 1999 where both sides came off four days, the home team won .5621, against .5605 across all 6,967 games in the file — the same number, which is what the rest page found generally: rest matters when the gap is big, and here there is no gap. Thursday scoring is not lower either.
The week-2 Thursday slot itself is young. The file holds fourteen of these games, all from 2012 on, and six put two 1–0 teams against each other: 2013, 2015, 2018, 2022, 2024 and 2025. The home team won four of the six. Six games is a number I am reporting, not a base rate.
What This Page Does Not Show
The odds are too confident at the ends, by this site's own measurement. Today's other page fits a correction to exactly that: the 95.9% Buffalo would hold after a ten-point win is nearer 84% on a calibrated version, and the 63.3% Detroit would be left with is nearer 58%. The swings on this page are differences between two runs of the same simulation and survive the correction better than the levels do, but read every number above as further from the middle than it should be.
The model has no idea who is playing. The ratings are built from scores. No injuries, no quarterback news between Sunday and Thursday, nothing about a short week for one roster rather than another. The market's number knows all of it, which is the most likely explanation for two points of spread moving in two days.
Mid-week prices, not closes. The moneylines and the total are a Wednesday-morning snapshot from the game file and ESPN, and the two sources may share an upstream. They will move before kickoff, and the closing number is the one any market comparison should eventually use.
The branches are not forecasts. Each row of the ladder is the simulation run with one result imposed as a certainty. Nobody knows which row happens, and the page deliberately does not guess beyond the .6612 the ledger already published.
Ties are broken at random in the simulation. No head-to-head, no division records. For two teams in different conferences this matters less than usual, but the NFC North numbers in particular are decided by tiebreakers more often than the AFC East ones, where Buffalo is usually clear.
One game, many cuts. Two divisions, ten margins, eight teams and a series of seven. Most of these numbers are arithmetic on one simulation rather than statistical tests, but the historical ones — the series, the fourteen Thursdays, the six meetings of 1–0 teams — are small samples and are labelled where they appear.
Method and Sources
Four files and one module. All 272 2026 rows as pulled on the morning of September 16 with their mid-week prices, saved beside ESPN's public week-2 scoreboard from the same pull (explainer_src/_2026_week2_lines_2026-09-16.json), because the build republishes the June bundle over the served copy at /data/games.csv. Monday's pull for the earlier prices (explainer_src/_2026_week2_lines_2026-09-14.json). The frozen ledger at /data/predictions.json, which reads ten of sixteen with all sixteen week-2 rows locked on September 15 and ungraded. The June 2026 nflverse bundle for the series and the Thursday history. And explainer_src/nfl_elo.py, imported rather than copied, for the probability and the update rule. The simulation is the one from make_playoff_odds_chart.py. The harness is explainer_src/make_det_buf_thursday_chart.py. The branch arithmetic:
def board_at(margin):                          # Buffalo's margin; negative = Detroit's
    shift = K * mov_multiplier(margin, edge) * (outcome - .6612)
    R = dict(ledger_ratings); R["BUF"] += shift; R["DET"] -= shift
    return simulate(R, week_1_fixed + {this game fixed})    # 20,000 seasons, seed 2026

board_at(+10)["DET"]["division"]  = 26.8        board_at(-10)["DET"]["division"] = 55.6
.6612 * board_win + .3388 * board_loss == today's board    # to a tenth of a point
The script asserts the engine constants, the pull's shape and the absence of any score after week 1, the ledger's scoreboard and the frozen week-2 rows, this game's row down to the rest fields and the stadium, the probability recomputed from the ratings, both market snapshots with their hold, ESPN's agreement, the model-market gaps across all sixteen games, both teams' week-1 results and what they did against their numbers, today's board against yesterday's published one, every rung of the ladder and every rating move, the two division tables, the largest movers who are not playing, the 1-seed numbers, the coherence check across all 32 teams, the result-and-re-rating split, the series game by game, the fourteen Thursdays, the rest comparison, and this page's own figures: 66 assertions, all green as of September 16, 2026.
Sources: the nflverse public game log (games.csv), including its mid-week spreads, totals and moneylines; ESPN's public NFL scoreboard for week 2 of 2026, used only to confirm the number and that the game has not started. The rating method is Arpad Elo's, from The Rating of Chessplayers, Past and Present (1978).
Further reading
- Shrinking the Playoff Odds — how much of the certainty in these numbers survives a calibration test
- Playoff Odds After Week 1 — the board this page starts from, and how week 1 built it
- The 0-2 Hole Is Mostly the Two Games — the other side of week 2, for the teams that lost their openers
- Does Week 1 Mean Anything? — what being 1-0 has been worth, before any of this
- What One Game Moves — the update rule behind the lopsided rating column
- The Six Games That Count Double — why division odds move more than playoff odds
- Fifty Points a Game in Week 1 — the fitted total this game has run past
- Does Rest Matter? — the short week, when both sides are on it
- The 2026 NFC North and the 2026 AFC East — the two races, as they looked in August
- Nine of Thirteen: Sunday, Graded — how the model's week-1 picks actually went
- Minnesota and New England — the two teams watching this one hardest
- The Prediction Ledger — the frozen week-2 board, including this game
- Power Rankings — Buffalo second, Detroit twelfth
Go deeper
Want the code behind these metrics? Work through the 45-chapter NFL analytics tutorial.
Browse tutorials Free tools