The One Matchup This Site Prices Twice
Almost every pair of NFL teams meets once a season or not at all. A few meet twice, and in this site's game file the few are always the same few: 1,347 pairs from 1999 through 2025, every one of them a division home-and-home, one game at each ground. That makes them the only population where the same two teams are priced twice in the same year, which allows a question no single game can answer. Not “is each price right?” — but “are the two results independent?”
They are not, by a little. Of the 1,340 pairs in which both meetings were decided, 768 were swept by the same team — .5731. Multiplying this site's own two per-game probabilities together, as though the results were independent draws, says .5497. On the 883 pairs that carry a closing moneyline for both games, the market's two prices multiply to .5433 against an observed .5855.
My position is that this is a real property of the joint outcome and not a flaw in either price. The single-game number is fine: meeting-2 results do not lean against the closing spread with meeting-1's margin at all. What is wrong is the independence assumption — and this site makes that assumption 272 times a season, in the simulation that produces its playoff odds.
What Counts as a Rematch
The harness groups every regular-season game from 1999 to 2025 by season and by the unordered pair of teams, mapping the three relocations so a franchise stays itself. The result is clean: 4,273 pairs met once, 1,347 met twice, and none met three times. All 1,347 are division games, and in all 1,347 the venue flips between the two meetings. So “rematch” here means exactly one thing — the second leg of a division home-and-home — and the team that won the first is, by construction, playing the second at the other ground.
Seven pairs contained a tied game and are set aside, leaving 1,340 with a winner in each leg. Meetings are ordered by week, so meeting 1 and meeting 2 are never ambiguous. Across the 2,680 individual games the home team won .5485, which is the 54.8% the division-games page measured for division hosts generally — a useful sign that this population is not odd in some other way.
The Exhibit
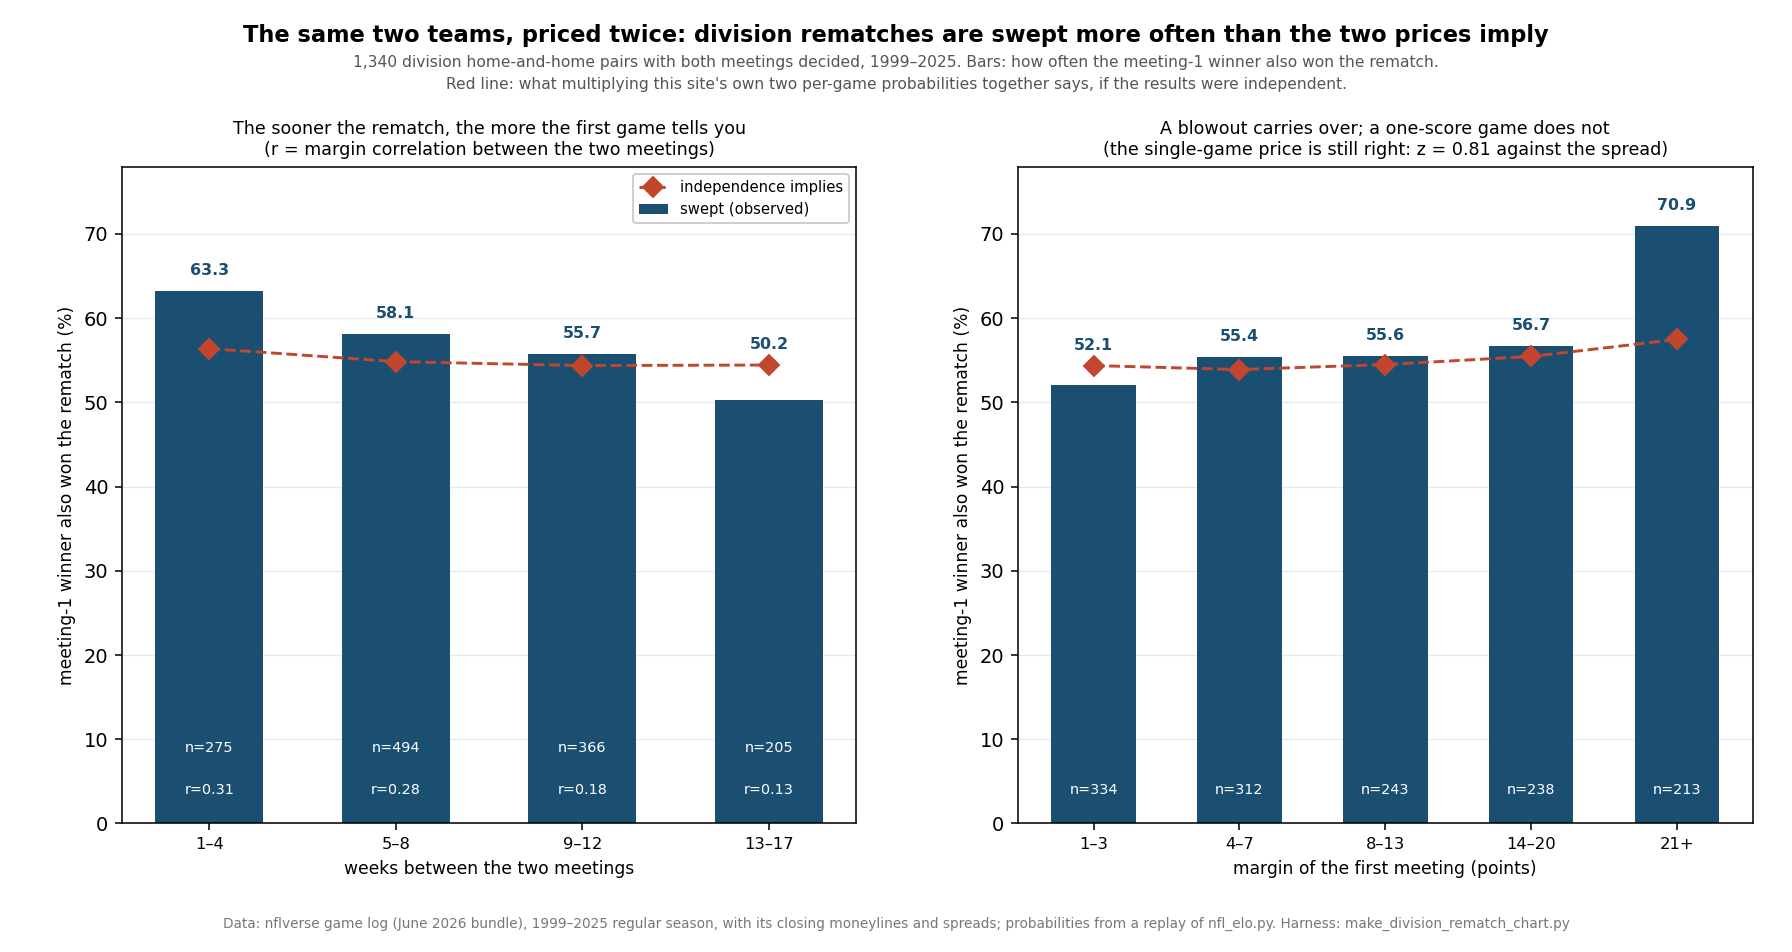
The Excess Is Not Spread Evenly
Across all 1,340 pairs the two final margins correlate at .2344, which is the effect in a single number: related, and loosely. But a pooled 2.3 points of excess sweep rate would be a dull finding if it sat uniformly across the population, and it does not. Sorted by how many weeks separate the two meetings:
| Weeks between meetings | Pairs | Swept | Independence implies | Excess | Margin correlation |
|---|---|---|---|---|---|
| 1–4 weeks | 275 | 0.6327 | 0.5639 | +0.0688 | 0.310 |
| 5–8 weeks | 494 | 0.5810 | 0.5484 | +0.0325 | 0.280 |
| 9–12 weeks | 366 | 0.5574 | 0.5438 | +0.0136 | 0.178 |
| 13–17 weeks | 205 | 0.5024 | 0.5444 | -0.0419 | 0.133 |
The excess runs from nearly seven points when the rematch comes inside a month to minus four points when it comes in December, and the correlation between the two margins falls from .3099 to .1334 over the same span. The independence baseline barely moves across the four windows, so the decay is in the outcomes rather than in the prices. A quick rematch is a genuine repeat; a rematch four months later is not one, and might be slightly less than one.
The same story sorted by how emphatic the first meeting was:
| Margin of the first meeting | Pairs | Swept | Independence implies | Excess |
|---|---|---|---|---|
| 1 to 3 points | 334 | 0.5210 | 0.5438 | -0.0228 |
| 4 to 7 points | 312 | 0.5545 | 0.5390 | +0.0155 |
| 8 to 13 points | 243 | 0.5556 | 0.5450 | +0.0106 |
| 14 to 20 points | 238 | 0.5672 | 0.5546 | +0.0127 |
| 21 or more | 213 | 0.7089 | 0.5747 | +0.1342 |
Nearly the whole effect lives in the bottom row. A team that won the first meeting by three touchdowns took the rematch .7089 of the time against an implied .5747, an excess of 13.4 points on 213 pairs. A team that won by a field goal or less took it .5210 of the time, below what independence implies. The middle three bins sit between +1.1 and +1.6 points and are indistinguishable from nothing. Whatever persists between two meetings of the same pair, a one-score game does not contain it. For scale at the other end, 135 pairs — 10.1% of the 1,340 — were swept with both legs decided by fourteen points or more.
One other cut is worth reporting and then discounting. When the host won meeting 1, the sweep rate is .5159; when the visitor won it, .6407. That looks dramatic and is mostly mechanical: because the venue flips, a team that won on the road in meeting 1 hosts meeting 2, so the 12.5-point gap is largely home-field advantage arriving in the second leg rather than anything about momentum. I would not read it as a separate finding.
How Sure Can Anyone Be
Two tests, and they do not agree about how strong this is. Averaged season by season, the engine's excess is +0.0239 with a season-clustered standard error of 0.0110, which is 2.18 from zero. On the market subset it is +0.0535 with a standard error of 0.0181, or 2.96. Those are the headline numbers and they look respectable.
The sign test is less impressed. The engine's excess was positive in 16 of 27 seasons, which a fair coin produces 22% of the time; the market's in 14 of 20, at 5.8%. Season-level excesses swing from −0.09 to +0.12. So the pooled estimate is carried by the size of the good seasons rather than by their number, and anyone reading this as a metronome would be reading it wrong. The two eras agree at least: +0.0279 from 1999 to 2011 and +0.0188 from 2012 to 2025, on 675 and 665 pairs.
The market subset deserves one caveat of its own. Closing moneylines are missing before 2006 and patchy until 2010, so those 883 pairs are a later, smaller sample than the engine's 1,340, and its larger excess may be partly that. What survives both readings is the direction and rough size: somewhere around two to four points of sweep rate more than independence implies, concentrated in quick rematches and blowouts.
The Single Game Is Priced Correctly
This is the part that keeps the finding honest, and it is a null. If the first meeting carried information the market failed to use, then meeting-2 results would lean against the closing spread with meeting-1's margin. Regress one on the other across all 1,347 pairs and the pooled slope is +0.0335 points of cover per point of first-meeting margin. Season by season it is +0.0186 with a standard error of 0.0229 — 0.81 from zero.
Banded, it is the same nothing: teams that lost the first meeting by fourteen or more finished 0.80 points under the number in the rematch, teams that won by fourteen or more 1.24 points over, and neither clears two of its own standard errors, nor do the two middle bands. A twenty-point first meeting is worth about a third of a point of the second against the number, which is not a bet.
So both things are true at once, and they are not in tension. Each game's price is right on its own. The two outcomes are still positively correlated, because both are driven by the same unobserved facts — how good these teams actually are, how the matchup suits them, who is healthy — and correlated outcomes are exactly what persistent hidden differences produce even when every marginal probability is perfectly calibrated. That is a statistical commonplace rather than a market failure. The week-2 page ran the general version of the single-game test after every week of the season and found the same null.
Worked Through: Green Bay and Minnesota, 2024
The cleanest illustration in the file is a pair the market could not separate. In 2024 Green Bay and Minnesota met in week 4 and again in week 17, and both closing prices were almost exactly even money:
market, vig-free, from Green Bay's side
  meeting 1 (week 4)                    p = .5514
  meeting 2 (week 17)                   p = .5043

if the two results were independent draws
  P(Green Bay sweeps)  = .5514 x .5043                    = .2781
  P(Minnesota sweeps)  = .4486 x .4957                    = .2224
  P(either sweeps)                                        = .5004     a coin flip

what happened
  Minnesota won meeting 1 by 2, and meeting 2 by 2        -> a sweep
Two one-score games, thirteen weeks apart, both to the same side. That single pair proves nothing; it is on the page because the arithmetic is the whole argument in miniature. The two prices were right — a team that wins two games by two points was not mispriced at even money — and multiplying them still understated how often the same team takes both. Note also that this pair sits in the thirteen-plus-week window and the one-to-three-point margin bin, the two cells where the population shows no excess at all. The average is not a rule for any one pair.
What It Costs This Site
The reason to care is that this site's playoff simulation draws all 272 games independently. The odds page measured its calibration slope at 0.694 and yesterday's repair page fixed the levels with a 120-point rating-uncertainty knob. Independence between division rematches is one specific, measurable part of that overconfidence, and it can be priced rather than assumed.
Link the two games of each division pair with a latent correlation and choose it to reproduce the historical sweep rate. The answer is 0.0945, a small number. Re-running the 2026 simulation with the 43 pairs that still have both games unplayed linked at that value:
sweep rate among the linked pairs   .5482  ->  .5727      (history: .5731)
mean distance of a division title from 25%    19.438  ->  19.305
division favourites (above 50%)         −0.30 of a point on average
division longshots (below 10%)          +0.10
total movement across all 32 teams              4.6 points
It goes the right way and it is small. Linking the pairs widens the average team's season win total by about 0.02 of a win and pulls division odds toward the middle, which is the direction the calibration work says they need to go. But four and a half points of division title spread over 32 teams is not a repair; it is one named contributor to a gap that the 120-point knob moved by an order of magnitude more. I am reporting it as an identified mechanism, not proposing a change to the shipped simulation.
The 2026 schedule carries 96 division games in 48 home-and-home pairs, five of which have already played their first leg. In four of those five the host won, so the rematch is at the loser's ground — the .5159 group. The exception is San Francisco, which won in Melbourne and hosts the return in week 14, landing in the .6407 group. On this page's own reading, that grouping is mostly a statement about home field, and the rematch dates are late enough that the excess has largely decayed anyway.
What This Page Does Not Show
It is not a betting edge. The single-game test is a null at 0.81 standard errors, and the correlation finding is about the joint distribution of two results. It would matter to a parlay or to a season simulation; it does not say either game's price is wrong.
Correlation is what hidden differences produce. Perfectly calibrated marginals plus persistent unobserved team quality generate exactly this pattern. Nothing here identifies a cause, and “revenge”, “familiarity” and “one team is simply better than the file knows” all fit the same numbers.
Many cuts. Four time windows, five margin bins, two eras, a venue split and two forecasters. The claims I would defend are the pooled excess and its season-clustered standard error; the bin-level cells, especially the 205-pair and 213-pair ones, are descriptive.
The two tests disagree in strength. The clustered estimate reaches 2.18 and 2.96; the sign test reaches 22% and 5.8%. Both are reported above because publishing only the flattering one would misdescribe the evidence.
Division pairs are not a random sample of games. They are the matchups the schedule repeats, between teams that know each other and often finish near each other. Whatever is measured here belongs to that population and should not be extended to rematches that do not exist in the file.
The moneyline subset is later and smaller. 883 pairs against 1,340, concentrated from 2010 on, which is one plausible reason its excess is larger.
The latent correlation is fitted in hindsight, on the same 1,340 pairs it is then applied to, and a Gaussian copula is an assumption about shape that the data cannot confirm. The 2026 figures are an illustration of magnitude, not a forecast.
Method and Sources
Two files and one module. The June 2026 nflverse bundle (/data/games.csv, served at /data/games.csv): 7,276 played games from 1999 to 2025, 6,967 of them regular season, with closing spreads and, from 2006, two-way moneylines; its 272 2026 rows are schedule only, so no 2026 result reaches a historical figure here. The 2026 board is the dated snapshot explainer_src/_2026_week2_snapshot_2026-09-18.json, because the build republishes the June bundle over the served copy. And explainer_src/nfl_elo.py, imported rather than copied, fed every played game in file order exactly as its own backtest does. The harness is explainer_src/make_division_rematch_chart.py. The core of it:
pairs = {(season, frozenset(teams)): [meeting1, meeting2]}     # 1,347, all division
swept = (margin1 > 0) == (margin2 > 0)                          # 768 of 1,340 = .5731
implied = mean(p1 * p2 + (1 - p1) * (1 - p2))                   # .5497 engine, .5433 market
# the single game: does meeting 2 beat its number with meeting 1's margin?
ols(result_vs_spread2 ~ margin1)   -> +0.0186 per point, season-clustered SE 0.0229
The script asserts the engine constants, the bundle's row counts and the absence of any 2026 score, the pair census and that all 1,347 are division home-and-homes with a flipped venue, the sweep and split counts, both independence baselines, both season-clustered standard errors and both sign tests, all four time windows and all five margin bins cell by cell with their baselines, the monotone decay and the sign reversal at each end, the venue split, the home-win rate against the division-games page, the era split, the regression against the spread with its bands, the copula calibration, the 2026 simulation before and after linking, the five 2026 pairs that have played a first leg, the worked example down to its moneylines, and this page's own figures: 68 assertions, all green as of September 18, 2026.
Sources: the nflverse public game log (games.csv), including its closing spreads and moneylines. The rating method is Arpad Elo's. The dependence structure is modelled with a Gaussian copula, after Abe Sklar's theorem (1959).
Further reading
- Buffalo 41, Detroit 31, Graded — today's other page, and a simulation branch that came off exactly
- Shrinking the Playoff Odds — the generic repair for the overconfidence this page finds one source of
- Playoff Odds After Week 1 — where the 0.694 calibration slope was measured
- The Week-2 Line Moves Just Enough — the general version of the single-game null
- Do Division Games Play Differently? — the 54.8% home rate this population reproduces
- The Six Games That Count Double — why these particular six games decide so much
- Does Winning the Division Mean Anything Next Year? — the season-to-season version of repetition
- Our Prediction Model, Fully Stated — the engine, and the independence it assumes
- The Model Cannot See a Quarterback Change — one of the hidden differences that makes two results move together
- What a 60% Pick Is Worth — the market benchmark used here
- The Prediction Ledger — every probability this page grades against
- Power Rankings — the ratings the independence baseline is built from
Go deeper
Want the code behind these metrics? Work through the 45-chapter NFL analytics tutorial.
Browse tutorials Free tools