Buffalo 41, Detroit 31
Week 2 opened at Highmark Stadium and Buffalo won by ten. The ledger had frozen the Bills at .6612 on Tuesday morning, so the pick was right and the game cost .1148 of Brier score. The refreshed nflverse file has it 41–31, and ESPN's public scoreboard for September 17, pulled this morning, has the same two numbers.
What makes this one worth a page is the margin. On Tuesday the preview published a ladder of ten possible results and printed, for each, what the season simulation would say afterwards. One of those rungs was “Buffalo by 10”. Buffalo won by exactly ten. That is luck rather than foresight, and it is useful luck: instead of grading a forecast against the nearest neighbour of what happened, the whole branch column can be checked against the real board, number for number. It reproduces exactly — Detroit's NFC North chance at 26.8%, Buffalo's AFC East at 82.5%, New England's at 16.2%, Minnesota's at 44.3% — and the arithmetic below says why that was never in doubt.
The rest of the evening was ordinary in a way the preview also predicted. The rating move was 15.43 points, the 43rd percentile of every move this engine has made since 1999, and the board changed two rows.
The Pick, and a Market That Never Stopped Moving
The frozen row is arithmetic on two ratings that had not moved since Monday, because neither team had played:
gap      = 1635.5 (Buffalo) + 48 (home) - 1567.3 (Detroit)   = 116.2
p(BUF)   = 1 / (1 + 10 ** (-116.2 / 400))                     = .6612   -> the pick is Buffalo
Brier    = (.6612 - 1) ** 2                                   = .1148
The market agreed and kept agreeing harder. Here is Buffalo's price at every pull this site has saved, with the hold stripped:
| Source | Line | Moneylines (DET / BUF) | Buffalo, vig-free | Brier on the game |
|---|---|---|---|---|
| June bundle | BUF by 3 | +130 / −155 | 0.5830 | 0.1739 |
| Monday morning | BUF by 3.5 | +160 / −192 | 0.6309 | 0.1362 |
| Wednesday morning | BUF by 5.5 | +185 / −225 | 0.6636 | 0.1131 |
| Close | BUF by 5.5 | +195 / −238 | 0.6750 | 0.1056 |
The market started nearly eight points below the model in June, passed it on Wednesday at .6636, and closed at .6750 without moving the spread off 5.5 — the last leg was bought entirely with moneyline juice. Both forecasters were right, and the close was righter: .1056 against .1148, a gap of .0092. Over the seventeen games graded so far this season the closing price has beaten the ledger on ten of them and lost to it on seven, for a season Brier of .2072 against .2186. That gap of .0114 is the same small, persistent edge the fair-prices page measured at about a hundredth of a point a game since 2010, and closing favourites are 13 of 17 where the model is 11. Seventeen games settle none of it; the direction is simply what the history says to expect.
The preview made a point of this being the third-closest of the sixteen week-2 games, model against market, at 0.24 points on Wednesday morning. It was, and the two still ended 1.38 points apart at the close. A game the two forecasters agree on is the least informative kind for telling them apart, which was the preview's complaint and remains true.
The Exhibit
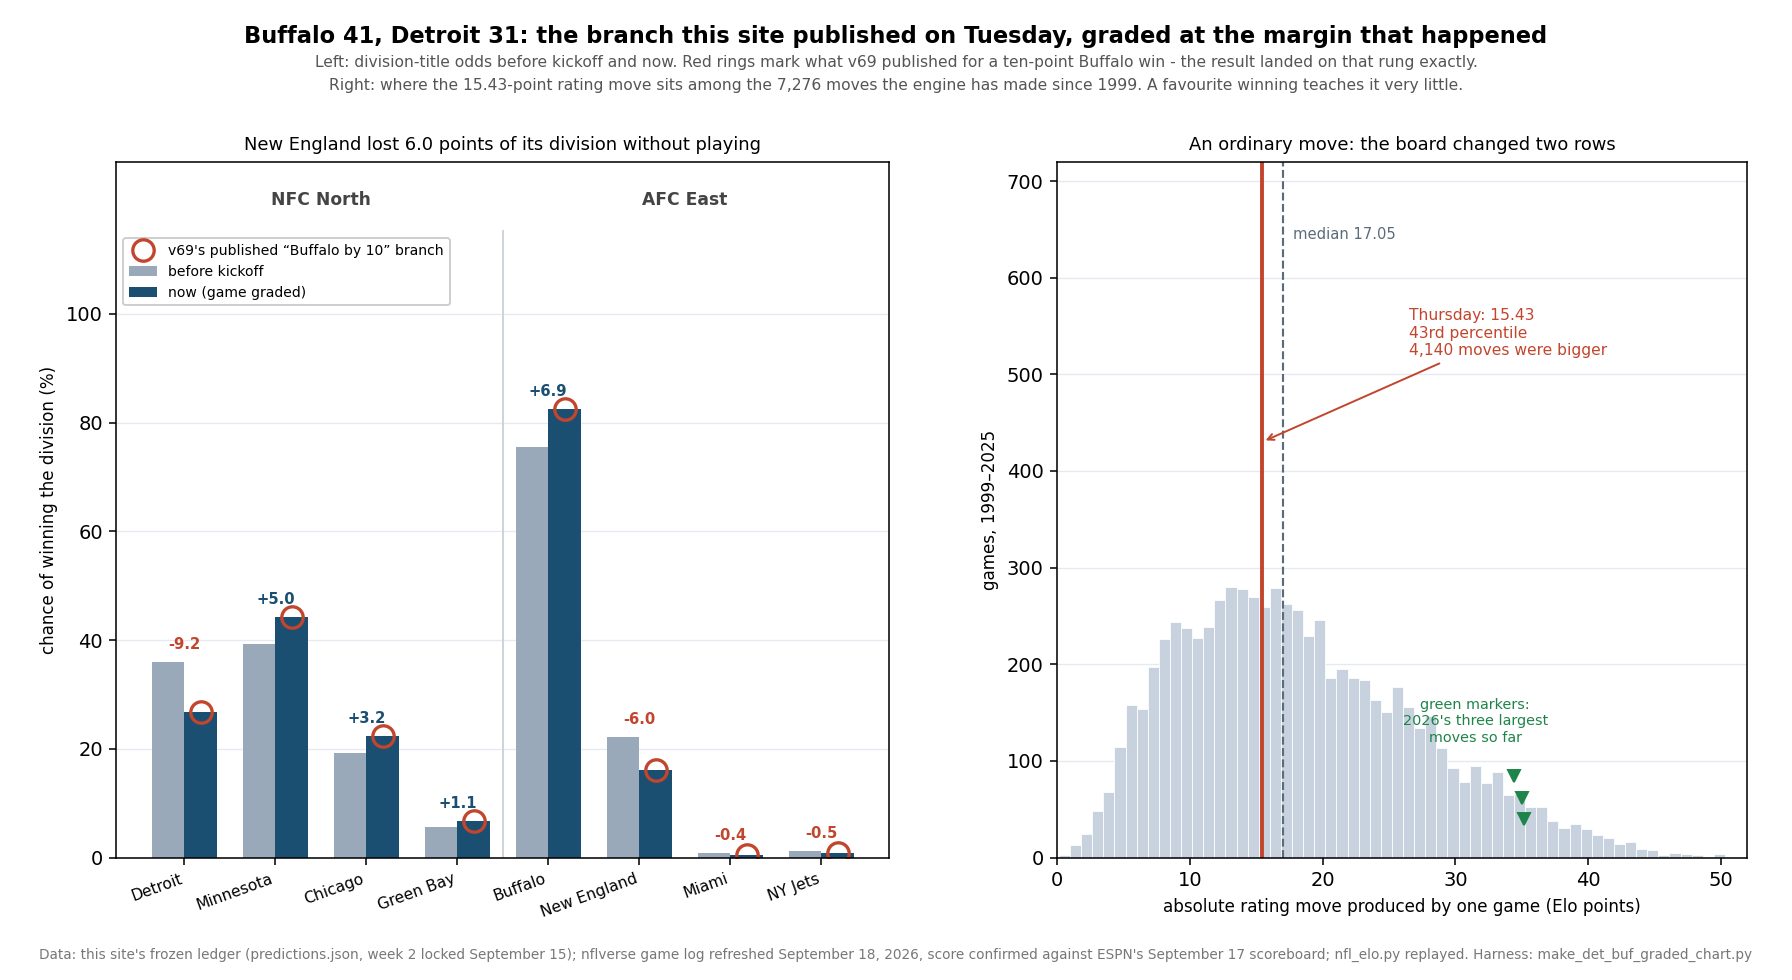
Two Division Races, Graded
Every team in the two divisions, with its chance of winning the division before kickoff and now, and its playoff odds either side:
| Team | Division | Before | Now | Move | Playoffs before | Playoffs now |
|---|---|---|---|---|---|---|
| Detroit | NFC North | 36.0 | 26.8 | -9.2 | 73.6 | 63.3 |
| Minnesota | NFC North | 39.3 | 44.3 | +5.0 | 75.7 | 76.8 |
| Chicago | NFC North | 19.1 | 22.3 | +3.2 | 55.1 | 56.9 |
| Green Bay | NFC North | 5.6 | 6.7 | +1.1 | 26.5 | 27.9 |
| Buffalo | AFC East | 75.6 | 82.5 | +6.9 | 92.1 | 95.9 |
| New England | AFC East | 22.2 | 16.2 | -6.0 | 60.5 | 59.7 |
| Miami | AFC East | 0.9 | 0.5 | -0.4 | 4.5 | 4.4 |
| NY Jets | AFC East | 1.3 | 0.8 | -0.5 | 7.4 | 7.0 |
Across all 32 teams the night moved 34.1 points of division title. The preview said a Buffalo win would move 34.1 and a Detroit win 76.4; the cheaper branch is the one that happened, which is what it means for a result to be expected.
New England is the number I flagged in advance and the one I want to be careful about. The preview said Thursday was worth 20.4 points of the Patriots' division title. That was the span between the two branches — 36.6% if Detroit won by ten, 16.2% if Buffalo did — and not a prediction that New England would move 20.4 points. What New England actually did, sitting at home, was fall from 22.2% to 16.2%: a realised move of 6.0 points. A span is not a move, and a page that prints one should say which it is. New England still moved more than any of the thirty teams that did not play, with Minnesota second at 5.0 points in the other direction.
Buffalo's chance of the AFC's top seed went from 28.9% to 38.7%, the largest single number on the page, and its expected wins over the seventeen games from the 11.60 the preview published to 12.22. Detroit is the team that paid: 9.2 points of division and 10.3 of playoff odds, and it is now behind both Minnesota and, on the rating board, Chicago. Neither loser is in trouble. Detroit at 63.3% is a team that lost to the second-best side in the file on the road.
Why the Branch Reproduced Exactly
A pre-registered branch matching the real board to the tenth looks like a coincidence and is not one. The update rule turns the result into rating points in three lines, and the preview ran those lines on Tuesday with the same inputs the pipeline used last night:
winner edge = (1635.5 + 48) - 1567.3                       = 116.2
multiplier  = ln(10 + 1) * (2.2 / (0.001 * 116.2 + 2.2))    = 2.3979 * 0.94983 = 2.2776
shift       = 20 * 2.2776 * (1 - .6612)                     = 20 * 2.2776 * .3388 = 15.43

Buffalo   1635.5 + 15.43 = 1650.93 -> 1650.9        Detroit   1567.3 - 15.43 = 1551.87 -> 1551.9
the pipeline's board this morning:   Buffalo 1650.9, Detroit 1551.9
The published rounded ratings plus the published shift land on the pipeline's two ratings after rounding. Every other rating in the league was untouched, because no other team played. The simulation is deterministic given a board and a seed, so identical inputs produce identical output, and the branch was always going to reproduce if the margin landed on the rung. That is the honest description: the preview's arithmetic was checkable in advance, and what the result supplied was the choice of column.
It is worth being precise about what this does and does not grade. It grades the mechanism — the update rule, the simulation, and the claim that the two were coherent. It does not grade the probability. Buffalo at .6612 won one game; a number like that is only tested over hundreds, which is what the calibration page did yesterday across 4,363 of them.
The Move, and a Board That Barely Noticed
Against the 7,276 rating moves in the file, 15.43 sits at the 43rd percentile: 4,140 games moved a rating further, and the median game moves 17.05. It is the twelfth largest of the seventeen moves 2026 has produced, in a season whose largest is still Arizona at the Chargers in week 1 at 35.17.
The preview predicted this shape explicitly, and it is the most reliable thing on either page. The update rule pays the winner (outcome − probability), so a favourite collects only the .3388 it had not already been given while an underdog would have collected .6612. The preview's ladder priced a three-point Buffalo win at 8.92 rating points against 17.41 for a three-point Detroit win, almost exactly twice. A favourite winning teaches this model very little, which is the update rule doing what it is built to do.
The consequence is that the board hardly moved. Exactly two of the 32 ranks changed: Detroit fell from twelfth to thirteenth and Chicago rose from thirteenth to twelfth, on a 12.8-point gap that Thursday closed and crossed. Buffalo stayed second, 32.1 points behind Seattle. The rankings-movement page put the median game at four rows; this was half that.
The Scoreboard, and the Budget
The ledger now reads eleven of seventeen with a Brier score of .2186, against the .2293 the model's own probabilities expected of those seventeen games. It is running slightly better than it said it would, which after seventeen games means nothing at all.
The miss budget is the cleaner accounting. The budget page opened the season at 99.11 expected misses across 272 games. Week 1 spent 6.09 of them and delivered six, leaving 99.02. Thursday carried an expected .3388 of a miss and delivered none:
99.11 - (6.0868 + 0.3388) + (6 + 0) = 98.6844 -> the season now reads 98.68So the season now reads 98.68, down 0.43 of a game since August, all of it earned rather than assumed. Week 2 itself reads one for one, with 4.88 expected misses still to come across the fifteen unplayed games. The board is frozen and the fifteen probabilities were written on September 15, so Sunday grades them as published.
Seventy-Two Points, and a Series That Broke Its Own Rule
The two teams scored 72 points against a closing total of 54.5, the highest number on the week-2 board, and went over it by 17.5. Monday's scoring page had fitted this game's total at 49.21 from the two teams' week-1 scoring and the league's, and missed by 22.79 points. I said at the time that a regression on scores knows nothing about who is playing and misses week-2 totals by 2.80 points in its own sample; missing by 22.79 is not that fit being unlucky, it is that fit being asked a question it cannot answer. The market's 54.5 was nine points closer and still well short.
The series had a signature and Thursday erased it. The preview reported seven meetings from 2002 to 2024, Buffalo winning six, with margins of 7, 3, 2, 3, 1, 3 and 6 — not one decided by more than a touchdown. The eighth was decided by ten, the widest in the series, and it lifts the average margin from 3.57 to 4.375. Buffalo is now 7–1. The 72 points are the second-highest total of the eight, behind the 90 of 2024. Seven games said nothing about Thursday, which the preview also said, and eight say nothing about the next one.
What This Page Does Not Show
One game grades a pick, not a probability. The model's .6612 and the market's .6750 both won. Nothing here says which was closer to right, and a single result never can.
The branch reproducing is arithmetic, not vindication. The simulation is deterministic given a board and a seed, and the margin happened to land on a published rung. What is graded is that the preview's update-rule and simulation figures were correct, which was checkable before kickoff.
The odds are still too confident at the ends. The calibration page measured this simulation's slope at 0.694 and fitted a repair. Buffalo's 95.9% playoff figure is nearer 84% on the corrected version, and Detroit's 63.3% nearer 58%. The moves on this page survive that correction better than the levels do, but read every level as further from the middle than it should be.
Ties are broken at random in the simulation, with no head-to-head and no division records. The NFC North numbers, with three teams inside eighteen points of division title, lean on that more than the AFC East ones do.
The market numbers are the file's. The June, Monday and Wednesday prices are dated snapshots this site saved; the closing price is the game file's own, and I have no independent record of when it was captured.
The 20.4 was mine to be careful about. It was published as a span between two branches and could be read as a forecast of movement. It was not one, and the realised figure is 6.0.
Method and Sources
Four files and one module. The nflverse game log as refreshed on the morning of September 18, saved as a dated snapshot with the ledger fields it produced (explainer_src/_2026_week2_snapshot_2026-09-18.json), because the build republishes the June bundle over the served copy at /data/games.csv. ESPN's public scoreboard for September 17, pulled with default headers and saved raw beside it (explainer_src/_espn_nfl_scoreboard_2026-09-17.json): one game, final, Buffalo 41, Detroit 31, the same as the nflverse row. The September 14 and September 16 pulls for the earlier prices. The frozen ledger at /data/predictions.json. And explainer_src/nfl_elo.py, imported rather than copied, whose replay reproduces all 32 ratings. The harness is explainer_src/make_det_buf_graded_chart.py. The lines that grade the branch:
board_now   = simulate(ledger_ratings, seventeen_results_fixed)   # 20,000 seasons, seed 2026
board_pre   = simulate(ratings_with_BUF=1635.5, DET=1567.3, sixteen_results_fixed)
[r1(board_now.div[t]) for t in eight] == [26.8, 44.3, 22.3, 6.7, 82.5, 16.2, 0.5, 0.8]
# which is, cell for cell, the "Buffalo by 10" column v69 published on September 16
The script asserts the engine constants, the snapshot's shape and the fifteen still-unplayed week-2 rows, the score against ESPN including its winner flags, the ledger's scoreboard and the graded row, the Brier arithmetic, the market at all four pulls with their holds and Briers, the model-market gap rank, the replay's reproduction of the board, the worked example to five figures, the move's percentile and its rank among 2026's seventeen, the two rank changes, both simulation boards cell by cell against the preview's published columns, the total division movement, New England's realised move against the published span, the budget path, the season Brier against its expectation, the total against the scoring page's fit, the series history, the season's market comparison, and this page's own figures: 86 assertions, all green as of September 18, 2026.
Sources: the nflverse public game log (games.csv), including its closing spreads, totals and moneylines; ESPN's public NFL scoreboard for September 17, 2026, used only to confirm the score. The Brier score is Glenn Brier's, from Verification of Forecasts Expressed in Terms of Probability (1950); the rating method is Arpad Elo's.
Further reading
- Detroit at Buffalo: Two Division Races, One Thursday — the page graded here, published two days before kickoff
- What the First Meeting Tells You About the Second — today's other page: why this simulation treats division games as independent, and what that costs
- Ten of Sixteen: Kansas City 31, Denver 10, Graded — the previous grading note, and a miss instead of a hit
- Shrinking the Playoff Odds — how much of the certainty in these numbers survives a calibration test
- Where the Overconfidence Is Not — the same question asked of the game picks rather than the season
- What One Game Moves — the update rule behind the lopsided rating column
- Nobody Moved — how much a game usually rearranges the board
- The Miss Budget — the 99.11 that now reads 98.68
- Fifty Points a Game in Week 1 — the fitted total this game ran past
- The Model Cannot See a Quarterback Change — not a factor here: both teams started the expected quarterback
- The 0-2 Hole Is Mostly the Two Games — what the other fifteen week-2 games can still do
- The Prediction Ledger — eleven of seventeen, and fifteen week-2 rows still frozen
- Power Rankings — Buffalo second, Detroit now thirteenth
Go deeper
Want the code behind these metrics? Work through the 45-chapter NFL analytics tutorial.
Browse tutorials Free tools