Three Defects, Measured Separately
In the last four days this site has measured three things wrong with its own forecasting and shipped none of them. The playoff simulation is too sure of itself, because it treats every rating as exactly right; the repair is to assume each rating is wrong by a normal draw of some number of Elo points. The engine cannot see a quarterback change, which is worth 78 Elo points in hindsight. And division rematches are swept more often than two independent prices imply, which a latent correlation of 0.0945 reproduces.
Each was fitted on its own, and each page was careful to say it was not proposing a change to the shipped numbers. The obvious next question is what happens when all three are applied at once: how much of the calibration gap do they close together, and do they add up?
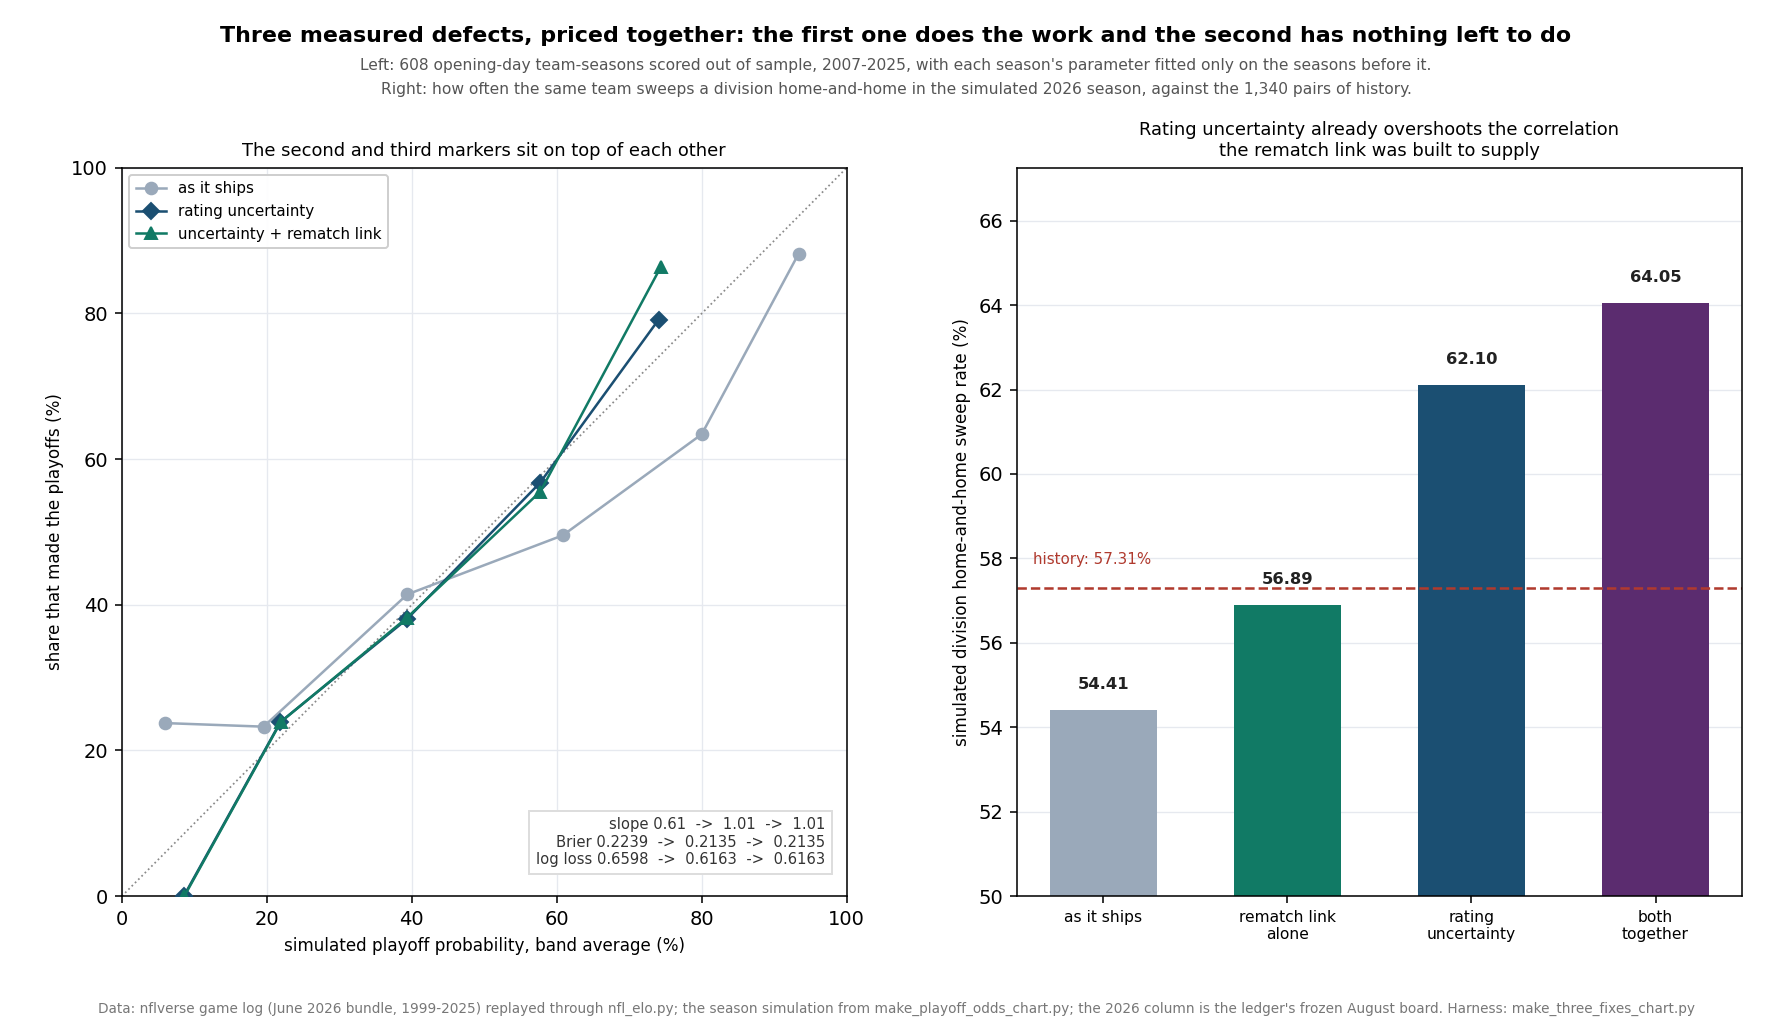
They do not add up, and my position is that this is the useful finding rather than a disappointment. Priced together on 768 team-seasons and scored out of sample on 608, the rating uncertainty does essentially the whole job — Brier .22388 to .21348, calibration slope 0.607 to 1.007, better in 16 of 19 test seasons. The rematch correlation, applied on top of it, is worth 0.000013 of Brier score with a season-level standard error of 0.000037. And the quarterback correction cannot be applied going forward at all. Three separately-fitted repairs turn out to be very nearly one repair, and the two that survive are the same repair twice.
The Test Bed, and Why It Is the Opening Day
Every figure here is scored on the opening-day board of each season from 2002 to 2025: the ratings as they stood before a single game was played, carried through the site's own 20,000-season simulation, and graded against who actually made the playoffs. That is 24 seasons and 768 team-seasons, of which the 19 seasons from 2007 are scored out of sample, with each season's parameter chosen only on the seasons before it.
Two reasons for that choice. The first is that the repair page fitted its parameter on the board after week 1 and left opening day as a footnote, so this is the harder and less-examined version of the same question. The second is that an opening-day board is finished history: it is computed from the previous season's results and nothing else, so no game played this year can move a number on this page. The 2026 column below is the ledger's frozen August board, locked on 2026-08-12, with Seattle at 1674.6. Nothing here previews or grades a 2026 result.
The harness reproduces the earlier pages before it does anything new. The after-week-1 board comes back at a Brier score of .2082 and a slope of 0.684, and its repair at .1997, which are the three numbers the repair page published. The opening-day board comes back at .2247 and 0.596, which is that page's footnote. Nothing below is a new simulation; it is the same one, asked a longer question.
The Exhibit
How Wrong the Ratings Should Assume They Are
The first correction has one parameter: the standard deviation of the rating error the simulation assumes before each simulated season. Here is the sweep across the 768 team-seasons, with and without the rematch link applied on top:
| Rating uncertainty (Elo points) | Brier | Calibration slope | Brier, with the rematch link | What the link adds |
|---|---|---|---|---|
| 0 | 0.22475 | 0.596 | 0.22437 | +0.000383 |
| 40 | 0.22156 | 0.635 | 0.22132 | +0.000245 |
| 80 | 0.21648 | 0.742 | 0.21636 | +0.000121 |
| 100 | 0.21492 | 0.811 | 0.21488 | +0.000034 |
| 120 | 0.21396 | 0.889 | 0.21399 | -0.000030 |
| 140 | 0.21359 | 0.973 | 0.21358 | +0.000013 |
| 160 | 0.21374 | 1.057 | 0.21372 | +0.000016 |
| 200 | 0.21472 | 1.231 | 0.21474 | -0.000014 |
Two things to read here. The opening-day board wants 140 points of assumed rating error, not the 120 the after-week-1 board wanted, and the minimum is interior: 200 is worse than 140. That is the right direction for the wrong-looking reason. A board built in February has had a whole offseason to become wrong about rosters, and by late September it has at least seen everyone play once, so the earlier board should trust itself less. The repair page said as much in a sentence; this is the number.
The last column is the second finding arriving early. On the raw board the rematch link is worth +0.000383, a small positive. By 80 points of rating uncertainty it is a third of that, and from 120 onward it is bouncing either side of zero at the fifth decimal place. The correction is not being outvoted; it is being made redundant.
All Three, Scored Out of Sample
Fitted walk-forward — each test season's parameter chosen only on seasons before it, nineteen test seasons, 608 team-seasons — the arms come out like this:
| Out of sample, 2007–2025 | Brier | Log loss | Calibration slope | Playoff seats a season |
|---|---|---|---|---|
| The simulation as it ships | 0.22388 | 0.65976 | 0.607 | 12.632 |
| Rating uncertainty (v68) | 0.21348 | 0.61630 | 1.007 | 12.632 |
| Rating uncertainty + rematch link (v68 + v73) | 0.21346 | 0.61627 | 1.010 | 12.632 |
Rating uncertainty gains 0.01040 of Brier score with a season-level standard error of 0.00309, which is 3.4 standard errors, and it helps in 16 of the 19 seasons. On the opening-day board it is worth a third more than the repair page measured after week 1, which follows from the board being worse to begin with. The fitted parameter is steady: across nineteen expanding windows it never leaves 140 to 160, and it ends at 140.
Adding the rematch link to that moves the Brier score by 0.000013 against a standard error of 0.000037, and the log loss by three hundred-thousandths. The first correction is more than a hundred times the second. All three arms still hand out 12.632 playoff seats a season, which is the real average field over this window — the test the shrinkage version of the repair failed, and the reason the repair page preferred this one.
Why the Second Correction Has Nothing Left to Do
A null is more convincing when you can say what happened to the effect, so here is the mechanism in one measurement. Take the 48 division home-and-home pairs on the 2026 schedule and count how often the simulation has the same team winning both:
simulated sweep rate, 48 division pairs, 20,000 seasons
  as it ships (independent draws)                 .5441
  with the rematch link alone                     .5689
  with rating uncertainty alone                   .6210
  with both                                       .6405

what 1,340 historical pairs actually did          .5731
The shipped simulation draws every game independently and comes in below the historical sweep rate, which is exactly the defect the rematch page identified. Applied on its own, the copula moves it to .5689 and lands close to the real number. But rating uncertainty, which was fitted for something else entirely, takes it to .6210 — already past history in the other direction. Adding the link on top pushes it to .6405.
That is not a coincidence. Perturbing a team's rating once per simulated season and then pricing all seventeen of its games off the perturbed number induces correlation between every pair of that team's games, including the two legs of a division series. The rematch page argued that the two results are dependent because both are driven by the same unobserved facts about how good the teams are; rating uncertainty is a model of precisely that, so it produces the dependence as a by-product. The copula then adds a second helping of the same thing.
Which means the honest reading of the pair is not “the rematch finding was wrong”. It was measured on the shipped simulation, and on the shipped simulation it is real. It is that two corrections aimed at different symptoms turn out to be aimed at the same cause, and the one fitted on 608 team-seasons of playoff outcomes dominates the one fitted on 1,340 rematches.
The Third Fix Cannot Be Applied at All
The quarterback correction is different in kind, and the difference is not subtle: nobody knows in September who will change quarterback in November. The 78-point dock is a number fitted on games where the change had already happened. There is no version of it that can be applied to an opening-day board, because the input does not exist yet.
What can be done is to ask how much of the rating uncertainty it accounts for. Split the 768 team-seasons by whether that team started more than one quarterback during the season, which is knowable only afterwards:
| Team-seasons, split by what happened at quarterback | Team-seasons | September said | Made playoffs | Gap | Best rating uncertainty |
|---|---|---|---|---|---|
| Kept one starting quarterback all season | 300 | 42.6% | 52.3% | +9.8 | 120 |
| Changed at least once | 468 | 36.8% | 30.6% | -6.3 | 160 |
The 300 team-seasons that kept one starter made the playoffs 9.75 points more often than the opening-day board said they would; the 468 that did not came in 6.25 points under. Sixteen points of playoff probability separate two groups that are indistinguishable on the day the board is published. And the group that changed quarterback wants 160 Elo points of assumed rating error against 120 for the group that did not.
So the third finding is not a fourth column in the table above. It is an explanation of the second one. A large part of what the 140-point knob is paying for is the fact that a fifth of the league will be starting a different quarterback by December and the September board has no way to know which fifth. Priced as a separate correction it would be double-counting; priced as a reason the knob has to be that large, it is the most useful thing on this page.
Worked Through: Why Noise Flattens
The arithmetic that makes the whole page work is one line of convexity, and it is worth doing by hand. Take the two ends of the frozen August board — Seattle at 1674.6 and Tennessee at 1349.8 — and suppose they met at Seattle:
gap        = 1674.6 + 48 (home) - 1349.8              = 372.8
p(Seattle) = 1 / (1 + 10 ** (-372.8 / 400))            = .8953

now assume each rating is wrong by 140 points, and take the two equally likely cases
  Seattle 140 low, Tennessee 140 high:  gap = 92.8     = .6305
  Seattle 140 high, Tennessee 140 low:  gap = 652.8    = .9772
  average of the two branches                          = .8038
The average of the two perturbed probabilities is 9.15 points lower than the unperturbed one, because the logistic curve is concave in that region: the branch where Seattle is even better cannot gain as much as the branch where it is worse loses. Run that over 272 games and 20,000 seasons and every confident team's odds come down while every hopeless team's come up, which is the whole of the correction. It is also why the correction can never reorder a board, and why nothing in the 2026 table below changes who is favoured.
The Frozen 2026 Board, All Three Ways
For scale, the ledger's frozen August board carried through the same three arms. This is not the site's playoff-odds table — the August page stands as written, and this is an argument about it. It is also deliberately the opening-day board rather than a current one, so that every number here is fixed rather than something that moves each weekend.
| Team | As it ships | Rating uncertainty | All three | Change |
|---|---|---|---|---|
| Seattle | 93.7 | 77.2 | 77.2 | −16.5 |
| Houston | 85.4 | 69.0 | 69.0 | −16.4 |
| Denver | 84.3 | 68.2 | 68.2 | −16.2 |
| Philadelphia | 81.9 | 64.8 | 64.8 | −17.0 |
| Buffalo | 80.6 | 65.8 | 65.8 | −14.8 |
| LA Rams | 76.5 | 61.9 | 61.8 | −14.7 |
| New England | 72.8 | 61.0 | 61.0 | −11.8 |
| Baltimore | 71.6 | 60.2 | 60.1 | −11.5 |
| Detroit | 70.7 | 59.0 | 58.8 | −11.8 |
| Jacksonville | 67.8 | 58.1 | 58.0 | −9.8 |
| Minnesota | 61.8 | 53.4 | 53.2 | −8.6 |
| San Francisco | 56.7 | 50.8 | 50.7 | −6.0 |
| Pittsburgh | 47.2 | 46.6 | 46.6 | −0.6 |
| Green Bay | 44.9 | 44.9 | 45.0 | +0.1 |
| Tampa Bay | 44.8 | 43.9 | 43.9 | −0.8 |
| LA Chargers | 42.3 | 44.6 | 44.6 | +2.4 |
| Cincinnati | 39.6 | 42.4 | 42.4 | +2.8 |
| Kansas City | 37.6 | 42.3 | 42.3 | +4.7 |
| Chicago | 37.2 | 40.8 | 40.8 | +3.6 |
| Atlanta | 36.6 | 39.1 | 39.2 | +2.6 |
| New Orleans | 28.5 | 34.9 | 35.0 | +6.5 |
| Indianapolis | 27.9 | 36.8 | 36.8 | +8.9 |
| Washington | 19.6 | 31.7 | 31.6 | +12.0 |
| Dallas | 19.3 | 31.6 | 31.6 | +12.3 |
| Cleveland | 19.0 | 31.6 | 31.6 | +12.6 |
| Miami | 16.2 | 30.0 | 30.1 | +13.8 |
| Carolina | 13.6 | 25.7 | 25.8 | +12.2 |
| NY Giants | 11.1 | 24.6 | 24.7 | +13.6 |
| Arizona | 3.3 | 15.7 | 15.8 | +12.5 |
| Tennessee | 2.9 | 15.6 | 15.6 | +12.7 |
| NY Jets | 2.8 | 14.4 | 14.4 | +11.7 |
| Las Vegas | 1.9 | 13.4 | 13.5 | +11.5 |
The third column and the fourth are the same column. Across all 32 teams the three fixes together move 313.2 points of playoff probability, of which the rating uncertainty supplies 311.8 and the rematch link adds 1.7. The largest single contribution from the second correction anywhere on the board is two tenths of a point, on Detroit.
The shape is the familiar one: seven teams lose more than ten points and ten teams gain more than ten, nobody crosses fifty per cent, and the bottom of the board stops being written off — Las Vegas from 1.9% to 13.5%. Whether that is an improvement is not a matter of taste; over nineteen out-of-sample seasons the flattened version scored better in 16 of them.
What This Page Does Not Show
Three corrections fitted separately, combined afterwards. That is the overfitting risk in this kind of work and it is worth naming plainly. Two of the three were fitted on the same 24 seasons they are then scored on, in the sense that the grid of candidate values was chosen by looking at the data; only the walk-forward column protects against it, and it protects the rating-uncertainty parameter rather than the choice of which repairs to try. The order in which I applied them also matters: the rematch link looks worthless because rating uncertainty went first. Applied the other way around, the link is worth +0.000383 and the uncertainty still fixes almost everything that is left.
This is not the site's playoff-odds table and must not be read as one. The published odds are the August page's. Adopting any of this means changing the simulation in the build, which is a separate decision, and on this evidence I would change one thing rather than three.
Nineteen test seasons is nineteen observations. The gain of 0.01040 carries a season-level standard error of 0.00309, and six of those seasons have a different playoff format from the other thirteen.
The noise model is the simplest possible one. Independent, normal, identical for every team, drawn once a season and held. The quarterback split above is direct evidence that it should not be identical for every team — some teams are more forecastable than others — but a correction that needs to know which teams in advance is not available.
The sweep-rate comparison is not like-for-like. The .5731 is 1,340 historical pairs with both meetings decided; the simulated rates are 48 pairs of one particular schedule drawn 20,000 times. They are close enough in construction to make the point about direction and size, and not close enough to read the third decimal.
Ties are still broken at random in the simulation, with no head-to-head and no division records, exactly as the August page disclosed.
The random stream differs from the shipped one. Applying a copula needs a normal draw where the shipped simulation compares a uniform draw directly — the same coin, thrown differently. The raw column above reproduces the published August table to within 1.25 points on all 32 teams, and 0.37 on average, which is the Monte-Carlo noise of 20,000 seasons rather than a difference of method.
Method and Sources
Two files and one module. The June 2026 nflverse bundle (/data/games.csv, served at /data/games.csv): 7,276 games played from 1999 to 2025, with its 272 2026 rows schedule-only, so no 2026 result can reach a figure here. The frozen ledger at /data/predictions.json, from which this page takes only the August rating fields, never the scoreboard. And explainer_src/nfl_elo.py, imported rather than copied, whose replay reproduces all 32 frozen ratings. The simulation is the one in make_playoff_odds_chart.py, with the field size as a parameter. The harness is explainer_src/make_three_fixes_chart.py. The three corrections are these lines:
# v68: one rating draw per team per simulated season
e   = rng.normal(0.0, sigma, size=(20000, 32))
gap = (rating[home] + e[:, home]) - (rating[away] + e[:, away]) + home_field

# v73: the two legs of a division pair, linked (the venue flips, so the sign does)
Z[:, leg2] = -rho * Z[:, leg1] + sqrt(1 - rho ** 2) * Z[:, leg2]

# v71: not applicable - the input does not exist until the change has happened
The script asserts the engine constants, the bundle's row counts and the absence of any 2026 score, the 24-season census and its playoff-field sizes, the reproduction of the earlier pages on both boards, the full sigma sweep with its interior minimum and monotone slope, both walk-forward arms with their season-level standard errors and win counts, the seat counts in all three states, the fitted parameter path, the four simulated sweep rates against the historical one, the quarterback split with both gaps and both fitted parameters, the 2026 board cell by cell against the published August table, the worked example to four places, and this page's own figures: 59 assertions, all green as of September 19, 2026.
Sources: the nflverse public game log (games.csv). The Brier score is Glenn Brier's, from Verification of Forecasts Expressed in Terms of Probability (1950); the dependence structure is a Gaussian copula, after Abe Sklar's theorem (1959); the rating method is Arpad Elo's.
Further reading
- Shrinking the Playoff Odds, Tested Out of Sample — the correction that turns out to do all the work
- What the First Meeting Tells You About the Second — the correction this page finds redundant, and why it was right on the shipped simulation
- The Model Cannot See a Quarterback Change — the 78 Elo points that cannot be applied in advance
- Playoff Odds After Week 1 — where the calibration problem was first measured
- Where the Overconfidence Is Not — the same test one level down, on the game picks, where it is a null
- Elo-Implied 2026 Playoff Odds — the August table, which stands as written
- The Offseason Haircut — why an opening-day board is the one to trust least
- Our Prediction Model, Fully Stated — the engine, and the independence its simulation assumes
- The Model Has No Good Years, Only Lucky Ones — why nineteen seasons is not many
- The Prediction Ledger — the frozen August ratings this page re-prices
- Power Rankings — the board the simulation now assumes it has wrong by 140 points
Go deeper
Want the code behind these metrics? Work through the 45-chapter NFL analytics tutorial.
Browse tutorials Free tools