Eight of Fourteen, and the Score Says Nothing Broke
Fourteen games finished on Sunday, September 20. This site's published ledger had a pick on every one of them, locked before kickoff, and it got eight right. The season Brier score went from .2186 over the first seventeen graded games to .2364 over thirty-one — a move of .0178 in the wrong direction, on a scale where a coin flip scores .2500. Read that alone and the model spent Sunday getting worse.
It did not, and the way to see it is to stop reporting the Brier score and take it apart. A Brier score is three things added together, and only one of them is about the forecaster. The other two are about the question. When I split this season's thirty-one games that way, the term that measures whether the model means what it says — its calibration error — comes out at .00104. The term that measures how much it actually knows comes out at .00481. Everything else, .23725 of the .2364, is the irreducible difficulty of guessing NFL games.
So my position on this page is not the comfortable one. Sunday did not damage this model, and the reason is that there was not much there to damage. The engine is well calibrated and it is not sharp. It has never been sharp. Across the 4,350 games it has graded since 2010 its resolution is .00631 — it beats a forecaster that ignores the teams entirely and announces that the favourite wins 64.7% of the time, on every game, by .0074 of Brier score. This season, so far, that margin is .0009.
That is a harsher thing to say about the engine than that it went 8 of 14. It is also the thing the numbers support.
The Exhibit
What a Brier Score Is Made Of
Glenn Brier's score is the mean squared error of a probability forecast: take the number you announced, subtract 1 if the thing happened and 0 if it did not, square it, average. Lower is better, 0 is perfect, and a forecaster who says 50% about everything scores .2500 no matter what happens.
In 1973 Allan Murphy showed that this single number is three separate quantities travelling under one name. Group the forecasts into bands by the probability announced, and:
- Reliability is how far each band's actual hit rate sits from what that band claimed, squared and weighted by size. It is the only term that measures honesty. Zero means the 70% forecasts won exactly 70% of the time.
- Resolution is how far each band's hit rate sits from the overall base rate. It is the term that measures knowledge — how much the forecaster separates the games it will get right from the ones it will not. Bigger is better, and it subtracts.
- Uncertainty is the base rate's own variance, and the forecaster has no say in it at all. It is set by how often favourites win, and nothing else.
Brier = reliability − resolution + uncertainty. Every forecaster grading the same set of games is handed the same uncertainty term, so comparing raw Brier scores across different game sets — a good week against a bad week, one season against another — compares the schedules as much as the models.
| Split of the Brier score | 2010–2025 | 2026 so far | Sunday alone |
|---|---|---|---|
| Games graded | 4,350 | 31 | 14 |
| Picks correct | 64.69% | 61.29% | 57.14% |
| Reliability — is it honest? (lower better) | .00032 | .00104 | .0277 |
| Resolution — does it know anything? (higher better) | .00631 | .00481 | .0163 |
| Uncertainty — not the model's doing | .22842 | .23725 | .2449 |
| Brier score | .2210 | .2364 | .2580 |
The uncertainty column alone accounts for more than 99% of each of those Brier scores. That is the whole story of why this engine's score has always hovered a couple of hundredths under a coin flip, and it is why I do not read a weekly Brier as a report card.
The Calibration Held, Including on Sunday
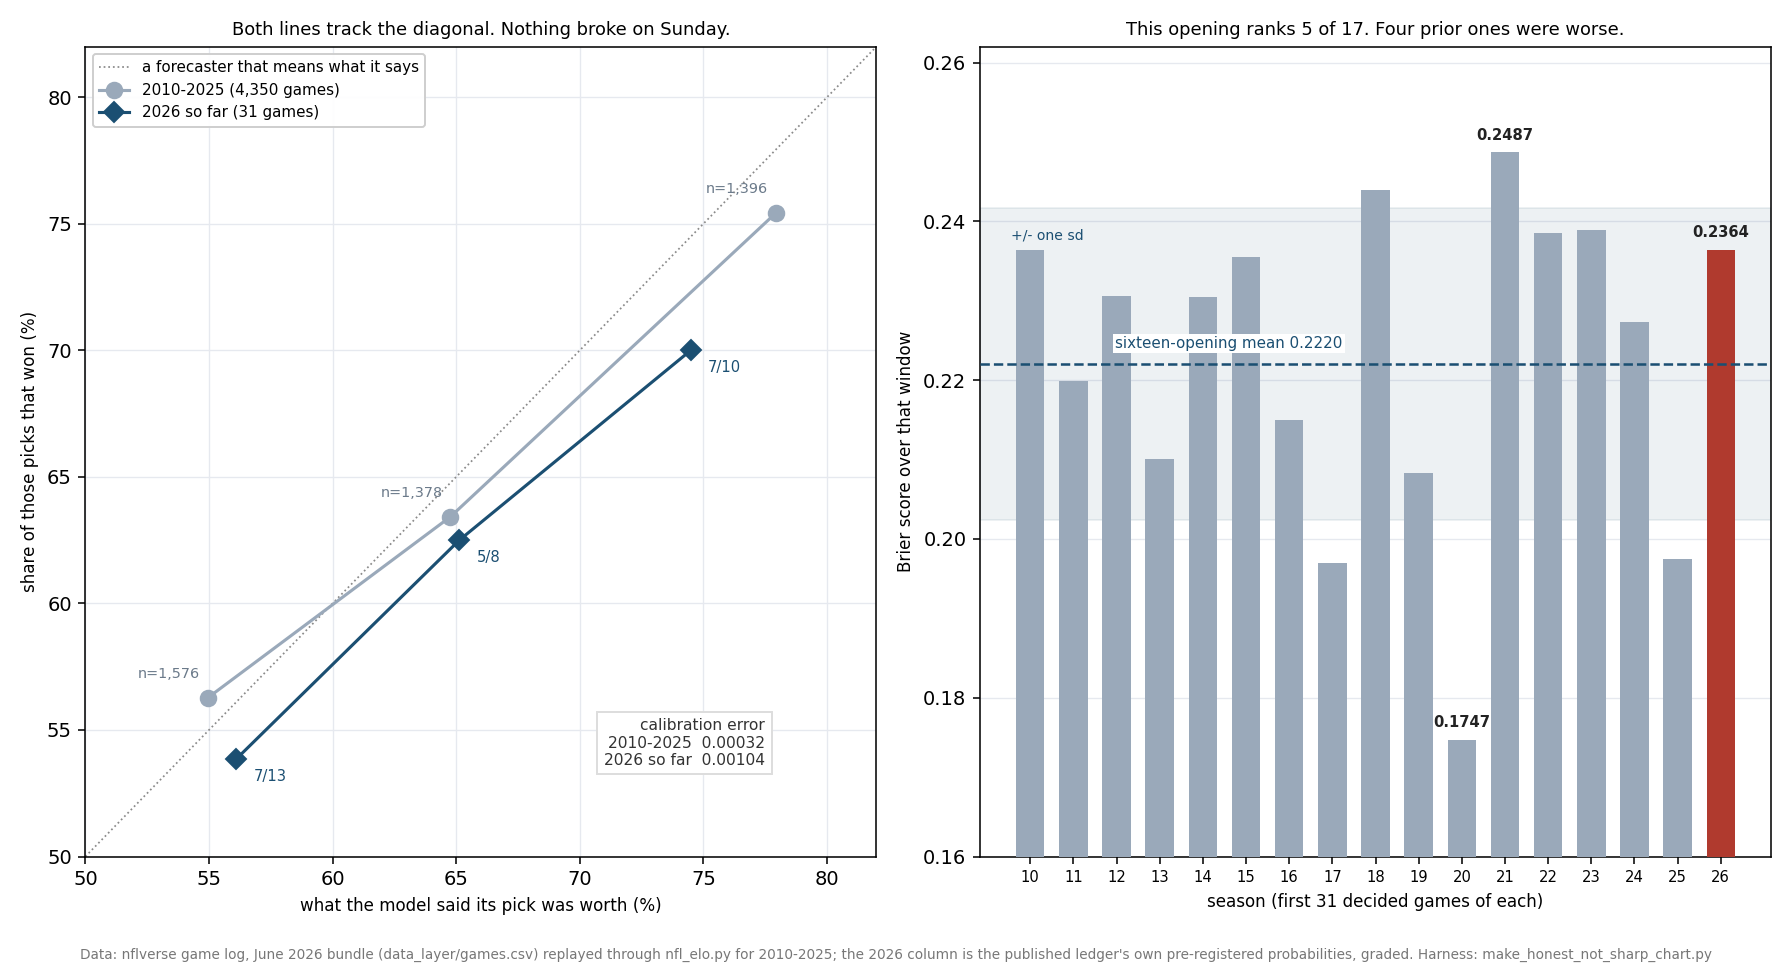
The left panel is the honesty check. Three bands, the probability the ledger put on the side it actually picked, against how often that side won.
| Confidence band | 2026: claimed | 2026: won | 2026: gap | 2010–2025 gap |
|---|---|---|---|---|
| 50–60% — 13 games | 56.1% | 53.8% (7/13) | −2.3 | +1.3 |
| 60–70% — 8 games | 65.1% | 62.5% (5/8) | −2.6 | −1.3 |
| 70%+ — 10 games | 74.5% | 70.0% (7/10) | −4.5 | −2.5 |
Every band is within 4.5 points of its own claim, on sample sizes of eight to thirteen games where the standard error on a hit rate is 14 to 17 points. The small negative tilt in all three — the model running very slightly hot — is the same tilt the sixteen-year replay shows in its top two bands, and it is the finding this site published on September 17, four days and fifteen games ago, from the historical side alone. Sunday was the first live test of that claim since it was made. It survived.
Sunday on its own has a reliability term of .0277, more than twenty times the season figure. That is not a contradiction, it is what fourteen games look like: split fourteen games into three bands and you are asking four or five coin flips to land on their expectation. They do not. The reason the season number is .00104 and the slate number is .0277 is arithmetic, not evidence.
The Slate, Worst to Best
Sorted by how much each game cost. The probability column is what the ledger gave the side it picked.
| Game | Pick | Said | Result | Brier |
|---|---|---|---|---|
| New Orleans at Baltimore | Baltimore | 75.5% | New Orleans 24–17 | .5700 |
| Las Vegas at LA Chargers | LA Chargers | 71.8% | Las Vegas 26–14 | .5148 |
| Cincinnati at Houston | Houston | 68.7% | Cincinnati 20–6 | .4724 |
| Cleveland at Tampa Bay | Tampa Bay | 65.8% | Cleveland 23–19 | .4336 |
| Carolina at Atlanta | Atlanta | 64.4% | Carolina 34–3 | .4151 |
| Minnesota at Chicago | Chicago | 53.4% | Minnesota 9–3 | .2854 |
| Washington at Dallas | Dallas | 54.9% | Dallas 37–20 | .2030 |
| Jacksonville at Denver | Denver | 56.5% | Denver 20–13 | .1896 |
| Green Bay at NY Jets | Green Bay | 60.6% | Green Bay 20–17 | .1549 |
| Pittsburgh at New England | New England | 64.2% | New England 20–3 | .1279 |
| Indianapolis at Kansas City | Kansas City | 70.1% | Kansas City 33–30 | .0896 |
| Seattle at Arizona | Seattle | 76.5% | Seattle 31–7 | .0550 |
| Miami at San Francisco | San Francisco | 77.4% | San Francisco 35–13 | .0512 |
| Philadelphia at Tennessee | Philadelphia | 77.8% | Philadelphia 24–20 | .0494 |
The four most confident picks on the board all landed. The damage was done in the middle, between 64% and 76%, where five of the six misses sit. There is one pattern in the misses worth naming and then immediately discounting: all six were picks of the home team, all three road picks won, and road teams went 9–5 on the slate. The engine gives the home team 48 Elo points, a constant this site has already flagged as fitted on an older era.
I am not going to tell you Sunday is evidence for that. Three road picks is three. A week ago the same engine watched road teams go 6–16 across week one, and nobody wrote that up as proof the home-field constant was too small. Two weeks of a season point in opposite directions because two weeks of a season are noise, and the correct response to a pattern that reverses itself in seven days is to keep the constant and keep counting.
The Model Cannot Buy a Better Score by Being Braver
If the objection is that the engine is too timid — that it hedges at 65% when it should be saying 80% — that objection is testable, and it fails. Take every probability the model issued, convert it to log-odds, multiply by a constant, convert back. That is the standard way to make a forecaster more confident without changing which side it picks or the order of its convictions. Then re-score it.
| Log-odds multiplied by | Brier, 2010–2025 | Brier, 2026 so far |
|---|---|---|
| 1.00 — the engine as it ships | .2210 | .2364 |
| 1.25 | .2231 | .2405 |
| 1.50 | .2268 | .2461 |
| 2.00 | .2361 | .2595 |
Monotone worse in both samples, and at a stretch of 2.00 the sixteen-year score has given up almost everything it had over a coin flip. The engine is already sitting at the confidence level its knowledge supports. The timidity is not a bug to be tuned out; it is an accurate report of how much an Elo rating built from scores alone can tell you about a football game.
Sixteen Openings Say This One Is Ordinary
The right panel takes the first thirty-one decided games of every season since 2010 — the exact window this season is standing in — and scores each one. The sixteen prior openings average .2220 with a standard deviation of .0196, and they run from .1747 in 2020 to .2487 in 2021. This season's .2364 is the fifth-worst of seventeen; four prior openings were at least as bad.
The point is the spread, not the rank. The same unchanged engine, judged on thirty-one games, has produced scores .074 apart. The gap this Sunday is being asked to explain is .0144 against the mean — less than one standard deviation, and a fifth of the range the model generates by doing nothing differently. Accuracy tells the same story: 61.3% this year, against openings that have ranged from 51.6% to 77.4%.
There is a version of this page that runs the other way. If the 2026 reliability term were, say, .02 rather than .00104 — if the 70% band had gone 3 for 10 instead of 7 for 10 — then two weeks would still not prove anything, but it would be the sort of miss that justifies pulling the constants out and looking at them. That is not what happened. What happened is that a model with almost no resolution had a bad fortnight on the uncertainty term, which is the term it does not control.
Worked Through: Baltimore, and What .5700 Actually Cost
The worst game on the board. The ledger had Baltimore at 75.5% to beat New Orleans at home; New Orleans won 24–17. The Brier contribution is the squared error on the home side:
p_home = 0.7550        outcome = 0 (the home team lost)
brier  = (0.7550 - 0)^2 = 0.5700

Sunday's mean over 14 games         = 0.2580
the same 14 games without Baltimore = (0.2580*14 - 0.5700) / 13 = 0.2340
One game, and the slate goes from .2580 to .2340 — from clearly worse than a coin flip to clearly better than one. That is the whole argument against reading a fourteen-game Brier as a verdict, in one line of arithmetic. The season figure moves too: drop Baltimore and the thirty-one games score .2253 rather than .2364, which would move this opening from the fifth-worst of seventeen to the tenth.
I am not dropping it. The game counts, the pick was wrong, and 75.5% on a team that loses at home is exactly the kind of error a well-calibrated forecaster makes about a quarter of the time at that price. The point of the arithmetic is the sensitivity, not an excuse.
What This Page Does Not Show
Thirty-one games is not a sample. Every 2026 figure here carries a standard error wide enough to swallow the differences being discussed. The season reliability of .00104 against the historical .00032 is not a finding; at this sample size those are the same number. I am reporting the decomposition to show which term moved, not to claim the terms are now known.
The Monday game is not in any figure. The New York Giants at the Rams kicks off after this page is published. Thirty-one games, not thirty-two, everywhere — including the .2364.
Low resolution is not a defence of the engine. It is the criticism. A forecaster can be perfectly honest and nearly useless at the same time, and on the evidence here this one is closer to that than its 64.7% career accuracy makes it sound. Accuracy flatters a favourite-picker; resolution does not.
The three-band split is a choice. Reliability and resolution both depend on how the bands are cut, and a decomposition on binned forecasts does not reconstitute the Brier score exactly — the residual here is .0029 for 2026 and .0004 for the replay, the within-band variance the bands throw away. Finer bands would push reliability up and the residual down on any finite sample. I used the same three cuts on both samples so the comparison is like for like.
Nothing here is a betting claim. The ledger prices sides, not markets, and no closing line appears on this page.
Method and Sources
Two datasets, kept apart on purpose. The history is the June 2026 nflverse bundle (/data/games.csv, served at /data/games.csv), replayed game by game through explainer_src/nfl_elo.py with 1999–2009 as burn-in and 2010–2025 graded: 4,350 decided games. That file is never rewritten by a data refresh and its 2026 rows are schedule-only, so every historical figure here is reproducible unchanged. The 2026 side is the published ledger itself (static/data/predictions.json) — the pre-registered probability for each game, graded against the final score — pinned into _honest_not_sharp_2026-09-21.json at capture time, because the site build republishes the June bundle over the served scores and Monday's game will move the live scoreboard.
p    = probability the ledger put on the side it picked
y    = 1 if that side won
band = [.50,.60)  [.60,.70)  [.70,1]

brier       = mean( (p - y)^2 )
reliability = sum_b n_b * (mean p in b - mean y in b)^2 / N
resolution  = sum_b n_b * (mean y in b - mean y)^2     / N
uncertainty = mean y * (1 - mean y)

stretch(p, k) = logistic( k * log(p / (1-p)) )      # k = 1.00 is the shipped model
The harness is explainer_src/make_honest_not_sharp_chart.py. It asserts the pin's size and the absence of the Monday game, then re-derives every stored pick, correctness flag and Brier value in all thirty-one ledger rows from the raw scores; the replay's game count and its terminal season; both decompositions against the published backtest's Brier and accuracy; the identity that a constant base-rate forecaster scores exactly the uncertainty term, and both margins over it; the full log-odds sweep with its monotonicity in both samples; all seventeen opening windows at exactly thirty-one games each with their mean, standard deviation, range and rank; Sunday's record, Brier, the seventeen-game figure it replaced and the move between them; the six misses and their common side, the three road picks, the road-team record, the best and worst single games; Sunday's own reliability term against the season's; and this page's own figures and every internal link target: 183 assertions, all green as of September 21, 2026.
Sources: the nflverse public game log (games.csv). The score is Glenn Brier's, from Verification of Forecasts Expressed in Terms of Probability, Monthly Weather Review (1950); the three-way split is Allan Murphy's, from A New Vector Partition of the Probability Score, Journal of Applied Meteorology (1973). The rating method is Arpad Elo's, from The Rating of Chessplayers, Past and Present (1978).
Further reading
- Where the Overconfidence Is Not — the calibration claim this Sunday was the first live test of
- Nine of Thirteen: Sunday, Graded — the same exercise a week earlier, on a slate that graded at break-even
- Our Prediction Model, Fully Stated — the engine, its four constants, and the backtest this harness reproduces
- The Model Gets Louder, Not Smarter — the same replay cut by week, and the clearest prior statement of the resolution problem
- The Constants Nobody Tuned — including the 48-point home-field figure Sunday's misses all leaned on
- The Playoff Odds Were Too Confident — the same decomposition applied where it did find a real defect
- The First Miss: San Francisco 27, Rams 7, Graded — what one miss cannot prove, at n = 1
- The Week-2 Line Moves Just Enough — the market's version of refusing to overreact to a fortnight
- What a Blowout Is Worth to a Rating — the update rule that produced Sunday's rating moves
- The Prediction Ledger — every pick graded on this page, with its locked date
- Power Rankings — the ratings Sunday moved
Go deeper
Want the code behind these metrics? Work through the 45-chapter NFL analytics tutorial.
Browse tutorials Free tools