Four of the Sixteen Are One Week From Turning Over
Earlier today this site repriced the week-3 board against the August one and found that 32 games of football had moved every rating and flipped none of the sixteen picks. That is a fact about what happened. It leaves the more useful question unasked: what would it take?
That one has an exact answer, because the pick is a threshold and the threshold has a location. This model picks the home side when the home rating plus the 48-point home-field constant exceeds the away rating, so the distance from any pick to its flip is simply the size of that gap.
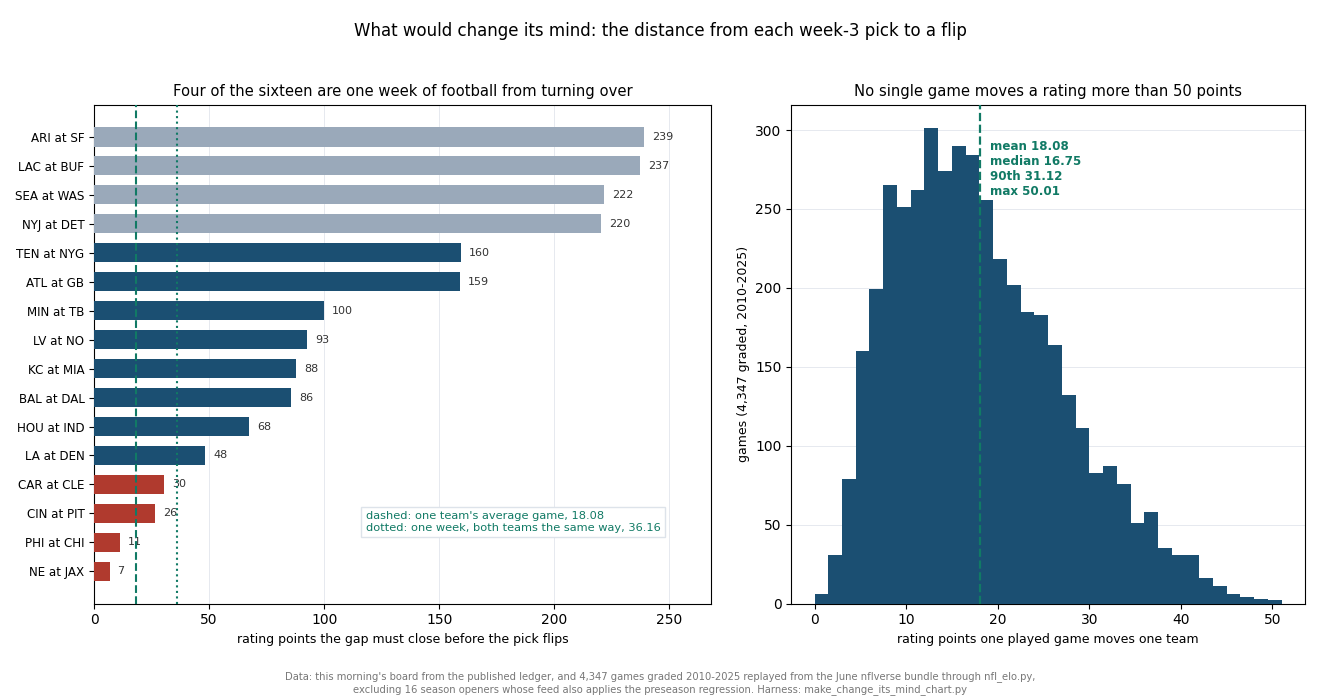
Measured on this morning's board, the sixteen distances run from 6.7 rating points to 238.9. Against them, one played game moves a team's rating by a mean of 18.08 points, across the 4,347 games this engine has graded since 2010. So New England at Jacksonville is closer to flipping than a single average game is wide, and Arizona at San Francisco is about six and a half weeks of football away from it.
The stubbornness that page measured is not a property of the model. It is a property of each game, it varies by a factor of thirty-six across one slate, and it is knowable in advance.
The Exhibit
What a Game Is Actually Worth
The distances only mean something against a unit, so start with the unit. Replay the engine over every graded game since 2010 and record how far each one moved the home team's rating:
| One played game moves one team's rating by | Points |
|---|---|
| Median | 16.75 |
| Mean | 18.08 |
| 90th percentile | 31.12 |
| Largest in 4,347 games | 50.01 |
Two things about that distribution matter here. It has a hard ceiling — nothing in sixteen years moved a rating more than 50.01 points, because K is 20 and the margin multiplier is bounded in practice — and the update is exactly zero-sum. The harness checks that directly: across all 4,347 games the worst case of the winner's gain plus the loser's loss is 0.000000000.
Zero-sum is what turns a single-team figure into a fixture figure. If both teams in a week-3 game play this weekend and both move the average amount in the helpful direction, the gap between them closes by about 36.16. That is the most a normal week can do, and it is a generous most: it assumes both results break the same way, which is roughly a one-in-four proposition.
The Sixteen, by How Far They Have to Go
| Game | Pick | Price | Points to a flip | Aligned weeks |
|---|---|---|---|---|
| New England at Jacksonville | Jacksonville | 50.96% | 6.7 | 0.19 |
| Philadelphia at Chicago | Philadelphia | 48.37% | 11.3 | 0.31 |
| Cincinnati at Pittsburgh | Pittsburgh | 53.81% | 26.5 | 0.73 |
| Carolina at Cleveland | Cleveland | 54.36% | 30.4 | 0.84 |
| the Rams at Denver | Denver | 56.92% | 48.4 | 1.34 |
| Houston at Indianapolis | Houston | 40.41% | 67.5 | 1.87 |
| Baltimore at Dallas | Baltimore | 37.90% | 85.8 | 2.37 |
| Kansas City at Miami | Kansas City | 37.64% | 87.7 | 2.43 |
| Las Vegas at New Orleans | New Orleans | 63.02% | 92.6 | 2.56 |
| Minnesota at Tampa Bay | Minnesota | 35.99% | 100.0 | 2.77 |
| Atlanta at Green Bay | Green Bay | 71.40% | 158.9 | 4.39 |
| Tennessee at the Giants | the Giants | 71.47% | 159.5 | 4.41 |
| the Jets at Detroit | Detroit | 78.04% | 220.3 | 6.09 |
| Seattle at Washington | Seattle | 21.81% | 221.8 | 6.13 |
| the Chargers at Buffalo | Buffalo | 79.68% | 237.4 | 6.56 |
| Arizona at San Francisco | San Francisco | 79.82% | 238.9 | 6.61 |
The median distance is 90.15 points — two and a half aligned weeks, or in practice most of a month of ordinary football. Two picks sit inside a single team's average game. Four sit inside one aligned week. Four are more than five weeks away.
The shading in the table is the honest reading of the board. The four highlighted rows are the games where the model is, for practical purposes, guessing: it has an opinion, the opinion is worth something, and one result either way would erase it. The four at the bottom are games where nothing short of a September that reverses itself will move the pick.
Worked Through: New England at Jacksonville
The closest call on the board, in full.
this morning   JAX 1562.8   NE 1604.1

Jacksonville hosts, so the home side is credited with HFA = 48:
  gap = (1562.8 + 48) - 1604.1 = +6.7   ->  p_home = 0.5096   ->  pick JAX

For the pick to become New England, that 6.7 has to vanish. One average
game moves one team 18.08 points, so this is 0.19 of a week's movement -
less than half of one ordinary result, on one of the two teams.
A 50.96% pick is not a claim that Jacksonville will win. It is a claim that Jacksonville is 6.7 rating points better than New England once the venue is paid for, and 6.7 points is inside the noise of a single Sunday. If either team had played one game differently a fortnight ago, this line would read the other way, and the model would be equally content.
This is the case for reading the probability rather than the pick, which is the argument the grading note made from the other end. A 50.96% and a 79.82% are both "picks" on the same ledger, and they are not remotely the same statement.
What This Page Does Not Show
"Aligned weeks" is a best case, not a forecast. The column divides the distance by 36.16, which assumes both teams move the average amount in the same helpful direction in the same week. Real movement is not aligned: one team wins while the other also wins, the two moves partly cancel, and the gap barely changes. Treat the column as a lower bound on how long a flip would take, not an estimate of it.
The distances are live and will not survive the weekend. They are measured on this morning's board. Week 3 starts grading on Thursday, and every one of these numbers will be different by Monday — which is the point of publishing them with a date attached rather than as a standing fact.
A flip is not an improvement. Nothing here says a flipped pick would be a better pick. A game 6.7 points from the line is a game the model does not know the answer to; moving it across the line does not change that, it changes which side of a coin flip gets written down.
One measurement trap, recorded. The engine applies its preseason regression lazily, inside the first update of a new season, so measuring a single game's move across a season boundary picks up the entire regression as well: that reports moves above 130 points and makes the update look like it is not zero-sum. Excluding the 16 season openers gives a true maximum of 50.01 and a zero-sum check that passes exactly. The same trap corrupted the first draft of this morning's page, in a different place.
Method and Sources
Two sources. This morning's board and the sixteen fixtures come from the pin this morning's page captured (_two_weeks_bought_2026-09-22.json), which holds the published ledger's own ratings and prices, so the two pages cannot drift apart. The move distribution is the June nflverse bundle (/data/games.csv, served at /data/games.csv) replayed through explainer_src/nfl_elo.py for 2010–2025; its 2026 rows are schedule-only.
distance to a flip = |(r_home + HFA) - r_away|        HFA = 48, 0 at a neutral site

one game's move:  replay every graded game, record |rating after - rating before|
                  for the home side, SKIPPING each season's first game, whose feed
                  also applies the 1/3 preseason regression
zero-sum check:   max |home move + away move| over the same games  ->  0.000000000
aligned week   =  2 x mean single-team move  =  36.16
The harness is explainer_src/make_change_its_mind_chart.py. It asserts the pin's capture date and shape and the 48-point constant; that the rating gap reproduces the ledger's own price for all sixteen games and that its sign agrees with each pick; the closest, second-closest and widest games with their distances; the count of games measured and of season openers excluded; the exact zero-sum result; the mean, median, 90th percentile and maximum single-game move; the derived aligned-week figure; both extreme week counts; the median distance; and the counts inside one average game, inside one aligned week, and beyond five weeks, with the four teams in that last group: 127 assertions, all green as of September 22, 2026.
Sources: the nflverse public game log (games.csv). The rating method is Arpad Elo's, from The Rating of Chessplayers, Past and Present (1978); K, the home-field constant and the margin multiplier are this site's own and are stated in full in the prediction-model page below.
Further reading
- What a Fortnight Bought — the page this one answers, and the pin both share
- What One Game Moves — the update rule behind the 18.08, worked game by game
- What a Blowout Is Worth to a Rating — why the move distribution has a ceiling at all
- A Worse Score Is Not a Worse Model — the case for reading the probability instead of the pick
- The Constants Nobody Tuned — including the 48 that sets every distance on this page
- Home Field Advantage — what that 48 is supposed to represent
- The Week-2 Line Moves Just Enough — the market revising by about the same amount
- Our Prediction Model, Fully Stated — the engine and its four constants
- The Prediction Ledger — the week-3 board with every price and lock date
- Power Rankings — the ratings these distances are measured on
Go deeper
Want the code behind these metrics? Work through the 45-chapter NFL analytics tutorial.
Browse tutorials Free tools