Thirty-Two Games Moved Every Rating and Changed No Minds
The week-3 board locked this morning, and it is the first 2026 board this model has built on ratings that have actually seen football. Week 1 was locked on August 12 and week 2 on September 15; both were priced, in effect, off a preseason board. Week 3 was priced today, after 32 games.
That makes a clean experiment available, and it is one this site can run on itself. The sixteen week-3 fixtures are fixed. Price them with the frozen August ratings, price them again with this morning's, and the difference is exactly what a fortnight of football bought.
The ratings moved a great deal. The mean team moved 27.15 Elo points, Las Vegas rose 65.1 and the Chargers fell 69.4. The board moved much less: the sixteen probabilities shifted a mean of 4.91 points, the largest of them 12.20. And the decisions did not move at all. Not one of the sixteen picks changed side.
My position on this page is the deflationary one, and it needs the control to be worth anything: that result is not remarkable. Replayed across 2010–2025, the same exercise flips a mean of 1.44 picks out of sixteen, and three of those sixteen seasons flipped none at all. Two weeks of football has never changed many minds. It did not this year either.
The Exhibit
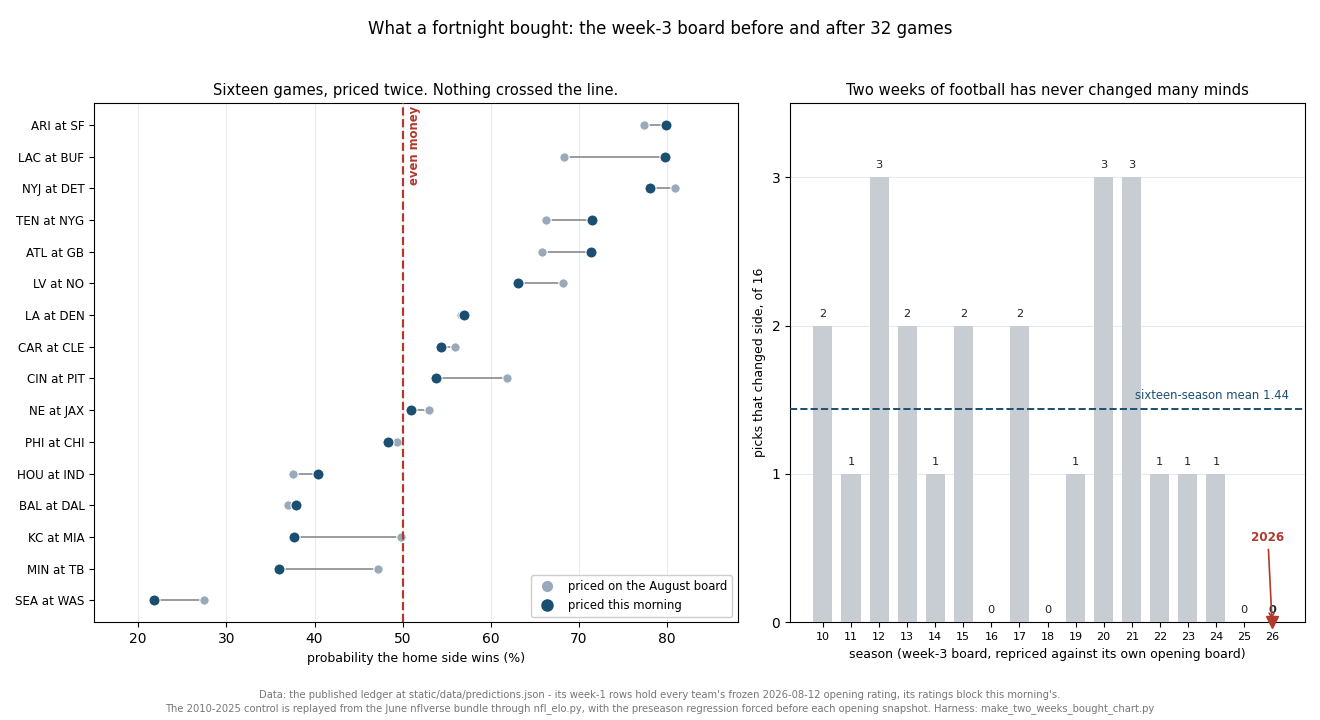
The Sixteen, Both Ways
Sorted by how much the fortnight moved them. The pick column is the ledger's own, taken from this morning's price.
| Game | August board | This morning | Shift | Pick |
|---|---|---|---|---|
| Kansas City at Miami | 49.84% | 37.64% | −12.20 | Kansas City |
| the Chargers at Buffalo | 68.26% | 79.68% | +11.43 | Buffalo |
| Minnesota at Tampa Bay | 47.17% | 35.99% | −11.17 | Minnesota |
| Cincinnati at Pittsburgh | 61.80% | 53.81% | −8.00 | Pittsburgh |
| Seattle at Washington | 27.50% | 21.81% | −5.69 | Seattle |
| Atlanta at Green Bay | 65.79% | 71.40% | +5.61 | Green Bay |
| Tennessee at the Giants | 66.29% | 71.47% | +5.17 | the Giants |
| Las Vegas at New Orleans | 68.17% | 63.02% | −5.15 | New Orleans |
| Houston at Indianapolis | 37.57% | 40.41% | +2.83 | Houston |
| the Jets at Detroit | 80.87% | 78.04% | −2.82 | Detroit |
| Arizona at San Francisco | 77.31% | 79.82% | +2.51 | San Francisco |
| New England at Jacksonville | 53.03% | 50.96% | −2.07 | Jacksonville |
| Carolina at Cleveland | 55.96% | 54.36% | −1.59 | Cleveland |
| Philadelphia at Chicago | 49.35% | 48.37% | −0.98 | Philadelphia |
| Baltimore at Dallas | 36.97% | 37.90% | +0.93 | Baltimore |
| the Rams at Denver | 56.57% | 56.92% | +0.35 | Denver |
Three of the sixteen moved less than a point. The three biggest movers are the three you would guess from the standings, and even the biggest of them — Kansas City at Miami, from a coin flip to 37.6% — did not change who the model would pick, because Kansas City were the road favourite before and are the road favourite now, just by more.
That is the shape of the whole thing. A probability can move twelve points without the pick moving at all, because the pick only cares about one threshold and the probability cares about the whole line.
The Board Got Louder
One thing did change direction, and it is the thing this site has written about before. Measure conviction as the distance from even money, |p − 0.5|, averaged over the sixteen games. On the August board it was .1285. This morning it is .1484.
The board is more confident about the same sixteen games than it was six weeks ago, by about two points per game. It is not more accurate — nothing about the fixtures has changed and no additional game has been played between the two prices — it is simply that the ratings have spread out. The standard deviation of the 32 ratings went from 83.22 to 87.51 over the same window.
That is the mechanism behind a finding this site published on September 5: across sixteen seasons the model gains 4.0 points of confidence between September and January and only 2.9 points of accuracy. Here is the first fortnight of that curve, measured live. Confidence arrives first.
And again, it is ordinary. Conviction rose over the same window in 12 of the 16 control seasons, by a mean of .0078; three of them raised it by more than 2026 has. The rating spread widened in 16 of 16, by a mean of 6.21 points against this year's 4.29. The preseason regression pulls every rating a third of the way to the mean in August, and the season immediately starts pulling them back apart. Two weeks in, that is most of what has happened.
What the Control Actually Says
| Over the opening-board to week-3-board window | 2010–2025 | 2026 |
|---|---|---|
| Picks that changed side, of 16 | 1.44 mean, range 0–3 | 0 |
| Seasons with no flip at all | 3 of 16 | — |
| Mean probability shift | .0428 | .0491 |
| Conviction change | +.0078, up in 12 of 16 | +.0198 |
| Rating spread change | +6.21, wider in 16 of 16 | +4.29 |
2026 is above average on the size of the moves and below average on the number of decisions they changed, and both of those sit comfortably inside sixteen years of range. There is no story here about this season being unusual, and I looked for one.
The number I would actually keep is the first row. Across seventeen seasons, two weeks of football changes about one and a half picks out of sixteen. That is roughly 9% of a slate. Everything else — the injuries, the narratives, the weekly power-ranking arrows, the team that everyone has decided is different now — is being absorbed by a model that, on the evidence, revises its actual choices about one game in eleven.
Worked Through: Kansas City at Miami
The largest move on the board, in full, because it shows why a big shift and a stable pick are not in tension.
August board     KC 1508.2   MIA 1459.1      gap +49.1 to KC
this morning     KC 1551.0   MIA 1415.3      gap +135.7 to KC

Miami hosts, so the home side gets HFA = 48 added before the comparison:
  August:   1459.1 + 48 - 1508.2  =  -1.1   ->  p_home = 0.4984
  today:    1415.3 + 48 - 1551.0  = -87.7   ->  p_home = 0.3764

p_home = 1 / (1 + 10 ^ (-(r_home + 48 - r_away) / 400))
Kansas City gained 42.8 points and Miami lost 43.8, so the gap between them widened by 86.6 — from a rating difference the home-field constant almost exactly cancelled, to one it cannot. The probability moved 12.2 points. The pick was Kansas City on both boards, because on both boards Kansas City were the better team by more than 48 points of home field, or by just barely less than it.
That "just barely" is the whole point. In August this was the closest game on the board at 49.84% — sixteen hundredths of a point from being a Miami pick. A fortnight of football turned a game the model could not call into one it calls at nearly two to one, and the pick on the ticket reads the same either way.
What This Page Does Not Show
This is not a claim that the ratings are useless. It is a claim about a threshold. A pick is a binary read of a continuous number, and binary reads are insensitive by construction. The probabilities moved a mean of 4.91 points, and a forecaster graded on Brier — which this one is — is paid for exactly that movement whether or not any pick changes.
The comparison is a repricing, not a backtest. Both prices are for games that have not been played. Nothing here says which board was better; the week-3 results will start answering that on Thursday, and only for sixteen games.
One methodological trap, recorded because it produced a wrong answer first. The engine applies its one-third preseason regression lazily, inside the season roll, on the first prediction or update of a new season. Snapshotting the ratings before the season's first game therefore captures the previous season's terminal board — a spread near 120 rather than near 80 — and comparing that against a post-regression 2026 board made this season look like the only one in sixteen where the fortnight raised conviction. It is not; conviction rose in twelve of sixteen. The harness now forces the roll before every snapshot and asserts that each control season's opening spread sits in the post-regression band.
Week 3 is not a full slate for everyone. The sixteen games here are the ones the ledger generated; bye weeks and scheduling mean a week-3 board is not the same set of teams every year, and the control compares each season against its own opening board rather than across seasons.
Method and Sources
Two sources, kept apart. The 2026 side is the published ledger (static/data/predictions.json): its week-1 rows carry every team's frozen opening rating as locked on 2026-08-12, and its ratings block carries this morning's, so both boards come from the site's own record rather than from a re-derivation. Pinned into _two_weeks_bought_2026-09-22.json because the ledger is rewritten on every build and week 3 begins grading on Thursday. The control is the June nflverse bundle (/data/games.csv, served at /data/games.csv), replayed through explainer_src/nfl_elo.py for 2010–2025; its 2026 rows are schedule-only, so no live result reaches a control figure.
for each season:
    opening = ratings AFTER the preseason regression, BEFORE the first game
              (force Engine._season_roll first - it is applied lazily)
    wk3     = ratings before any week-3 game is fed

    for each week-3 fixture:
        p_open = expected_home(opening[home], opening[away], neutral)
        p_now  = expected_home(wk3[home],     wk3[away],     neutral)
        flip   = (p_open >= .5) != (p_now >= .5)

    report: flips, mean |p_now - p_open|, mean |p - .5| both ways, rating SD both ways
The harness is explainer_src/make_two_weeks_bought_chart.py. It asserts the pin's three lock dates and the 32-of-48 scoreboard; both rating spreads and that the opening one sits in the post-regression band; the mean absolute rating move and the two extreme movers; that repricing with this morning's ratings reproduces the ledger's own probability for all sixteen games, and that each ledger pick is its own favourite; every row of the table above with its shift; the flip count, the mean and maximum shift, and both conviction figures; then the full sixteen-season control — its game counts, that every control opening board is post-regression, the mean and range of flips, the three zero-flip seasons, the mean shift, the twelve seasons that raised conviction and the three that raised it by more than 2026, and the sixteen that widened: 121 assertions, all green as of September 22, 2026.
Sources: the nflverse public game log (games.csv). The rating method is Arpad Elo's, from The Rating of Chessplayers, Past and Present (1978); the preseason regression and the home-field constant are this site's own, stated in full in the prediction-model page below.
Further reading
- The Model Gets Louder, Not Smarter — the sixteen-season curve whose first fortnight this page measures live
- A Worse Score Is Not a Worse Model — the same refusal to read a fortnight, argued from the Brier score instead
- The Pattern That Only Works Backwards — what happened to the one pattern in that fortnight worth chasing
- What One Game Moves — the update rule that produced these 27-point average moves, game by game
- The Offseason Haircut — the one-third regression that set the August board this page compares against
- Nobody Moved: The Rankings After the Opener — the same stability argument at n = 1
- The Week-2 Line Moves Just Enough — the market's version of revising this little
- Our Prediction Model, Fully Stated — the engine, its four constants, and the lock discipline behind the ledger
- The Prediction Ledger — the week-3 board itself, with every lock date
- Power Rankings — the ratings that moved 27 points on average
Go deeper
Want the code behind these metrics? Work through the 45-chapter NFL analytics tutorial.
Browse tutorials Free tools