The Standings Against the Price
Two of Sunday's 13:00 ET games put a 1-3 team in front of a 3-1 team. DraftKings has Washington by 3.5 over the Giants and the Jets by 2.5 over Cleveland, a vig-free .6038 and .5514 on ESPN's scoreboard at 08:54 ET this morning. In game five that has been rare. Since 1999 a 3-1 team has met a 1-3 team after four games 34 times, and the closing line favoured the 1-3 team twice: Philadelphia at Buffalo in 2011 and Buffalo at Cincinnati in 2017. Buffalo won the first by seven and Cincinnati the second by four. In the other 32 the 3-1 team was the favourite, and it won 24.
The four records are short and lopsided in the details. The Giants beat Dallas 28-20, Tennessee 12-7 and Arizona 36-24 and lost 28-6 at the Rams: three wins over teams now rated 24th, 32nd and 30th, and a point differential of +3. Washington lost 24-22 at Philadelphia and 37-20 at Dallas, beat Seattle 33-31 and lost 30-13 to Indianapolis in London last Sunday, for -34. Cleveland lost 34-10 at Jacksonville and then won three games by four, three and three points, for -14. The Jets won 23-10 at Tennessee and lost the next three by 3, 7 and 11, for -8.
The prediction ledger froze both games on October 6. It rates the Giants 40.9 points above Washington, and the 48-point home edge tips the game back to Washington at .5102, a coin flip, so the ledger agrees with the market on the favourite and is 9.4 points less sure. It rates Cleveland 90.7 points above the Jets and makes Cleveland a .5611 favourite on the road: on that game it picks the other side.
The Exhibit
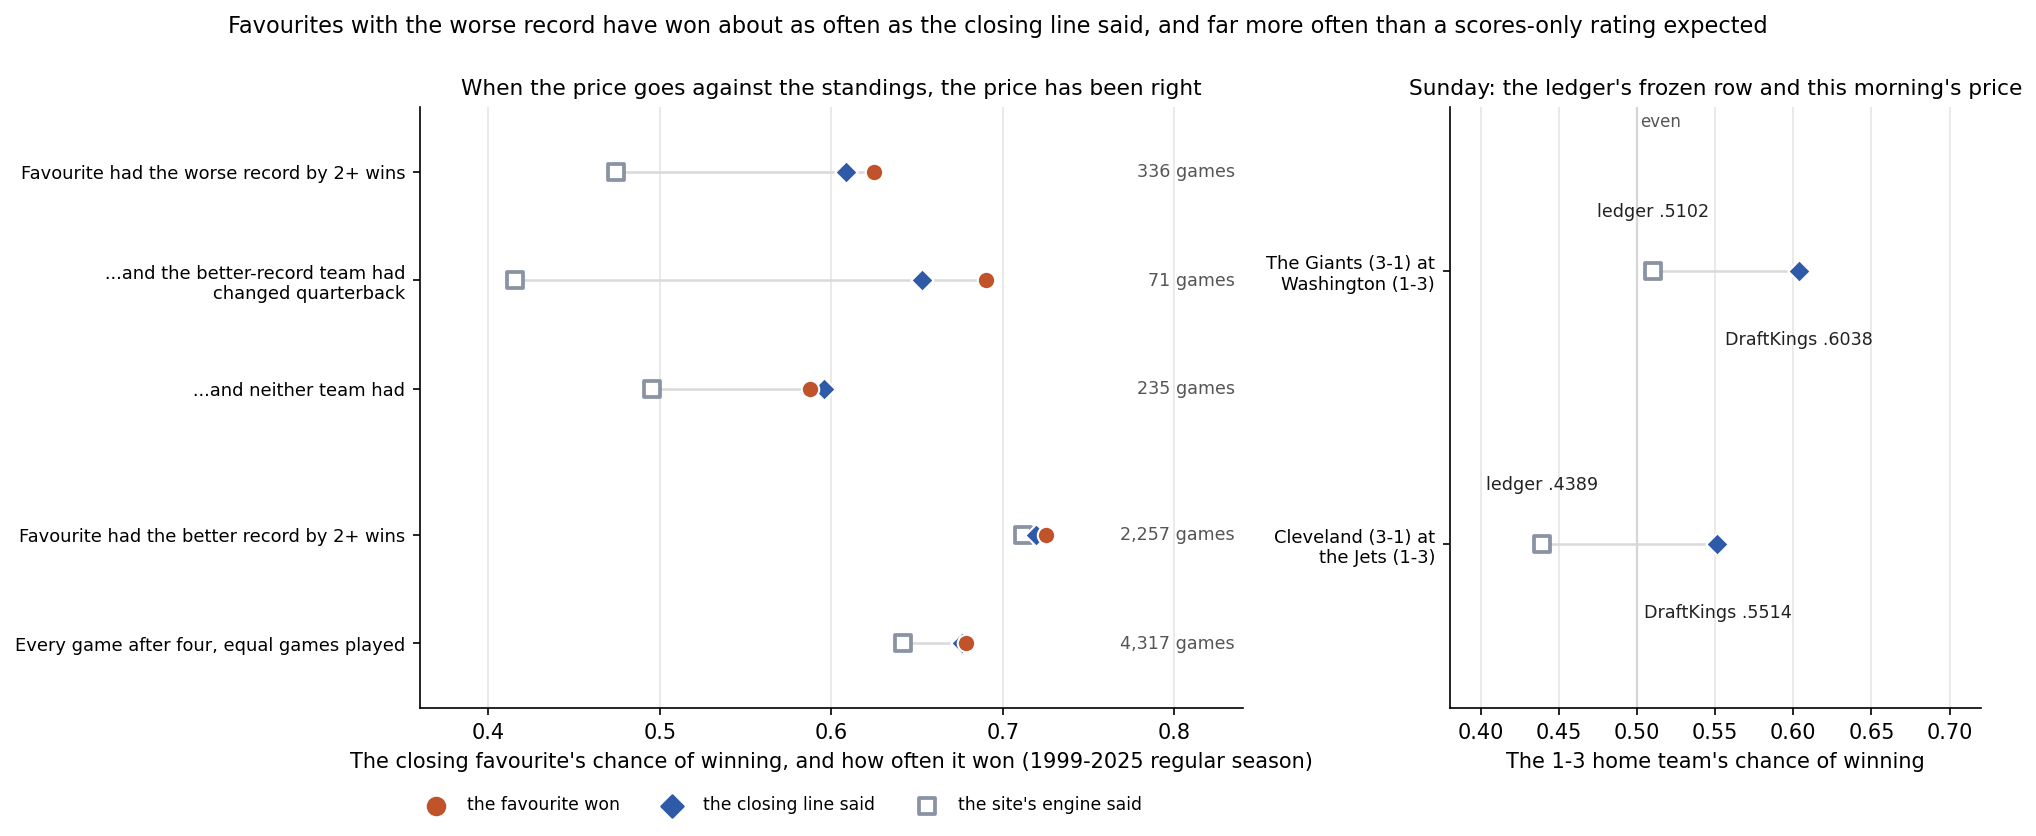
336 Games Where the Price Went Against the Standings
A favourite with the worse record is rare in week 5 only because the records are short. Over a season it is common enough to measure. Take every regular-season game from 1999 to 2025 in which both teams had played the same number of games, at least four, and the closing favourite had at least two fewer wins than the underdog, with a tie counted as half. There are 336: 13 in week 5 and 225 from week 12 on, and in 292 of them the favourite was at home. The favourites won 210 and lost 126, .625. The closing line, turned into a probability with the fit from What a 60% Pick Is Worth, gave them .608. Where the file carries a closing moneyline, from 2006, the 249 games' favourites won .610 against a vig-free .606. This site's engine, replayed walk-forward, gave them .474, and in 191 of the 336 it made the team with the better record the favourite.
| Games from the closing favourite's side | Games | Favourite won | The closing line | The engine | Brier, line | Brier, engine |
|---|---|---|---|---|---|---|
| Favourite had the worse record by 2+ wins | 336 | .625 | .608 | .474 | .2311 | .2713 |
| ... the better-record team had changed quarterback | 71 | .690 | .653 | .416 | .2040 | .3084 |
| ... neither team had | 235 | .587 | .596 | .495 | .2415 | .2575 |
| Favourite had the better record by 2+ wins | 2,257 | .725 | .719 | .712 | .1878 | .1933 |
| Every game after four, equal games played | 4,317 | .678 | .676 | .642 | .2079 | .2180 |
The two quarterback rows leave out the 30 games in which the favourite had changed quarterback, 24 of them alone and 6 with the other team. A change means a team started a different quarterback, by the file's player id, from the one who started its previous game that season.
Against the standings the line has been right. The favourites' results sat .017 above its number, 0.6 standard errors, and .151 above the engine's, 5.5 standard errors. Against the spread they were level, +0.06 points a game with a standard error of 0.74, covering 51.4% of the 329 games that were not pushes, so there was nothing in these games for a bettor to collect. There was a lot for a forecaster that reads only scores to lose. When the favourite had the better record the engine finished within .013 of the results; when it had the worse record, .151 short. In the 191 games in which the engine picked the better record, the line's side won .649; in the 39 of those in which the two were less than ten points apart, it won 26.
What the Price Knew
The underdogs in these games had the better record and usually the better scoreboard too: in 288 of the 336 their point differential was higher, on average +35.4 before kickoff against the favourites' -13.5. A rating built from scores sides with them. The line did not, and the results backed the line.
The file names one reason. In 77 of the 336 games the team with the better record started a different quarterback from the one who started its previous game, 22.9% of the games, against 10.7% of all team-games after a team's fourth game. In the 71 in which only that team had changed, the favourites won .690, the line said .653 and the engine .416. The Model Cannot See a Quarterback Change measured that blind spot across sixteen seasons; this class is one of the places it gathers. It is not the whole story. In the 235 games in which neither team had changed quarterback the line still read the results better, .596 against .587 that happened, with the engine at .495. What the line knew in those games the file does not record: injuries elsewhere on the roster, the schedule behind each record, or a view of the teams from before the season, and the favourite was the higher-rated team on the engine's August board in 202 of the 336. This page does not separate them.
0-4 and Still 14th found that a team's record adds nothing to the engine's forecast for the rest of a season once the engine's rating has moved. Against the price the record has added nothing measurable either: favourites with the better record by two or more wins finished .006 above the line's number and those with the worse record .017 above, both inside one standard error. Where the price goes against the record, the engine has been the one left behind.
Sunday's Two
| Game | Records | Point differential | The ledger, host | DraftKings, Saturday 08:54 ET, host |
|---|---|---|---|---|
| The Giants at Washington | 3-1 / 1-3 | +3 / -34 | .5102 | .6038 (Washington -3.5, -170 / +142) |
| Cleveland at the Jets | 3-1 / 1-3 | -14 / -8 | .4389 | .5514 (the Jets -2.5, -135 / +114) |
Records and point differentials visitor / host. DraftKings' prices are from ESPN's scoreboard at 08:54 ET on Saturday, October 10, a snapshot that will move before kickoff, not closing prices; moneylines are listed home / away, with the margin removed in proportion. The nflverse file carries the same lines this morning. Cleveland comes in on ten days' rest after its Thursday game of October 1; the other three teams on seven.
Washington is the common case. Of the 336 favourites, 292 were at home and 288 had the worse point differential, and Washington is both. The ledger's .5102 is a coin flip on scores; the price is 9.4 points surer, and the class says the price is the better guide. Since August the engine has moved the Giants from 28th to 20th and Washington from 24th to 27th, on the same four results the standings show.
The Jets are the rarer case: a favourite with the worse record but the better point differential, as in 45 of the 336. The engine has Cleveland 22nd and the Jets 31st and picks Cleveland, so this is also a game in which the two pick different winners. Week 5: Where the Ledger and the Market Disagree put the two 9.4 points apart on Thursday, in the group of disagreements that sixteen seasons had settled at a coin flip. The price has moved a point toward the Jets since, and the gap is 11.3 points this morning, which puts the game in that page's next group, where the market's side won 187 of 321. In this page's class the line's side won .649. Both lean to the price, not to the ledger's frozen number, which stands as written and will be graded after the game like every other row.
What This Page Does Not Show
- Sunday's starters. The page names no players and does not use the file's listed starters for games not yet played. Quarterback changes are counted only from the starting-quarterback ids of games already played.
- Why each price moved. Injuries, schedules and preseason views are all candidates; the file records none of them for these games, and the page does not try to separate them.
- A betting edge. Against the spread the class was level. The finding is about the engine, not about an angle on the line.
- Independent games. The 336 games include repeat teams within a season, and the standard errors treat each game as independent, which overstates their precision a little.
- A pure market number. Before 2006 the file has no closing moneyline, so the line's probability comes from the closing spread through the site's fit; from 2006 the moneylines give the same answer.
- Closing prices for Sunday. This morning's prices are a snapshot.
- Advice. The page compares forecasts with results. It recommends no wager and links to no sportsbook.
Method and Sources
class          = REG games 1999-2025, both teams equal games played (4+), closing favourite with 2+ fewer wins   # 336
line's chance  = 1 / (1 + exp(-(-0.0265 + 0.14262 x home closing spread)))                               # the fair-prices fit
engine         = walk-forward Elo with a 48-point home edge                                              # the ledger's model, replayed from 1999
qb change      = starting quarterback id differs from the team's previous game that season              # ids only, games already played
game five      = both teams 4 games in, one 3-1 and one 1-3                                              # 34 meetings since 1999
The script make_one_three_favourites_chart.py replays the engine over 1999-2025, rebuilds every team's record, point differential and previous starting quarterback before each regular-season game, finds the 34 game-five meetings and the 336 games of the class, grades the closing line and the engine on them and on the contrast classes, reads the ledger's two frozen rows and this morning's DraftKings prices, and asserts every number on this page.
Sources: the nflverse public game log (games.csv), 1999-2025 from the copy bundled in June, checked identical to a pull at 08:54 ET on October 10, 2026, which also supplies the 2026 results and lines; ESPN's week-5 scoreboard, pulled October 10, for DraftKings' prices; the site's prediction ledger after the October 9 build.
Further reading
- Three of the Top Six: The NFC West, Measured: today's companion, Sunday's other division story
- Week 5: Where the Ledger and the Market Disagree: every week-5 game against the market
- The Model Cannot See a Quarterback Change: the engine's largest blind spot, measured
- 0-4 and Still 14th: Is the Board Too Slow?: what a record adds to the engine
- The Week-2 Line Moves Just Enough: how the line reacts to a surprise
- What a 60% Pick Is Worth: The 2026 Openers at Fair Prices: the fit that turns a spread into a probability
- The Giants, Washington, Cleveland and Jets team pages, and the prediction ledger
Go deeper
Want the code behind these metrics? Work through the 43-chapter NFL analytics tutorial.
Browse tutorials Free tools