One of Them Leaves 0-5
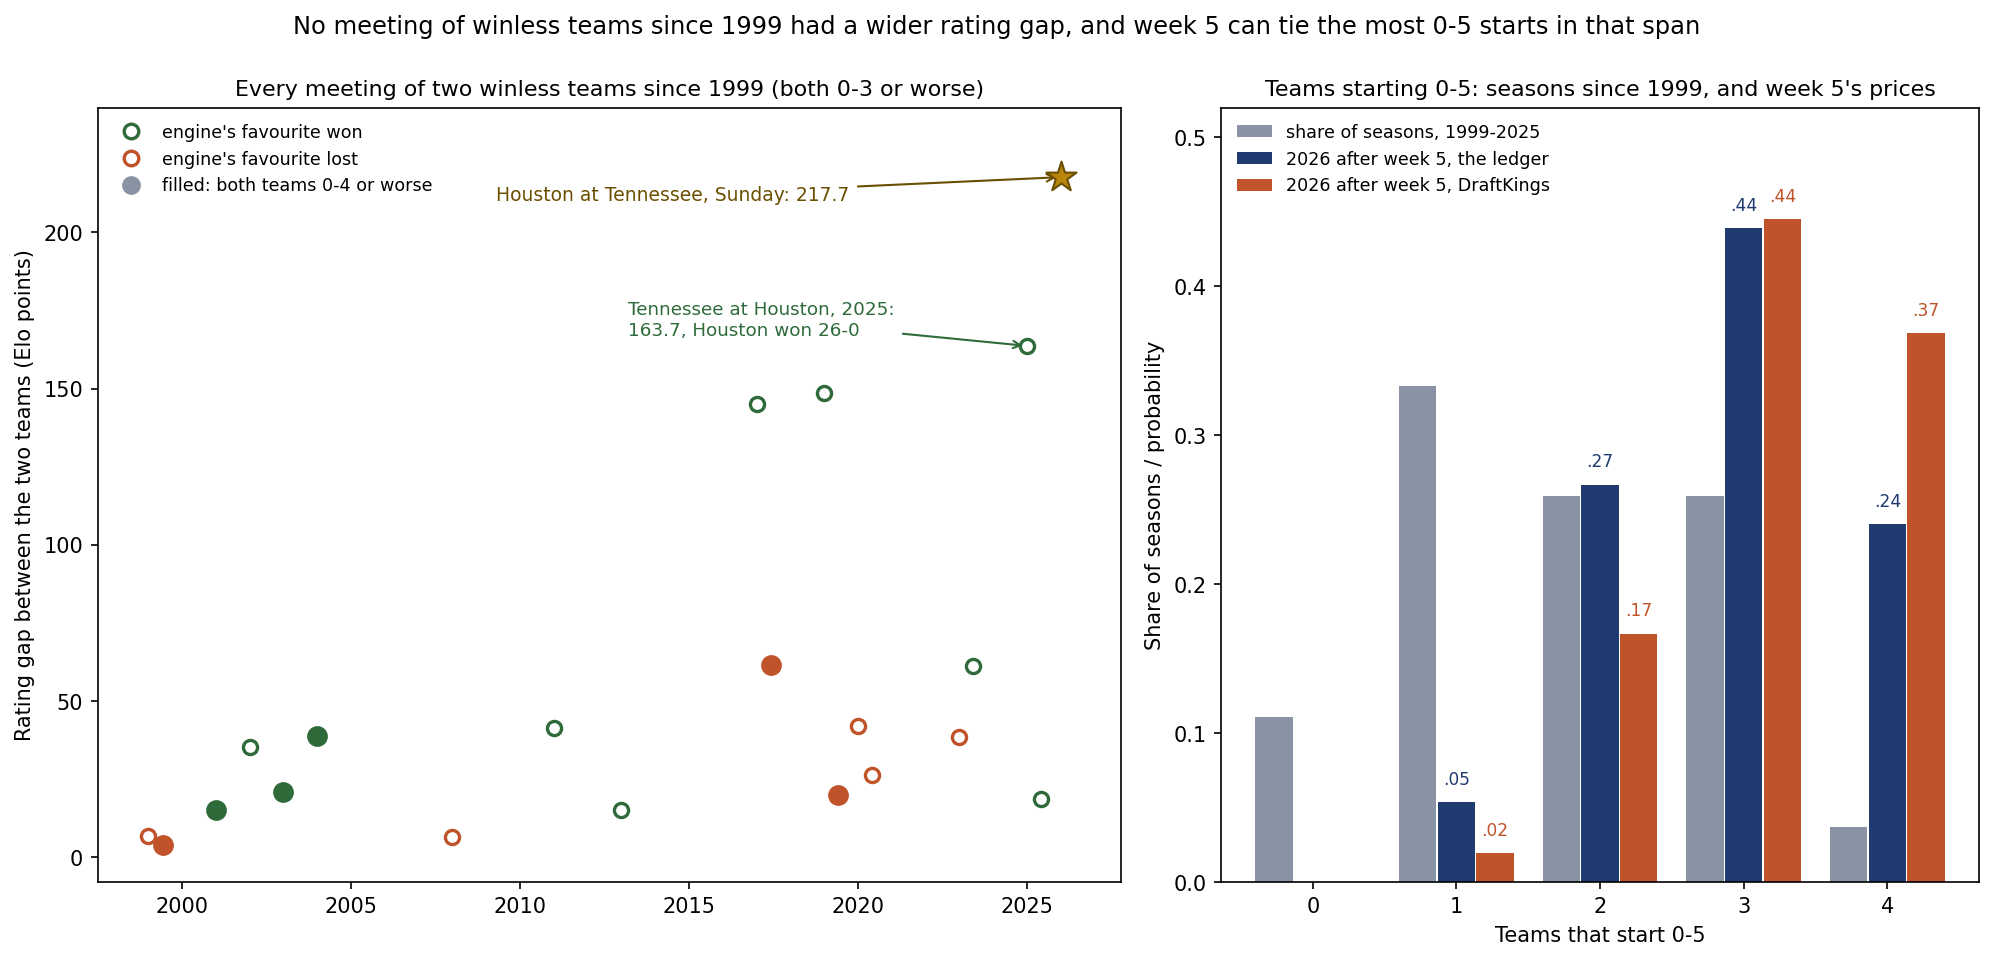
Houston and Tennessee are both 0-4, and they play at Nissan Stadium on Sunday, October 11, at 13:00 ET. The prediction ledger's row for the game, locked on October 6, has Houston at 1517.7, 14th on the board, and Tennessee at 1300.0, 32nd and 62.4 points below the Jets in 31st. That is a gap of 217.7 rating points, or 169.7 once Tennessee's 48-point home edge is added, and the ledger makes the visitor, an 0-4 team on the road, a .7265 favourite. DraftKings, as shown on ESPN's scoreboard at 10:07 ET on Tuesday, has Houston -7 at -340/+270, a vig-free .7409, 1.44 points higher, and the nflverse file carries the same prices. Unless the game ends in a tie, which has happened 15 times in 6,967 regular-season games since 1999, one of the two leaves Sunday at 0-5.
The records are identical, and this season's football nearly is. Houston has lost by 5, 14, 2 and 4 points, Tennessee by 13, 4, 5 and 6: point differentials of -25 and -28, with three one-score losses each. The 217.7 points come from August. Houston opened the season 5th at 1605.6 and Tennessee 32nd at 1349.8, 255.8 points apart, and four weeks of near-identical results have closed 38.1 of that. 0-4 and Still 14th found that the board leans on its August ratings more than sixteen seasons justify, and August is what this gap is made of.
The Exhibit
The Widest Meeting of Winless Teams
From 1999 to 2025 the nflverse file holds 19 regular-season games between two teams that were both winless with at least three losses and no ties. Sunday's gap is the widest of any of them, by 54.0 points. The previous high, 163.7, was the same pairing a year ago: Tennessee at Houston in week 4 of 2025, both teams 0-3. Houston was priced at .7718 at home, won 26-0, finished 12-5 and made the playoffs; Tennessee finished 3-14. Next come Cincinnati at Pittsburgh in 2019, at 148.6, and Cincinnati at Cleveland in 2017, at 145.0.
By price, Sunday is not the most one-sided of them, because last year's game was in Houston: .7718 is higher than .7265. But no winless team on the road had been priced above .6361, Cincinnati's number at Cleveland in 2017, before this week. Across the 19 games the engine's favourite won 11, against 11.03 expected from its own prices, which averaged .5806 for the favourite. Meetings of winless teams have gone about as the prices said, and only three of the 19 prices were above .65.
Teams that were both 0-4 or worse have met six times since 1999, four of them exactly 0-4 against 0-4. Sunday is the seventh such meeting and the first since 2019, and its gap is 3.5 times the widest of the six.
| Season | Game | Records | Rating gap | Engine's favourite | Result |
|---|---|---|---|---|---|
| 1999 | Cincinnati at Cleveland | 0-4 at 0-4 | 3.9 | Cleveland .563 | Cincinnati 18-17 |
| 2001 | Washington at Dallas | 0-4 at 0-4 | 15.1 | Dallas .547 | Dallas 9-7 |
| 2003 | The Chargers at Jacksonville | 0-4 at 0-4 | 20.8 | Jacksonville .598 | Jacksonville 27-21 |
| 2004 | Miami at Buffalo | 0-5 at 0-4 | 38.7 | Buffalo .513 | Buffalo 20-13 |
| 2017 | The Chargers at the Giants | 0-4 at 0-4 | 61.4 | The Giants .652 | The Chargers 27-22 |
| 2019 | Washington at Miami | 0-5 at 0-4 | 19.7 | Miami .541 | Washington 17-16 |
| 2026 | Houston at Tennessee | 0-4 at 0-4 | 217.7 | Houston .726 | Sunday, October 11 |
In those six the engine's favourite won three. The ratings were within 61.4 points in every one, so every price sat between .513 and .652. Sunday's game belongs to that list by its records and by nothing else.
What 0-4 Has Led To
From 1999 to 2025, 81 teams started 0-4. None made the playoffs, including the 12 since the field grew to fourteen teams in 2020. The 48 that also lost game five finished with 3.58 wins on average; the best of them won 8, Washington in 2001 and Tennessee twice, in 2006 and 2009. The 33 that won game five averaged 5.30 wins and none won more than 9, 1.72 wins more than the teams that went to 0-5, the game itself included.
So Sunday decides which of the two goes to 0-5. It does not decide which keeps a route to the playoffs that a team in the file has used, because from 0-4 none has. Houston is the only team in the file to reach the playoffs from 0-3, and it did so twice, as What 0-3 Means counted.
How Many 0-5 Teams Week 5 Can Leave
2026 already has five 0-4 teams, as many as any season since 1999 (1999, 2009 and 2019 also had five). The other three 0-4 teams are underdogs on both boards this week. On the ledger and on DraftKings respectively: Tampa Bay at Dallas on Thursday, .3595 and .2042, with Dallas -9.5; the Chargers at home to Denver, .3680 and .3775, with Denver -3.5; and Miami at home to Cincinnati, .4069 and .2559, with Cincinnati -7. Treating the games as independent, and counting the certain one from Sunday's meeting:
| Teams at 0-5 after week 5 | The ledger | DraftKings | Seasons with that many, 1999-2025 |
|---|---|---|---|
| 1 | .0538 | .0197 | 9 |
| 2 | .2668 | .1668 | 7 |
| 3 | .4393 | .4449 | 7 |
| 4 | .2401 | .3686 | 1 |
The ledger expects 2.87 teams at 0-5 after week 5 and DraftKings 3.16, against an average of 1.78 a season since 1999, a span in which three seasons had none. Three or more has a .6793 chance on the ledger and .8135 on DraftKings; 8 of the 27 seasons got there. Four, which would tie 2009 for the most in any season since 1999, is .2401 on the ledger and .3686 on DraftKings.
Those numbers are only as good as the prices on 0-4 teams, and history says the prices have been fair. In game five the 81 teams that started 0-4 were priced by the engine at .3735 on average and won .4074 of the time (SE .0546). In the 56 of those games with closing moneylines the market said .3603 and the teams won .3214. Both are within one standard error.
What This Page Does Not Show
- Rosters and quarterbacks. The engine reads final scores only. Where DraftKings is far more confident than the ledger, on Dallas and Cincinnati, the market may be pricing something the engine cannot see; a change at quarterback is one such thing, measured on this site.
- A verdict on Sunday. The ledger's .7265 is frozen and will be graded on the result. The DraftKings prices are a Tuesday-morning snapshot and will move before kickoff.
- Ties. Neither the ledger nor the market prices one; a tie on Sunday would leave both teams without a fifth loss and every count above one lower.
- A playoff forecast. The 81 seasons are history, not a model of 2026. After their fourth games only two of those teams, the 2002 Rams and the 2012 Saints, were rated as high as Houston's 1517.7; the median was 1404.0.
Method and Sources
winless meeting = a regular-season game in which both teams have 3+ losses, no wins and no ties    # 1999-2025
rating gap      = |home rating - away rating| before the game, walk-forward, no home edge
0-5 count       = 1 (Houston or Tennessee) + Bernoulli(TB loses) + Bernoulli(LAC loses) + Bernoulli(MIA loses)
playoffs        = a team-season with any postseason row in the same file
The script make_hou_ten_winless_chart.py replays the engine over 1999-2025 and the 64 games of 2026 final through Monday, checks its ratings against the ledger's published ones for all 32 teams, reproduces the frozen .7265, finds every winless meeting and every 0-4 start, reads the playoff field from the file's postseason rows, prices the week-5 count exactly from the ledger's frozen rows and from DraftKings, and asserts every number on this page.
Sources: the nflverse public game log (games.csv), 1999-2025 from the copy bundled in June and 2026 from a pull on October 6, 2026, whose 1999-2025 rows were checked identical; ESPN's week-5 scoreboard on October 6 for the venue and DraftKings' prices; the site's prediction ledger as published on October 6.
Further reading
- Is London a Jacksonville Home Game? The Price Says Yes: today's companion, on Sunday's London game
- 0-4 and Still 14th: Is the Board Too Slow?: why Houston is still rated above average
- Five Teams at 0-4: The September Forecast, Graded: how 2026 reached five 0-4 teams
- What 0-3 Means, and How Many 2026 Is About to Have: the same question one week earlier
- How Low Is 1314.6? Tennessee Against Sixteen Seasons: Tennessee's rating after two weeks
- The Streaks of the Century: the file's longest runs, and its 15 ties
- The Houston Texans and Tennessee Titans team pages, and the power rankings
Go deeper
Want the code behind these metrics? Work through the 43-chapter NFL analytics tutorial.
Browse tutorials Free tools