Last by 65 Points After Two Weeks
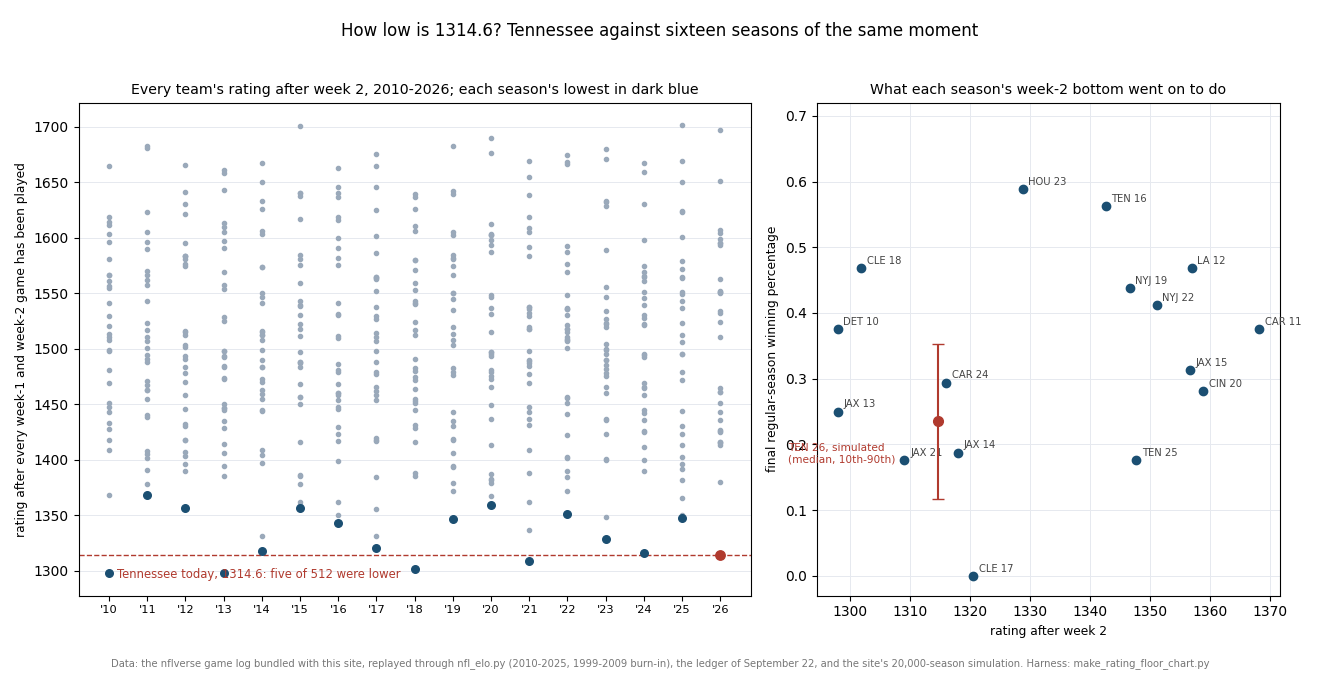
After two games, Tennessee is rated 1314.6 on the site's board. That is last in the league, and not narrowly: the Jets in thirty-first are 65.0 points higher, nearly twice the gap between the Jets and Atlanta in thirtieth (33.3). Seattle, at the top, is 382.2 points clear.
A rating is only a number until it is put beside other numbers from the same moment. So this page replays the whole bundled game log through the same engine that runs the prediction ledger, takes a snapshot of every team's rating at exactly this point in each season — after every week-1 and week-2 game has been played — and asks two questions. How rare is 1314.6? And what became of the teams that were down here before?
The short answers: rare but not unprecedented, since five team-seasons out of 512 were lower; and the teams at the bottom after two weeks mostly stayed near it, though not all of them, and one of sixteen reached the playoffs.
The Exhibit
How Tennessee Got Here
Tennessee finished 2025 last on the board as well, at 1272.1. Every preseason the engine pulls each rating a third of the way back toward 1505, which lifted Tennessee to 1349.8, the figure its week-1 ledger row was frozen at. Then came two home games:
| Week | Result in Nashville | Ledger's home price | Rating before | Rating cost |
|---|---|---|---|---|
| 1 | the Jets 23-10 | 0.5519 | 1349.8 | 28.7 |
| 2 | Philadelphia 24-20 | 0.2222 | 1321.1 | 6.5 |
The two losses cost very different amounts, and the difference is the whole logic of the model. In week 1 the ledger made Tennessee a .5519 favourite at home against the Jets and it lost by thirteen: an expected result reversed, by a wide margin, cost 28.7 points. In week 2 it was a .2222 underdog against Philadelphia and lost by four: a result the model already expected, by less than it expected, cost 6.5. A four-point home loss to one of the league's better teams is close to what a team rated in the 1320s is supposed to do.
So 1314.6 is not two disasters. It is one bad afternoon on top of a rating that was already the league's lowest in August, before a snap.
How Rare 1314.6 Is
The window is the engine's own graded one, 2010 to 2025; 1999 to 2009 is burn-in on every page here, because every team starts the replay at 1505 and the early ratings have not yet spread out. That gives sixteen seasons of 32 teams, 512 team-seasons, each snapshotted after its week-2 games. (Every team played 16 games through 2020 and 17 from 2021, except Buffalo and Cincinnati in 2022, whose game was cancelled; the harness checks that too.)
Those 512 week-2 ratings average 1505.0 with a standard deviation of 86.2. Tennessee is 2.21 standard deviations below the mean. Five of the 512 were lower:
| Season | Team | Rating after week 2 |
|---|---|---|
| 2010 | Detroit | 1297.9 |
| 2013 | Jacksonville | 1297.9 |
| 2010 | the Rams | 1299.1 |
| 2018 | Cleveland | 1301.8 |
| 2021 | Jacksonville | 1309.1 |
| 2026 | Tennessee | 1314.6 |
Added to the 512, Tennessee's rating is sixth-lowest of 513, the bottom 1.17 per cent. What is rarer than the level is the isolation: of the sixteen historical week-2 bottoms, only three stood 60 or more points below the next team up — Jacksonville in 2013 (87.9), Cleveland in 2018 (83.3) and Carolina in 2024 (74.0) — and Tennessee's 65.0 would rank fourth among the sixteen gaps.
What Became of the Sixteen
| Season | Lowest after week 2 | Rating | Gap to next | Final wins | Final board rank from bottom |
|---|---|---|---|---|---|
| 2010 | Detroit | 1297.9 | 1.2 | 6 of 16 | 9 |
| 2011 | Carolina | 1368.3 | 10.1 | 6 of 16 | 11 |
| 2012 | the Rams | 1357.0 | 33.3 | 7.5 of 16 | 10 |
| 2013 | Jacksonville | 1297.9 | 87.9 | 4 of 16 | 1 |
| 2014 | Jacksonville | 1318.0 | 13.4 | 3 of 16 | 2 |
| 2015 | Jacksonville | 1356.7 | 2.3 | 5 of 16 | 2 |
| 2016 | Tennessee | 1342.7 | 8.0 | 9 of 16 | 7 |
| 2017 | Cleveland | 1320.5 | 10.4 | 0 of 16 | 1 |
| 2018 | Cleveland | 1301.8 | 83.3 | 7.5 of 16 | 9 |
| 2019 | the Jets | 1346.7 | 25.1 | 7 of 16 | 11 |
| 2020 | Cincinnati | 1359.0 | 8.3 | 4.5 of 16 | 4 |
| 2021 | Jacksonville | 1309.1 | 27.4 | 3 of 17 | 1 |
| 2022 | the Jets | 1351.2 | 20.9 | 7 of 17 | 5 |
| 2023 | Houston | 1328.8 | 19.6 | 10 of 17, playoffs | 13 |
| 2024 | Carolina | 1316.0 | 74.0 | 5 of 17 | 2 |
| 2025 | Tennessee | 1347.7 | 2.3 | 3 of 17 | 1 |
Half-wins are ties. "Final board rank from bottom" is where the team's rating stood after its last regular-season game, 1 being the lowest in the league.
Four of the sixteen finished the season last on the board: Jacksonville in 2013 and 2021, Cleveland in 2017 and Tennessee itself in 2025. Seven finished in the bottom two and nine in the bottom five. Three finished with the league's fewest wins, ties included. As a group they won .335 of their games, the median .344, a little under six wins in a 17-game season.
Six climbed to ninth from the bottom or higher. Houston in 2023 is the outlier every study of this kind needs: last after two weeks at 1328.8, ten wins, a playoff win, and the thirteenth-lowest rating by the end. On average the sixteen finished 20.6 rating points higher than they stood after week 2, which is regression toward the middle doing exactly what it should.
The three isolated bottoms are the closest comparison to Tennessee now, and they split: Jacksonville 2013 finished last with four wins, Carolina 2024 second-last with five, and Cleveland 2018 went seven, eight and a tie to finish ninth from the bottom. Being alone at the bottom after two weeks is not a sentence. It is, two times in three, a fair description of the season ahead.
One more line from the table belongs to Tennessee: this is the second season running it has been last after week 2. Two other franchises have done that in the window: Cleveland in 2017 and 2018, and Jacksonville three years in a row, 2013 to 2015.
What the Simulation Says About the Rest of 2026
The history above is about teams that happened to be at the bottom. For Tennessee itself the better instrument is the site's 20,000-season simulation, which plays its fifteen remaining games from today's ratings with the two losses fixed.
Tennessee is the underdog in all fifteen. Its best price is 0.4105, at home to Cleveland in week 7; its worst is 0.1538 at Jacksonville. Summed, the fifteen probabilities come to 3.93 expected wins, and the simulation's mean agrees to within three hundredths. The middle eighty per cent of simulated seasons end with between two and six wins, median four.
In 46.8 per cent of simulated seasons Tennessee finishes with the fewest wins in the league, ties included, and in 27.5 per cent it is alone at the bottom. Nine wins, roughly what a wild card costs, happens in about half of one per cent — the same 0.5 per cent the week-3 leverage board gives Tennessee to make the playoffs.
That is a slightly kinder forecast than the history, and for a stated reason: the simulation holds Tennessee's rating fixed at 1314.6 for the rest of the year, while the sixteen historical bottoms show ratings this low drifting back up by about twenty points on average. The model's regression toward 1505 happens once a year, in August; within a season, a team's rating moves only when it plays.
What This Does Not Tell You
- Sixteen is a small number. Every rate on this page is a count out of sixteen seasons. "Seven of sixteen finished in the bottom two" could plausibly be five or nine in another sixteen.
- The model sees scores only. A quarterback change, an injury list or a coaching change is invisible to it until it shows up in results. The quarterback-change page measures what that costs.
- The simulation's ratings are frozen. As above, the fifteen-game forecast does not let Tennessee's rating move as results come in. A version that updated inside each simulated season would widen the spread of outcomes in both directions.
- Rating is not record. The 0-2 study covers what the record alone predicts; this page is about the rating, which also knows how the games were lost.
Related
- Week 3's Leverage Board — which week-3 results move the playoff picture, including why Tennessee's barely does.
- The 0-2 Hole Is Mostly the Two Games — what an 0-2 record predicts on its own.
- The margin multiplier — why a thirteen-point loss costs more than a four-point one.
- The engine's constants — K, home field and the one-third regression that set Tennessee's August rating.
- The Model Gets Louder, Not Smarter — how the board's confidence grows through a season.
- The prediction ledger — every frozen probability and its grade.
Reproducibility
Every figure here is computed by make_rating_floor_chart.py from the nflverse game log bundled with the site (data/games.csv), replayed through nfl_elo.py, and from the published ledger as updated September 22. Written September 23, 2026, before Tennessee's week-3 game. The script runs 84 assertions before it draws the chart, including the snapshot timing (after every week-2 game, so after the preseason regression has fired), each historical row in the table, and that the simulated mean equals the sum of the fifteen game probabilities. Nothing on the page is typed in by hand.
Go deeper
Want the code behind these metrics? Work through the 45-chapter NFL analytics tutorial.
Browse tutorials Free tools