Atlanta 35, Green Bay 14
Week 3 opened on Thursday night with the upset the prediction ledger gave a little under a three-in-ten chance of happening. The ledger froze Green Bay at 0.7139 on September 22; Atlanta, 0-2 and rated 1412.9, won 35-14 at Lambeau Field. ESPN's scoreboard has the same final, and so does the ledger's graded row.
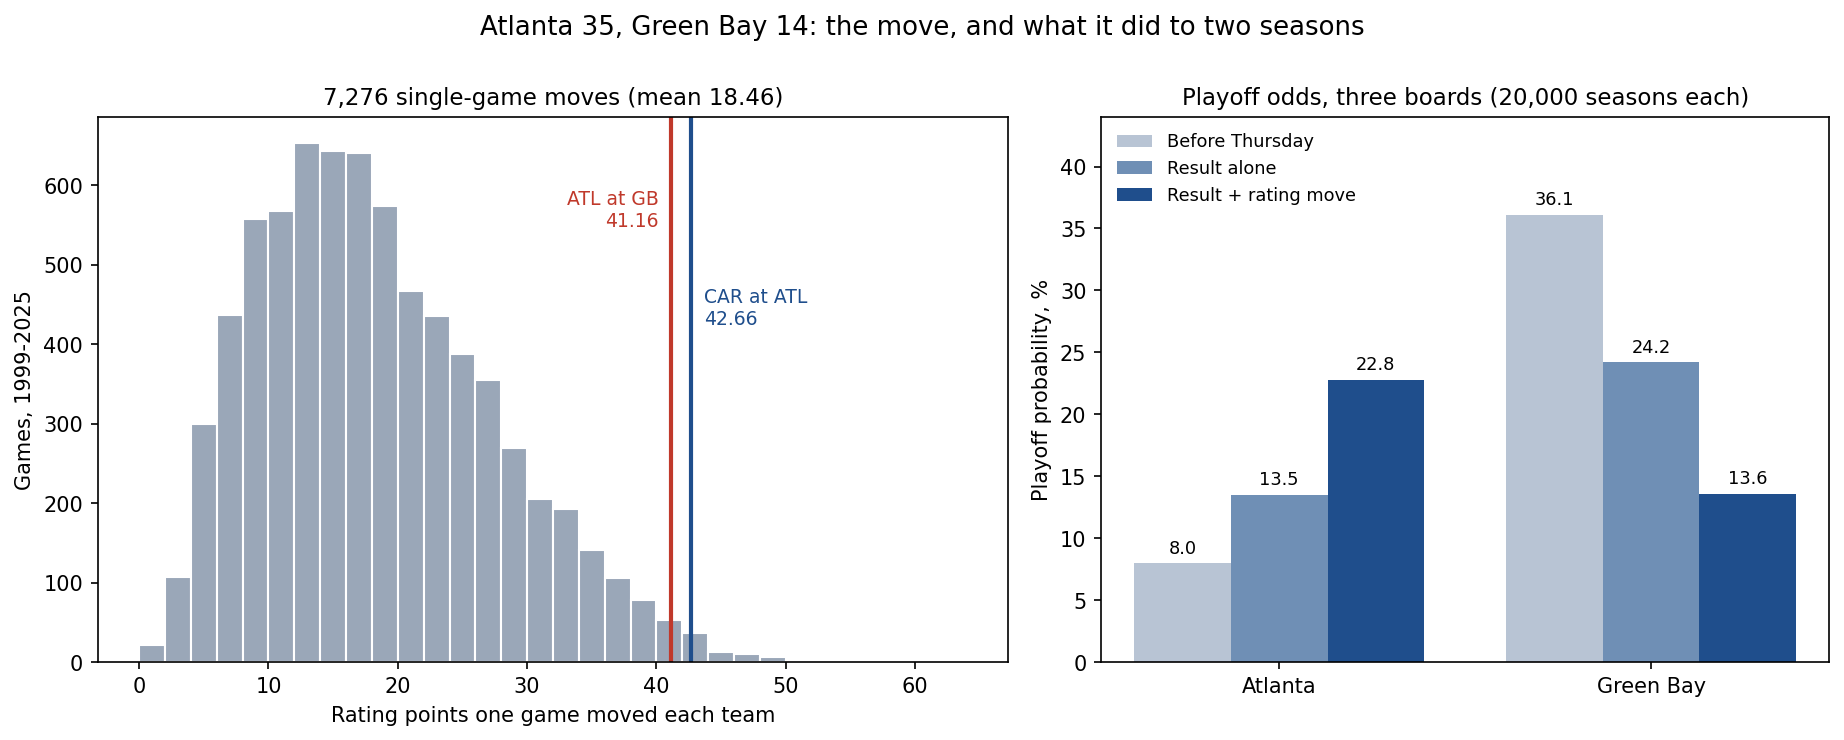
The miss is ordinary. What is not ordinary is what it did to the ratings. The game moved both teams by 41.16 points, the second-largest single-game move of 2026. The largest, 42.66, came four days earlier, when Carolina won 34-3 at Atlanta. So the season's two biggest swings belong to the same team, in opposite directions, and Atlanta now stands at 1454.1, within 1.5 points of the 1455.6 it carried into that Carolina game. The ratings have taken back almost exactly what one bad Sunday took away.
This page grades the pick against three market prices, measures the move against every game since 1999, re-prices both teams' seasons three ways through the same simulation the week-3 leverage board used, and updates Thursday's 0-3 forecast, which Atlanta just left.
The Pick, and a Market That Moved Toward Atlanta
The ledger's number was fixed two days before kickoff. DraftKings' was not, and ESPN's feeds preserve three points on its path. Removing the bookmaker's margin from each pair of moneylines gives Green Bay's implied probability:
| Forecast | Price | Green Bay | Brier on this game |
|---|---|---|---|
| DraftKings at the open | -360 / +285 | 0.7508 | 0.5637 |
| The ledger, frozen September 22 | Elo 1523.8 + 48 against 1412.9 | 0.7139 | 0.5097 |
| DraftKings, morning of September 23 | -270 / +220, Green Bay -5.5 | 0.7002 | 0.4902 |
| DraftKings, the price ESPN retained after kickoff | -238 / +195, Green Bay -4.5 | 0.6750 | 0.4557 |
The market opened more confident than the model, spent the week moving toward Atlanta and finished less confident than the model. Graded on a result that went the other way, every later price beat the ledger and the opening price lost to it. The retained price is a later pre-game line, not a closing line, and it is quoted as one. A single game proves nothing about which forecaster is better; it only records that on Thursday the market's movement was in the right direction.
The Exhibit
The Swing Back
The update rule is the one on What One Game Moves: the shift is K times the margin multiplier times the gap between the result and the stated probability. Green Bay was the home side at 0.7139 and lost, and Atlanta won by 21 while standing 158.9 points below Green Bay's home-adjusted rating. That makes the multiplier ln(22) × 2.2 / (0.001 × 158.9 + 2.2) = 2.8828, large both because the margin was big and because the winner was the underdog, and the shift 20 × 2.8828 × 0.7139 = 41.16. The ledger rounds the ratings to 1454.1 and 1482.7, a published move of +41.2 and -41.1.
Against history it is a big move but not a freak one. The replay holds 7,276 games from 1999 to 2025, and the average game moves each team 18.46 points. 103 of the 7,276 moved a team at least as far as Thursday did, so this sits at the 98.6th percentile. What a Blowout Is Worth explains why the tail is this long: the multiplier rewards margin and punishes a favourite's loss hardest.
In 2026 it ranks second. The three largest moves of the season:
| Game | Result | Move |
|---|---|---|
| Week 2: Carolina at Atlanta | Carolina 34-3 | 42.66 |
| Week 3: Atlanta at Green Bay | Atlanta 35-14 | 41.16 |
| Week 1: Arizona at the Chargers | Arizona by 12 | 35.17 |
Atlanta's season so far reads as a rating trace: 1470.3 on opening day, 1455.6 after losing 20-13 at Pittsburgh, 1412.9 after the Carolina game and 1454.1 now. Two of the three largest moves of the year have gone through the same team four days apart, and they nearly cancel. Green Bay went the other way on Thursday, from 1523.8 to 1482.7, and now ranks 17th; Atlanta ranks 21st.
How Unlikely Was 35-14?
Two separate questions, and the replay answers both. First, was .2861 an honest price for Atlanta? Across the 1,455 sides the engine priced between .25 and .33 since 1999, those teams won 30.4% of the time against an average stated price of 29.3%. The price range is well calibrated, so an Atlanta win was never a long shot; it was the three-in-ten it was priced as.
Second, how often does such a team win by 21 or more? In that same band, 442 teams won, and 42 of those wins were by 21 or more. So a side priced near .29 wins by three scores about 2.9% of the time, roughly one game in 35. That is the rarer part of Thursday, and it is the part the margin multiplier charges for. Blowouts are not unusual among underdog wins in general: of the 2,591 underdog wins in the file, 263, or 10.2%, came by 21 or more.
The Playoff Picture, Three Ways
The leverage board forced every week-3 game both ways with the ratings held still, to isolate what a result does. A real result does two things at once: it adds a win and a loss, and it moves the ratings that price every game still to come. Running the same 20,000-season simulation three times separates them. It uses the same schedule, seed and seeding rules, and reproduces the leverage board's published pre-game figures exactly.
| Board | Atlanta playoffs | Atlanta division | Green Bay playoffs | Green Bay division |
|---|---|---|---|---|
| Before Thursday | 8.0% | 7.2% | 36.1% | 8.3% |
| The result alone, ratings held | 13.5% | 11.9% | 24.2% | 4.5% |
| The result and the rating move | 22.8% | 19.7% | 13.6% | 2.0% |
The win itself was worth 5.5 points of playoff probability to Atlanta. The rating move added 9.3 more, so most of Atlanta's gain came from the model re-rating the team rather than from the win column. Green Bay's fall splits more evenly: 11.9 points from the result and 10.6 from the re-rating. That split is the model's own, and it is only as right as the rating is: a 41-point swing is an estimate built on one game. Expected wins moved from 5.61 to 7.10 for Atlanta and from 8.72 to 7.22 for Green Bay.
Thirty other teams moved without playing. The largest bystander moves were New Orleans (5.4 points), the Rams (4.0), Chicago (3.6) and Detroit (3.4). Chicago and Detroit are Green Bay's division rivals, and New Orleans shares a division with Atlanta.
The 0-3 Count, Updated
What 0-3 Means priced how many teams week 3 would leave at 0-3, from the ledger's frozen week-3 probabilities: 5.27 expected across the eight 0-2 teams. Atlanta was one of them, carrying a 0.7139 chance of loss. That chance is now zero, so the expected count falls to 4.56, about one fewer, from the seven 0-2 teams still to play. Houston and Indianapolis still meet on Sunday, so, barring a tie, the count cannot fall below one.
The Scoreboard
The ledger now reads 20 of 33, with fifteen week-3 rows still frozen. Its Brier score went from 0.2310 over 32 games to 0.2395 over 33: one game at 0.5097 moved the season average by more than eight thousandths. A Worse Score Is Not a Worse Model explains why one bad night says little about calibration, and Where the Overconfidence Is Not shows where the model's confidence is and is not justified.
What This Page Does Not Show
- Why Atlanta won. The engine sees scores, not plays, injuries or quarterbacks. Nothing here explains the margin.
- A closing line. ESPN's retained price is a later pre-game DraftKings line, recorded after kickoff; it is not certified as the close.
- Whether the swing is real. A 41-point move after one game is the rule doing what it always does. If Atlanta is closer to 1412.9 than to 1454.1, the next few weeks will pull it back.
Method and Sources
shift = K * mov_multiplier(-21, 1412.9 - (1523.8 + 48)) * (0 - 0.7139)   # -41.16
board_pre    = simulate(pre_game_ratings, 32_results_fixed)             # reproduces the leverage board
board_result = simulate(pre_game_ratings, 32_results_fixed + [ATL wins])
board_now    = simulate(ledger_ratings,  32_results_fixed + [ATL wins]) # 20,000 seasons, seed 2026
The script make_atl_gb_graded_chart.py asserts the engine constants, the frozen ledger row and its snapshot, the final score against ESPN, the Brier arithmetic, all three market prices and their Briers, the rating move and its multiplier, the replay's move distribution and underdog bands, the three simulated boards (including an exact reproduction of the leverage board's published figures), the 0-3 update, and every number on this page.
Sources: the nflverse public game log (games.csv, 1999-2025, and the 2026 schedule); ESPN's public NFL scoreboard for September 24, 2026 and its game summary for the same event, both pulled September 25 with no custom user agent, and its week-3 scoreboard of September 23 for the DraftKings prices; the site's own prediction ledger, frozen September 22 and snapshotted on the morning of September 25.
Further reading
- What 0-3 Means, and How Many 2026 Is About to Have — Thursday's preview of this game, and the count it updates
- Week 3's Leverage Board — the simulation reproduced here, and every week-3 game forced both ways
- What One Game Moves — the update rule behind the 41.16
- What a Blowout Is Worth to a Rating — why a 21-point upset moves so far
- What Would Change Its Mind — how far each week-3 pick was from flipping
- Buffalo 41, Detroit 31 — the previous Thursday grading note, and a hit
- The First Miss — the season's first graded miss
- Shrinking the Playoff Odds — how much of the certainty in these playoff numbers survives a calibration test
- A Worse Score Is Not a Worse Model — reading a Brier score after a miss
- Atlanta Falcons and Green Bay Packers — the team pages, with the new ratings
- The Prediction Ledger — twenty of thirty-three, fifteen rows still frozen
Go deeper
Want the code behind these metrics? Work through the 43-chapter NFL analytics tutorial.
Browse tutorials Free tools