Thirteen Games Left
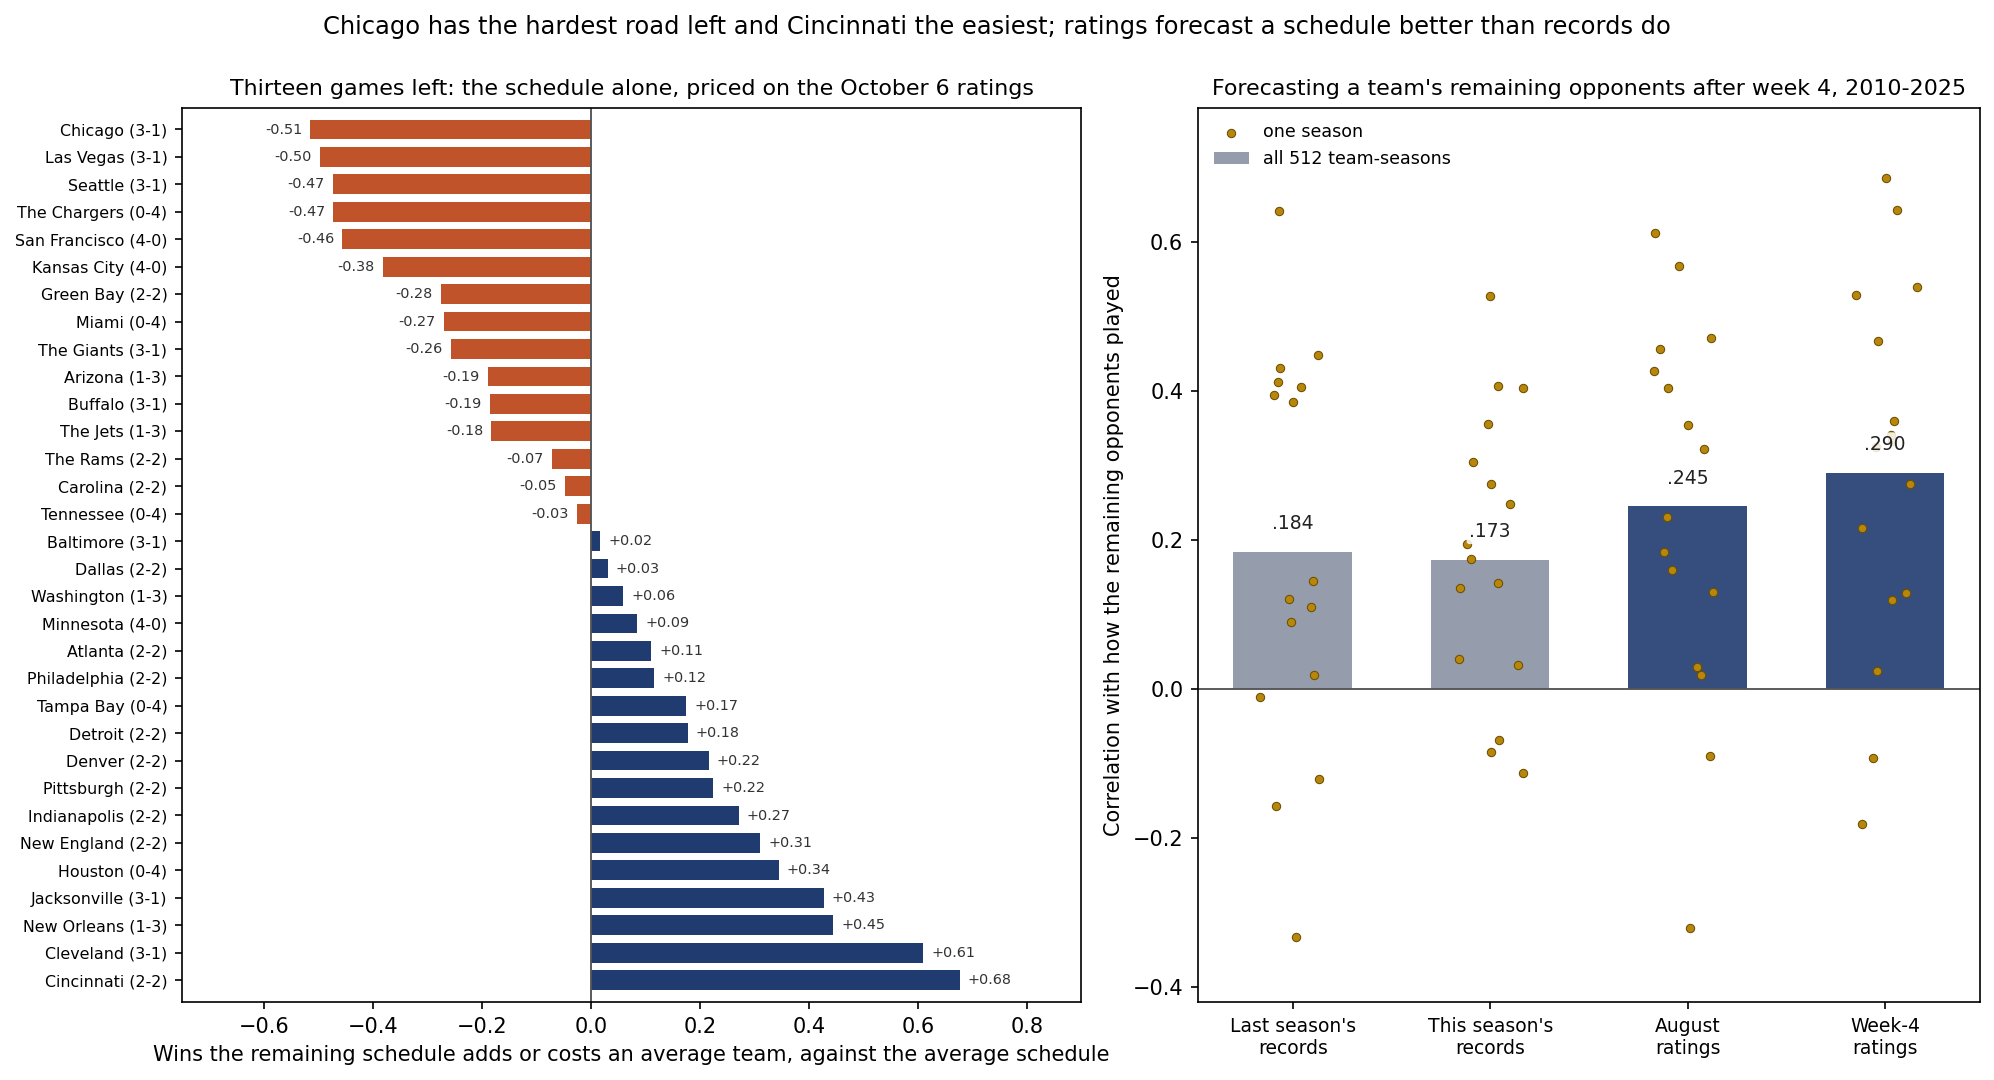
Four weeks are played and every team has thirteen games left. Remaining-schedule tables are often built from the opponents' records. Priced instead on the ratings the prediction ledger uses, as published on October 6 after Monday night's game, Chicago has the hardest road left and Cincinnati the easiest. Chicago's remaining opponents average an effective 1535.8, meaning each opponent's rating with the 48-point home edge applied from Chicago's side; Cincinnati's average 1465.4. Played by a team of exactly average strength, Chicago's thirteen games would be worth 0.51 wins fewer than the average remaining schedule, and Cincinnati's 0.68 more. That is 1.19 wins from one end of the league to the other, the whole spread the calendar hands out from here.
That is the 2026 table. The other half of this page asks how far any such table should be trusted at this point of the season. From 2010 to 2025 the ratings after week 4 were a better forecast of how good a team's remaining opponents would turn out to be than either last season's records or this season's records, and the schedule then cost teams about exactly what the ratings said it would. Even so, the best of the forecasts correlated only .290 with what the opponents went on to do.
The Exhibit
All Thirty-Two
The table ranks the 32 remaining schedules from costliest to kindest for an average team. The effective opponent is the average of the thirteen opponents' ratings, adjusted for where each game is played. Expected wins are the team's own, summed from the ledger's arithmetic on every remaining game. The last two columns are the record-based versions: the remaining opponents' winning percentage in 2025, the method the team pages use for the full season, and their winning percentage in 2026 so far, four games each, with each table's rank from hardest.
| Rank | Team (2026 record) | Effective opponent | Worth to an average team (wins) | Expected wins left | Opponents in 2025 | Opponents in 2026 |
|---|---|---|---|---|---|---|
| 1 | Chicago (3-1) | 1535.8 | -0.51 | 7.16 | .579 (1st) | .500 (13th) |
| 2 | Las Vegas (3-1) | 1531.4 | -0.50 | 4.82 | .557 (5th) | .519 (10th) |
| 3 | Seattle (3-1) | 1531.6 | -0.47 | 9.07 | .523 (10th) | .654 (1st) |
| 4 | The Chargers (0-4) | 1530.8 | -0.47 | 5.04 | .538 (6th) | .519 (9th) |
| 5 | San Francisco (4-0) | 1531.9 | -0.46 | 8.23 | .486 (20th) | .577 (2nd) |
| 6 | Kansas City (4-0) | 1527.3 | -0.38 | 7.36 | .557 (4th) | .481 (20th) |
| 7 | Green Bay (2-2) | 1520.3 | -0.28 | 6.08 | .577 (2nd) | .500 (16th) |
| 8 | Miami (0-4) | 1520.1 | -0.27 | 4.33 | .572 (3rd) | .481 (21st) |
| 9 | The Giants (3-1) | 1520.1 | -0.26 | 5.39 | .536 (7th) | .500 (18th) |
| 10 | Arizona (1-3) | 1516.3 | -0.19 | 4.41 | .518 (11th) | .558 (3rd) |
| 11 | Buffalo (3-1) | 1515.0 | -0.19 | 8.57 | .482 (21st) | .519 (7th) |
| 12 | The Jets (1-3) | 1515.6 | -0.18 | 3.99 | .529 (9th) | .519 (12th) |
| 13 | The Rams (2-2) | 1511.5 | -0.07 | 7.99 | .489 (18th) | .519 (8th) |
| 14 | Carolina (2-2) | 1507.9 | -0.05 | 5.56 | .532 (8th) | .462 (25th) |
| 15 | Tennessee (0-4) | 1506.6 | -0.03 | 3.15 | .505 (16th) | .481 (23rd) |
| 16 | Baltimore (3-1) | 1504.6 | +0.02 | 7.58 | .516 (13th) | .462 (24th) |
| 17 | Dallas (2-2) | 1502.2 | +0.03 | 6.04 | .514 (14th) | .481 (19th) |
| 18 | Washington (1-3) | 1503.4 | +0.06 | 5.01 | .473 (25th) | .538 (6th) |
| 19 | Minnesota (4-0) | 1500.6 | +0.09 | 8.53 | .518 (12th) | .519 (11th) |
| 20 | Atlanta (2-2) | 1499.0 | +0.11 | 6.29 | .457 (29th) | .558 (4th) |
| 21 | Philadelphia (2-2) | 1500.5 | +0.12 | 7.30 | .489 (19th) | .538 (5th) |
| 22 | Tampa Bay (0-4) | 1495.3 | +0.17 | 5.23 | .509 (15th) | .462 (30th) |
| 23 | Detroit (2-2) | 1493.3 | +0.18 | 7.22 | .480 (22nd) | .500 (15th) |
| 24 | Denver (2-2) | 1493.0 | +0.22 | 8.15 | .475 (23rd) | .462 (27th) |
| 25 | Pittsburgh (2-2) | 1492.8 | +0.22 | 6.78 | .498 (17th) | .442 (31st) |
| 26 | Indianapolis (2-2) | 1487.7 | +0.27 | 6.30 | .468 (27th) | .462 (29th) |
| 27 | New England (2-2) | 1486.7 | +0.31 | 8.22 | .473 (24th) | .481 (22nd) |
| 28 | Houston (0-4) | 1483.3 | +0.34 | 7.06 | .468 (26th) | .462 (28th) |
| 29 | Jacksonville (3-1) | 1478.7 | +0.43 | 8.71 | .464 (28th) | .385 (32nd) |
| 30 | New Orleans (1-3) | 1480.0 | +0.45 | 5.12 | .441 (30th) | .500 (17th) |
| 31 | Cleveland (3-1) | 1471.3 | +0.61 | 6.18 | .385 (32nd) | .462 (26th) |
| 32 | Cincinnati (2-2) | 1465.4 | +0.68 | 7.15 | .394 (31st) | .500 (14th) |
The six costliest schedules belong to Chicago, Las Vegas, Seattle, the Chargers, San Francisco and Kansas City, each worth at least 0.38 wins less than average, and they are the same six by the effective-opponent average. The order differs in places because a schedule's cost depends on how spread out its opponents are as well as on their average: the win-probability curve flattens at both ends. The five kindest are Cincinnati's, Cleveland's, New Orleans', Jacksonville's and Houston's, each worth at least 0.34 wins more. Sixteen of the 32 are within a quarter of a win of average either way.
Seattle expects the most wins from its thirteen, 9.07, and Tennessee the fewest, 3.15. Arizona, Atlanta and Green Bay have eight home games left, Buffalo and Houston five, and five of the remaining games are coded as neutral sites. Houston's 7.06 uses its rating as it stands; 0-4 and Still 14th argued that number should be discounted.
Three Tables That Disagree
Across the 32 teams, the ratings' effective-opponent averages agree with a table built from the remaining opponents' 2025 records at .83. A table built from their 2026 records agrees with the ratings at .52, and with the 2025 table at .14, close to not at all. For some teams the three tell different stories. Kansas City's remaining schedule ranks 4th hardest by its opponents' 2025 records, 20th by their 2026 records and 6th in the table above. San Francisco's ranks 20th, 2nd and 5th; Atlanta's 29th, 4th and 20th. By 2026 records Jacksonville's remaining opponents are the weakest in the league, .385, and Seattle's the strongest, .654. Chicago's are the hardest by the ratings and by 2025 records, .579, and 13th by 2026 records.
Which Table to Trust
The file can settle it. For every season from 2010 to 2025, the harness stops the clock after week 4 and builds four forecasts of each team's remaining opponents: their records the season before, their records in weeks 1 to 4, their August ratings and their ratings after week 4. Each forecast is then graded against how those opponents actually played from week 5 on, in their games against everyone else, across 512 team-seasons and 6,328 remaining team-games.
| Forecast of the remaining opponents | Correlation, all 512 | Median season | Best of the four, seasons |
|---|---|---|---|
| Last season's records | .184 | .133 | 1 |
| This season's records, weeks 1 to 4 | .173 | .184 | 3 |
| August ratings | .245 | .276 | 4 |
| Ratings after week 4 | .290 | .329 | 8 |
The ratings after week 4 beat this season's records in 13 of the 16 seasons, last season's records in 10 and the August ratings in 10. This season's records, the basis of many mid-season tables, were the weakest of the four over all 512 team-seasons. None of the four is strong. The yardstick is itself noisy, since each team's remaining opponents play only about a dozen other games each, and in single seasons even the ratings ranged from -.181 to .685; last season's records went as low as -.333.
The Schedule Costs What the Ratings Say
A weak forecast of the schedule is not the same as a schedule that does not matter. Across the same 512 team-seasons, regress each team's win rate from week 5 on against its own rating after week 4 and the effective strength of its remaining opponents. Each rating point of schedule cost .001321 of win rate, with a standard error of .000404. The ratings' own forecast for the same games says .001261, and the two agree to within a fifth of a standard error. At the measured rate, the 70.4 points between Chicago's schedule and Cincinnati's are worth 1.21 wins over thirteen games, against the 1.19 the ratings give directly.
The team's own rating carried less than the ratings claimed, .001032 of win rate a point against .001277, which is the overconfidence this site has measured before in Shrinking the Playoff Odds, Tested Out of Sample. The schedule term did not share it. Across those team-seasons the effective schedule had a standard deviation of 20.46 rating points, and only 27 of the 512, 5.3%, faced a remaining schedule as hard as Chicago's, which sits 30.8 points above an average team.
Worked Through: Chicago
Chicago's thirteen remaining games, priced exactly as the ledger prices a game, with the effective opponent from Chicago's side. The bye is in week 10.
| Week | Game | Effective opponent | Chicago's chance |
|---|---|---|---|
| 5 | at Green Bay | 1544.6 | .5424 |
| 6 | at Atlanta | 1535.1 | .5560 |
| 7 | vs New England | 1540.8 | .5478 |
| 8 | at Seattle | 1735.5 | .2832 |
| 9 | vs Tampa Bay | 1375.0 | .7588 |
| 11 | vs New Orleans | 1353.2 | .7811 |
| 12 | at Detroit | 1585.1 | .4843 |
| 13 | vs Jacksonville | 1564.3 | .5142 |
| 14 | at Miami | 1438.0 | .6865 |
| 15 | at Buffalo | 1689.0 | .3405 |
| 16 | vs Green Bay | 1448.6 | .6732 |
| 17 | vs Detroit | 1489.1 | .6201 |
| 18 | at Minnesota | 1667.3 | .3691 |
effective opponent, at Seattle = 1687.5 Seattle + 48 home edge         = 1735.5
Chicago's chance at Seattle    = 1 / (1 + 10 ** ((1735.5 - 1574.2) / 400)) = .2832
Chicago's expected wins left   = sum of the thirteen chances               = 7.16
an average team (1505.0), same thirteen games                              = 5.9830
the average over all 32 remaining schedules                                = 6.4977
worth of Chicago's schedule to an average team                             = 5.9830 - 6.4977 = -0.5147
The ratings make Chicago an underdog in four of the thirteen: at Seattle, at Buffalo, at Minnesota and, narrowly, at Detroit. The trip to Seattle in week 8, at an effective 1735.5, is the hardest game Chicago has left.
What This Page Does Not Show
- A table that stays put. The ratings are those of October 6 and every result from Thursday night on moves them. The 2010-2025 record above is the measure of how much a table like this one holds.
- Rosters and quarterbacks. The ratings read final scores only. An injury that changes an opponent's season changes its rating only after it shows up in results.
- Rest. The effective opponent counts home field and neutral sites, not days of rest; the schedule-quirks page has the rest ledger.
- Ties. No probability here allows for one.
- A clean yardstick. The correlations are graded against the remaining opponents' results, which carry a dozen games' worth of luck each, so part of the shortfall from 1.0 belongs to the yardstick, not to the forecasts.
Method and Sources
effective opponent = opponent's rating, -48 when the team is at home, +48 when away, +0 at a neutral site
expected wins      = sum over the 13 games of 1 / (1 + 10 ** (-(gap + edge) / 400))       # the ledger's arithmetic
worth              = expected wins of a 1505.0-rated team in the same 13 games, minus 6.50   # the 32-schedule average
forecast grade     = correlation, across team-seasons, of each forecast with the remaining opponents'
                     win rate from week 5 on in games not against the team (ties count half)    # 2010-2025, 512
The script make_remaining_schedule_chart.py replays the engine over 1999-2025 and the 64 games of 2026 final through Monday, checks its ratings against the ledger's published ones for all 32 teams, prices the 208 remaining games, builds both record-based tables, replays sixteen seasons to the end of week 4 to grade the four forecasts and fit the schedule's cost, and asserts every number on this page.
Sources: the nflverse public game log (games.csv), 1999-2025 from the copy bundled in June and 2026 from a pull on October 7, 2026, whose 1999-2025 rows were checked identical; ESPN's scoreboards for weeks 1 to 4, whose 64 final scores match the file's; the site's prediction ledger as published on October 6.
Further reading
- Week 5: Chicago Favoured at Lambeau, a First Since 2006: today's companion, on the first of Chicago's thirteen
- The 2026 Strength of Schedule, and How Much Preseason SOS Actually Lies: the preseason table and its record
- The First Four Games, Priced: Whose September Is Hardest in 2026: the opening month, priced the same way
- Strength of Schedule, Adjusted: Comparing NFL Teams Fairly: why a rating already contains the schedule played
- 0-4 and Still 14th: Is the Board Too Slow?: how far to trust the ratings themselves after four games
- Reading the 2026 Schedule: Rest Edges, Short Weeks, and Who the Calendar Actually Favors: rest, which this page leaves out
- The team pages and the power rankings
Go deeper
Want the code behind these metrics? Work through the 43-chapter NFL analytics tutorial.
Browse tutorials Free tools