Four Tenths of a Point
Sunday night's game is the Rams at Denver, and the prediction ledger rates the two teams 1595.0 and 1595.4. That is four tenths of a point apart, as close to equal as two ratings get. Without a home edge the engine would price Denver at 0.5006. With the 48-point home-field constant every home team receives, it prices Denver at 0.5692, the pick frozen on September 22. What Would Change Its Mind put this pick 48.4 rating points from flipping, which is the home constant plus those four tenths. Almost the whole pick is home field.
Denver is where that constant draws the most familiar objection. The Broncos play a mile above sea level, and the thin air is behind one of football's best-known claims: visitors tire, kicks carry, and the home edge is bigger than anywhere else. The week-3 leverage board ranks this game first by how much playoff probability it moves, so it is worth asking whether the constant short-changes Denver. This page checks it three ways from the bundled game log, 1999 to 2025, and then prices Sunday's pick with each answer.
The short version: Denver's home edge is real and above average, but the game log cannot tell it apart from an ordinary one. The betting market has charged Denver a small altitude premium, which the results over the full period did not earn and which has almost disappeared since 2018. And on Sunday the market disagrees with the model about the teams, not about the altitude.
The Exhibit
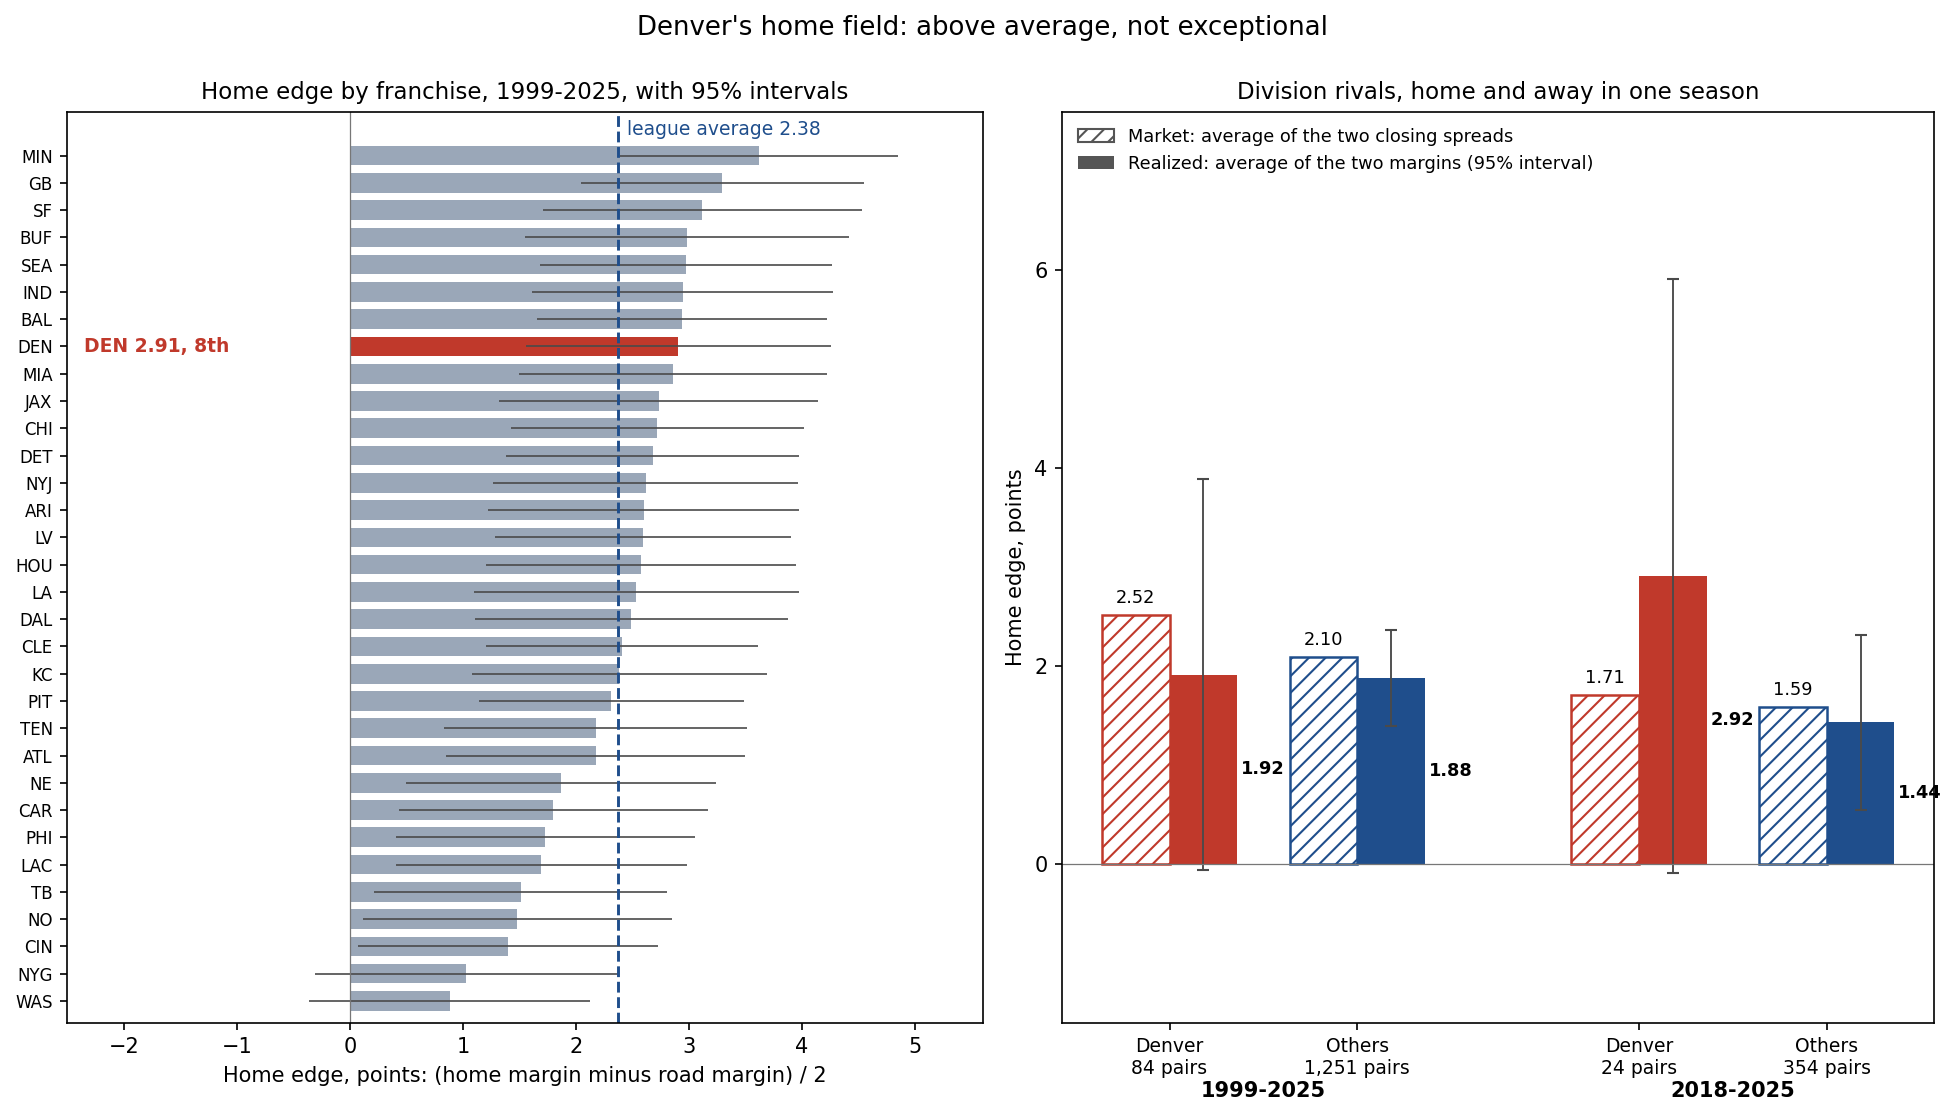
Above Average, Not Exceptional
The classic measure of a team's home edge takes its average home margin, subtracts its average road margin and halves the difference, so that a good team, which wins both at home and away, does not look like a good home team. Over 1999 to 2025 Denver won its home games by an average of 3.78 points and lost on the road by 2.04, a home edge of 2.91 points. The league average is 2.38. Denver ranks eighth of 32.
| Home edge, points, 1999-2025 | Estimate |
|---|---|
| Minnesota | 3.62 |
| Green Bay | 3.29 |
| San Francisco | 3.12 |
| Buffalo | 2.98 |
| Seattle | 2.98 |
| Denver (eighth) | 2.91 |
| League average | 2.38 |
| Cincinnati | 1.40 |
| The Giants | 1.03 |
| Washington | 0.88 |
Denver's estimate carries a standard error of 0.69 points, so it sits 0.77 standard errors above the league average. That is well inside the noise, and there is a second reason for caution. With 32 franchises, the one at the top of such a list will stand about 2.07 standard errors above the average by chance alone, which is what the largest of 32 draws of pure noise averages. No franchise clears that bar. The largest, Minnesota's, is 1.98 standard errors above the average, about where the luckiest of 32 would be expected to sit. The recent era tells the same story. Since 2018 Denver's edge is 2.82 points, seventh in the league, against a league average that has fallen to 1.73.
What the Engine Says
The engine offers a sharper test, because it prices every game against the ratings of the two teams playing it. In Denver's 230 home games since 1999, all at Mile High and none tied, Denver won 144, which is 62.6%. With the 48-point constant the engine expected 133.91. So Denver won about ten more home games than a standard home edge predicts, over 27 seasons. That is 1.43 standard errors, suggestive but short of the usual bar.
Solving for the home edge that would have made the engine's expectations match Denver's results gives 83.9 Elo points, against 50.8 for all teams over the same seasons by the same method. The 95% interval on Denver's figure runs from 35 to 136, which includes the shipped 48. Starting the count in 2010, when the engine begins grading its own picks, gives the same picture: 86 wins in 140 home games against 78.55 expected, a fitted edge of 92.0 against the league's 44.4. Since 2018 Denver won 38 of 69 home games against 35.64 expected, a fitted edge of 74.9 against 31.5 for the league.
The league figure of 31.5 for 2018-2025 is not the same number as the 29 that The Constants Nobody Tuned reports for the same years. That page re-ran the whole engine at each candidate value and kept the one with the best Brier score; this one holds the engine's ratings fixed and matches expected wins to actual ones. The two methods agree on what matters: the league-wide home edge has shrunk, and the shipped 48 is now too big for the average team.
What the Market Charges
Division rivals play twice a season, once at each park, which makes a clean experiment. If the closing spread is the home edge plus the difference in team strength, then the average of the two spreads in a home-and-away pair cancels the team strength and leaves only the market's home edge. The average of the two results does the same for the edge that actually happened.
| Division pairs | Pairs | Market's home edge | Realized home edge |
|---|---|---|---|
| Involving Denver, 1999-2025 | 84 | 2.52 points | 1.92 (SE 1.01) |
| All others, 1999-2025 | 1,251 | 2.10 points | 1.88 (SE 0.25) |
| Involving Denver, 2018-2025 | 24 | 1.71 points | 2.92 (SE 1.53) |
| All others, 2018-2025 | 354 | 1.59 points | 1.44 (SE 0.45) |
Over the full period the market gave Denver about 0.42 points more home edge than the average division rival, and the results show a difference of 0.04. So the bookmakers charged a small altitude premium, and Denver's home results in these games did not pay it back. That runs against the reputation: if altitude were worth more than the market charges, Denver's realized edge would sit above its market edge, and over 27 seasons it sits below.
Since 2018 the premium has nearly gone, 1.71 points for Denver against 1.59 for everyone else, and Denver's 24 recent pairs came in well above it. Neither window settles anything. The full-period Denver figure has a standard error of a full point, wide enough to hide an edge twice the league's, and the recent one has a standard error of one and a half. What the division games do show is how little extra the market has charged for the altitude: 0.42 points over the full period and 0.12 since 2018.
Sunday's Pick, Four Ways
| Home edge used | Elo points | Denver win probability |
|---|---|---|
| None | 0 | 0.5006 |
| The league's 2018-2025 edge, this page's method | 31.5 | 0.5457 |
| The shipped constant (the frozen pick) | 48 | 0.5692 |
| Denver's own fitted edge, 1999-2025 | 83.9 | 0.6190 |
Whichever home edge is used, the engine keeps Denver the favourite. The market does not. On Friday morning DraftKings had the Rams favoured by 2.5 points, with moneylines of +110 on Denver and -130 on the Rams, a vig-free 0.4573 for Denver. The line opened at +120 and -142, or 0.4365, which is where it still stood on Wednesday, and has moved slightly toward Denver since.
Add back a home edge of the size the market has charged in Denver's recent division games, 1.71 points, and the line makes the Rams about four points better than Denver on a neutral field. The engine makes them level. That is the real disagreement on Sunday, and no value for the altitude closes it: for the engine to reach the market's 0.4573, Denver's home edge would have to be -30 Elo points, a home disadvantage. If Denver wins, the frozen pick is right, but the home field was never the question; the ratings were.
What This Page Does Not Show
- Where in the game altitude would act. The claim is that visitors fade late. Scores by quarter are not in the bundled log, so a fourth-quarter test is not possible here.
- Kicking. Thin air does help field goals, as the special-teams page notes. A longer range is part of whatever edge Denver has, not something to add on top.
- The teams this year. Injuries, quarterbacks and the Rams' travel are outside the engine, which is one reason the market and the model can sit four points apart.
Method and Sources
home_edge[t]   = (mean(home margins of t) - mean(road margins of t)) / 2      # points
fitted_edge    = h such that sum(logistic(r_home - r_away + h)) == actual home wins
pair_market    = (spread_line at A + spread_line at B) / 2   # division pair, same season, both closing lines
pair_realized  = (margin at A + margin at B) / 2
The script make_denver_home_field_chart.py asserts the engine constants, that every Denver home game counted was played at Mile High, the splits and their ranks for both windows, the multiple-comparisons simulation, the engine's expected wins and the fitted edges with their interval for all three windows, the division-pair counts and averages for both windows, the frozen week-3 row, both DraftKings pulls, the four prices of Sunday's pick and the home edge that would match the market, and every number on this page.
Sources: the nflverse public game log (games.csv, 1999-2025), including its closing spreads and stadium names; the site's own prediction ledger, whose week-3 picks were frozen on September 22; ESPN's public week-3 NFL scoreboard, pulled on September 23 and September 25 with no custom user agent, for the DraftKings prices.
Further reading
- See also Chapter 25: Home Field Advantage Deep Dive (DataField.dev).
- The Constants Nobody Tuned — why the shipped 48 is too big for the league today
- Home-Field Advantage in the NFL Is Shrinking — the league-wide decline, 27 seasons of it
- The 48-Point Home Edge, Switched Off — the games where the constant does not apply
- Week 3's Leverage Board — why this game moves the most playoff probability
- What Would Change Its Mind — how close each week-3 pick is to flipping
- Atlanta 35, Green Bay 14 — the week-3 opener, graded
- Special Teams Analytics — the kicking side of altitude
- Denver Broncos and Los Angeles Rams — the team pages
- The Prediction Ledger — the frozen week-3 board
Go deeper
Want the code behind these metrics? Work through the 43-chapter NFL analytics tutorial.
Browse tutorials Free tools