The Board After Sunday
After Sunday's games the board, the Elo ratings that the prediction ledger and the power rankings both use, has Seattle first at 1687.5, then Buffalo at 1641.0, San Francisco at 1633.7, Minnesota at 1619.3 and Jacksonville at 1612.3. The three 4-0 teams sit 3rd, 4th and 9th: San Francisco, Minnesota and Kansas City. The five 0-4 teams sit 14th, 24th, 27th, 29th and 32nd: Houston, the Chargers, Tampa Bay, Miami and Tennessee.
Houston is the case that looks wrong. It began the season fifth at 1605.6, and four losses have taken 87.9 points off it, more than from any other team. At 1517.7 it is still above the league average of 1505 and ahead of 18 teams, 14 of which have won at least once. On the ratings after Sunday the board expects Houston to win .543 of its last 13 games, 7.06 wins.
The other big moves since August are the Chargers' -83.8, Miami's -69.1 and Tampa Bay's -65.4 on the way down, and Las Vegas' +81.4, San Francisco's +74.3, Kansas City's +72.7 (from 17th to 9th) and Minnesota's +63.2 on the way up. Measured as a spread, the opening four games moved the 30 teams that have played them by a standard deviation of 46.7 rating points, against 39.0 across 2010-2025 and second only to 2013's 49.4. Atlanta and New Orleans play their fourth game on Monday night and are left out of everything below. No single game in the file has moved a rating by more than 50.3 points, and Atlanta sits 63.6 points below Houston, so Houston's 14th place will survive Monday whatever the score.
So the question is whether a board that leaves an 0-4 team 14th is too slow to believe a record. Sixteen seasons say it is not, and say where it is wrong instead.
The Exhibit
Too Slow? The Direct Test
A rating moves after every game by K times the margin multiplier times the surprise, and this engine uses K = 20 all season. The Constants Nobody Tuned found 20 the best single K in sixteen seasons of hindsight and left one question open: whether a K that depends on the week would do better. If the board were too slow in September, a larger K for each team's first four games would forecast its later games better. The harness replays all sixteen seasons with a different K for those games only and scores the 3,139 later games, the ones in which both teams had already played four.
| K for each team's first four games | Brier score, the later games |
|---|---|
| 10 | .22002 |
| 16 | .21924 |
| 20 (the engine) | .21901 |
| 22 | .21897 |
| 24 | .21898 |
| 28 | .21913 |
| 40 | .22046 |
The best value is 22, and it beats 20 by .00004 of Brier. Scored on the next month alone, games five to eight, the answer is again 22, by .00005 (.22212 against .22217). Slower is worse and much faster is worse. The opening-month K is where it should be.
Grouped by Record
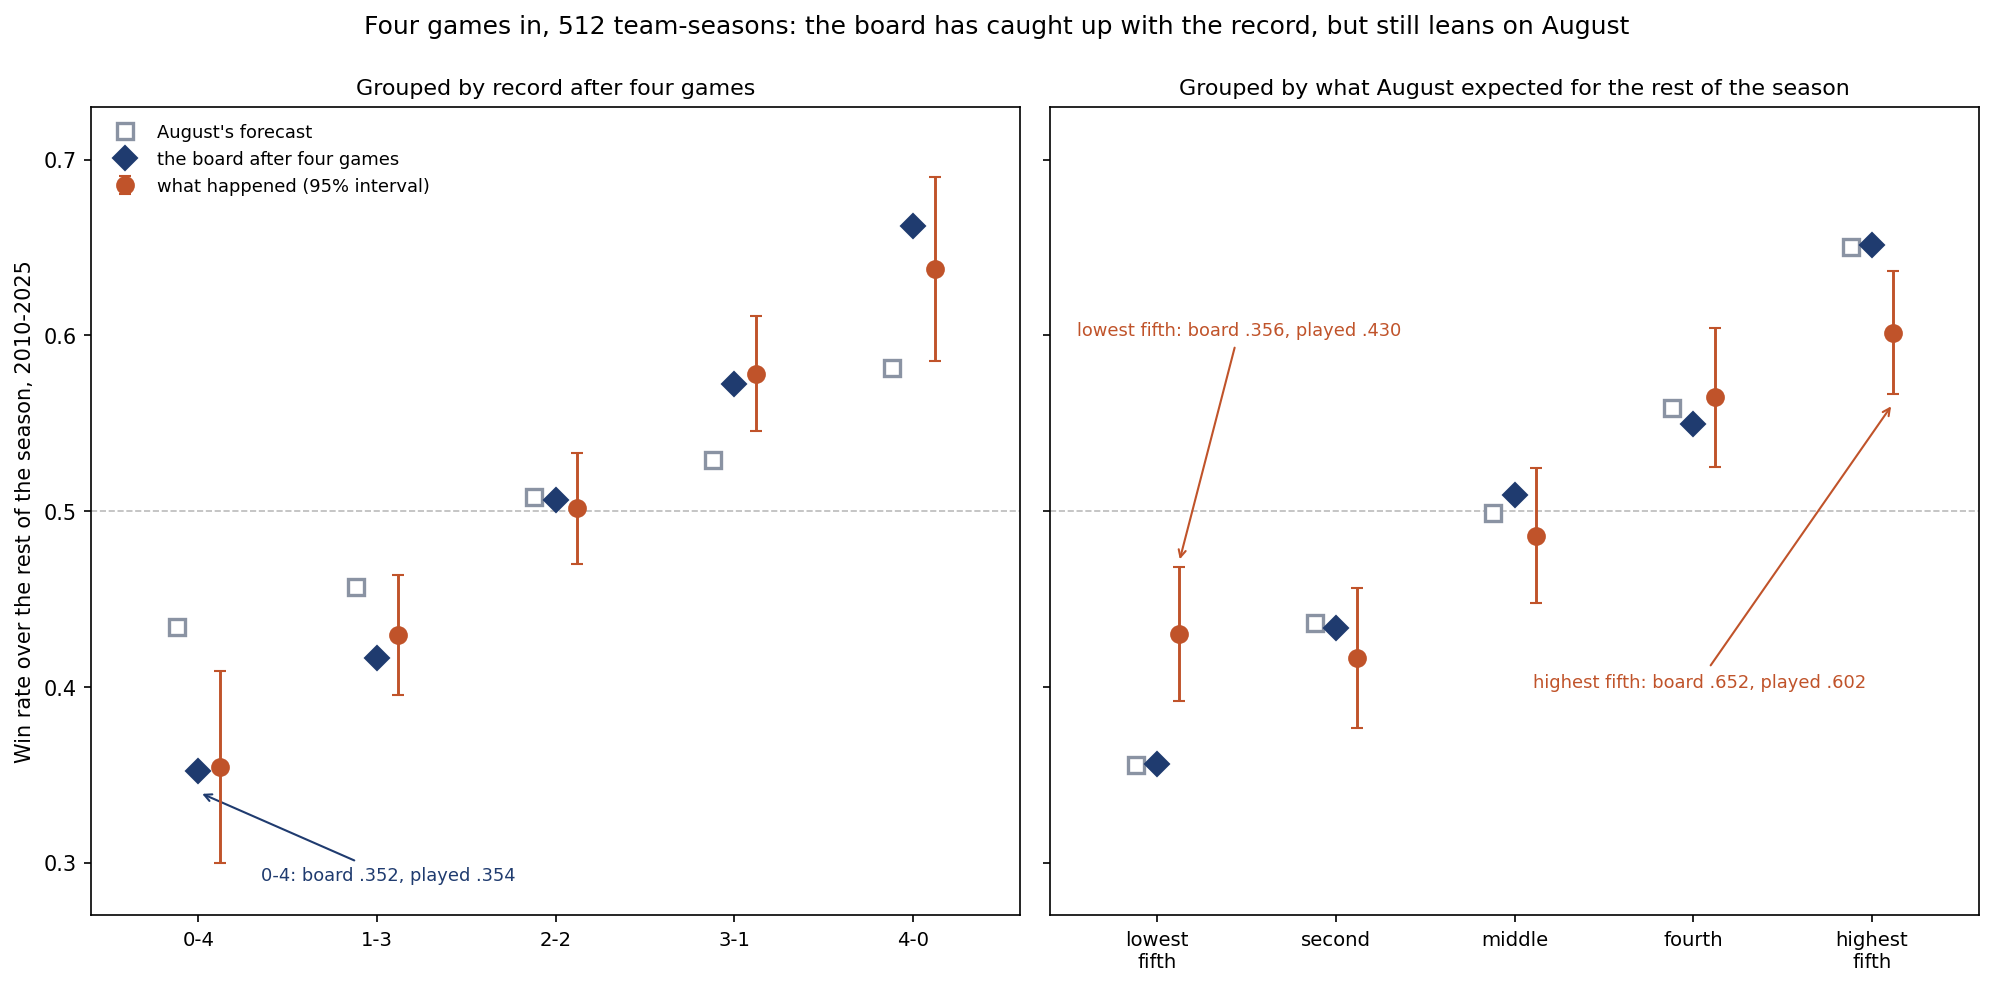
The second test asks the question the way a reader would. Take every team-season from 2010 to 2025, stop after each team's fourth game, and compare three numbers for its remaining twelve or thirteen games: what the August board expected, what the board expected at that moment, and what the team did.
| Record after four games | Team-seasons | August's forecast | Board after four | Played |
|---|---|---|---|---|
| 0-4 | 40 | .434 | .352 | .354 |
| 1-3 | 120 | .457 | .416 | .430 |
| 2-2 | 172 | .508 | .506 | .502 |
| 3-1 | 130 | .529 | .573 | .578 |
| 4-0 | 38 | .581 | .662 | .638 |
In every group the board's number is within two standard errors of what happened, and for the 40 teams that started 0-4 it is almost exact: .352 forecast, .354 played. The largest gap is the 4-0 group's, .025 high against a standard error of .027. August's numbers miss the 0-4, 3-1 and 4-0 groups by more than two standard errors each, and the 1-3 group by 1.6. By the time a team is 0-4 the board has already moved far enough. The only 0-4 team since 2010 that it still rated at .500 or better for the rest of the season was 2012 New Orleans, at .545, and that team went 7-5; one case says nothing either way. Houston's .543 makes it the second.
In regression form, the board's forecast after four games explains 20.8% of the variation in rest-of-season win rates (R-squared .208), against 12.5% for August's forecast, 13.4% for the four-game record and 17.0% for the four-game point differential. Keep the board's September movement at full weight and add the record: each win in the first four games is worth +0.6 points of win rate afterwards, with a standard error of 0.8, which is nothing. The standings know nothing the board's moves have not already absorbed. Point differential is the one input that edges in, at +.07 points of win rate per point (SE .03, z 2.4), so thirty points of differential is worth about a quarter of a win over thirteen games. It was the fourth specification tried, so it is a lead, not a finding.
Grouped by What August Said
Sorting the same 512 team-seasons by what the August board expected for their remaining games shows where the board is actually off.
| August's outlook, in fifths | Team-seasons | August's forecast | Board after four | Played |
|---|---|---|---|---|
| Lowest | 103 | .356 | .356 | .430 |
| Second | 102 | .437 | .433 | .417 |
| Middle | 102 | .499 | .509 | .486 |
| Fourth | 102 | .559 | .549 | .565 |
| Highest | 103 | .650 | .652 | .602 |
Within each fifth the September moves average out, so the board after four games sits almost on August's number. What happened does not: the teams August liked least played .074 better than the board expected (3.8 standard errors), and the teams it liked most played .050 worse (2.8). The middle three fifths are noise. The board's memory of August is too strong.
Split the board's forecast into the part it carried from August and the part September added, and fit both against what happened. The September part earns a weight of 1.25 (SE .16), within 1.6 standard errors of exactly one. The August part earns .705 (SE .078), 3.8 standard errors short of one. Holding the September part at exactly one leaves the August weight at .705, a shrink toward .500. The First Four Games, Priced reached the same figure from a different split, writing that the preseason ratings keep about seventy percent of their authority after a month. It is also the overconfidence that Shrinking the Playoff Odds measured in the playoff simulation, a calibration slope of 0.684 after week 1. Out of sample, fitting on fifteen seasons and scoring the sixteenth each time, the discount lowers the board's squared error from .0352 to .0343, 2.4%.
Houston, Re-Weighted
Apply that rule to 2026: keep every rating's September movement, shrink the part it carried from August by the fitted weight, and price each team's last 13 games. This is a measurement, not a change: the ledger and the power rankings keep the engine's own numbers.
| Team | Record | August | After Sunday | Move | Last 13, board | Last 13, August at .705 |
|---|---|---|---|---|---|---|
| Houston | 0-4 | 1605.6 (5th) | 1517.7 (14th) | -87.9 | 7.06 | 6.50 |
| Chargers | 0-4 | 1530.9 (14th) | 1447.1 (24th) | -83.8 | 5.04 | 5.03 |
| Tampa Bay | 0-4 | 1488.4 (18th) | 1423.0 (27th) | -65.4 | 5.23 | 5.29 |
| Miami | 0-4 | 1459.1 (23rd) | 1390.0 (29th) | -69.1 | 4.33 | 4.66 |
| Tennessee | 0-4 | 1349.8 (32nd) | 1300.0 (32nd) | -49.8 | 3.15 | 3.92 |
| San Francisco | 4-0 | 1559.4 (10th) | 1633.7 (3rd) | +74.3 | 8.27 | 8.08 |
| Minnesota | 4-0 | 1556.1 (11th) | 1619.3 (4th) | +63.2 | 8.52 | 8.22 |
| Kansas City | 4-0 | 1508.2 (17th) | 1580.9 (9th) | +72.7 | 7.41 | 7.51 |
| Seattle | 3-1 | 1674.6 (1st) | 1687.5 (1st) | +12.9 | 9.07 | 8.27 |
| Las Vegas | 3-1 | 1351.0 (31st) | 1432.4 (26th) | +81.4 | 4.82 | 5.68 |
Houston's 14th is mostly August. With the inheritance discounted, its last 13 games project to 6.50 wins, a .500 team, instead of 7.06. The discount is not aimed at Houston. It falls hardest on Seattle (-0.80), whose first place is mostly inherited, then on Denver and Houston, and it lifts the teams August dismissed most: Las Vegas (+0.86), Tennessee (+0.77) and the Jets (+0.74). Kansas City barely moves (+0.10). Its rating was average in August, so nearly all of its ninth place was earned in the last four weeks, and those moves stand.
The rule moves every forecast toward .500 in proportion to how far August had it from .500. It says nothing about who is good. A team whose August rating was right gets marked down for nothing, and the rule only pays across many teams.
What This Page Does Not Show
- Rosters, injuries and quarterbacks. The board reads final scores and nothing else; a change at quarterback is invisible to it. Neither test can see whether Houston's four losses had a cause that persists.
- A verdict on one team. Both fits are averages over 512 team-seasons. Any single team's August rating can be right, and the discount would then be wrong for it.
- A change to the ledger. The prediction ledger and the power rankings use the engine as published. Nothing here alters a frozen number; the discount is reported, not applied.
- Monday night. Atlanta and New Orleans are left out until they have played four. Houston does not play either of them this season, so Monday cannot move Houston's forecast through an opponent; other teams that do play them will see their forecasts shift slightly once Monday's result enters the ratings.
Method and Sources
board after four  = all 32 ratings right after a team's fourth game         # walk-forward: nothing later is used
rest forecast     = mean win probability over the team's remaining games      # from that board, or from August's
discounted        = .500 + .705 x (August - .500) + (board - August)          # September's movement kept at weight 1
early-K test      = replay with K_early for each team's first four games; Brier on games where both teams had played four
The script make_board_after_four_chart.py replays the engine over 1999-2025 and the 63 games of 2026 final through Sunday, checks its ratings against the ledger's published ones for all 32 teams, rebuilds the 512 team-seasons and both tables, fits the regressions with their standard errors and the leave-one-season-out check, runs the early-K replays, prices the 2026 schedule from both boards, and asserts every number on this page.
Sources: the nflverse public game log (games.csv), 1999-2025 from the copy bundled in June and 2026 from a pull on October 5, 2026, whose 1999-2025 rows were checked identical; the site's prediction ledger as published on October 5, whose ratings the replay reproduces for all 32 teams.
Further reading
- Five Teams at 0-4: The September Forecast, Graded: today's companion, grading the August forecast these teams beat or missed
- The Constants Nobody Tuned: K = 20, and the open question this page answers
- The First Four Games, Priced: seventy percent of August's authority after a month
- Shrinking the Playoff Odds, Tested Out of Sample: the same overconfidence in the playoff simulation
- The Model Gets Louder, Not Smarter: sixteen seasons of the engine by week
- What One Game Moves: the arithmetic of a single update
- Power Rankings and the Houston Texans and Kansas City Chiefs team pages
Go deeper
Want the code behind these metrics? Work through the 43-chapter NFL analytics tutorial.
Browse tutorials Free tools