Three of the Top Six
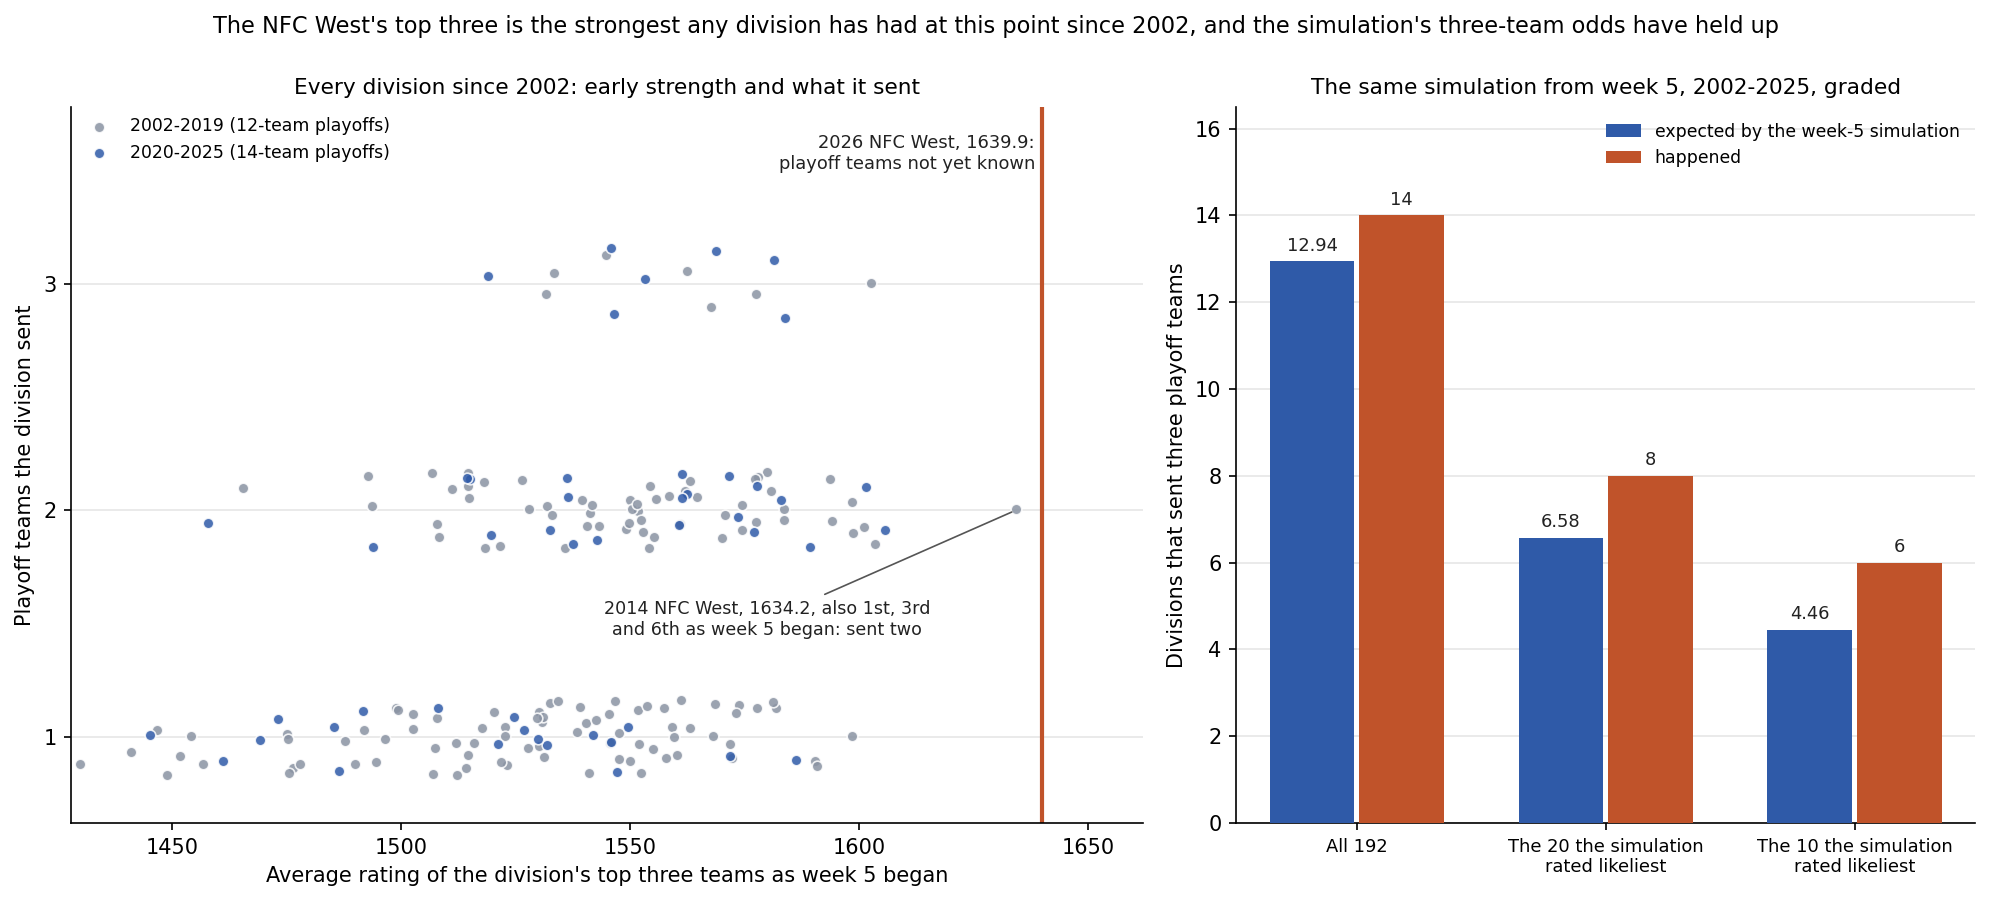
As week 5 began, the board, the Elo ratings that the prediction ledger and the power rankings both use, had Seattle first at 1687.5, San Francisco third at 1633.7 and the Rams sixth at 1598.6. Arizona was 30th at 1389.2. Thursday night's game in Dallas touched none of them. Since the 2002 realignment, three teams from one division had sat in the top six at this point of a season twice before, in the 2003 AFC West and the 2014 NFC West, and the average rating of this year's three, 1639.9, is the highest of the 200 division-seasons from 2002 to 2026. The 2014 NFC West, also first, third and sixth, is second at 1634.2, and nothing else comes within 34 points. Counting all four teams, the NFC West drops to third at 1577.2, behind the 2008 NFC East (1591.4) and the 2014 NFC West (1590.2), because Arizona is 30th.
The records agree in outline. Seattle is 3-1, San Francisco 4-0, the Rams 2-2 and Arizona 1-3. Three of their games have been against each other: San Francisco beat the Rams 27-7 in Melbourne and Arizona 36-30, and Seattle won 31-7 in Arizona. Against the rest of the league the four are 7-3.
Much of the rating was already there in August. The board opened the season with Seattle first at 1674.6, the Rams third at 1614.7 and San Francisco tenth at 1559.4, and that trio's 1616.2 was the second-best August top three since 2002, behind the 2014 NFC West's 1626.0. Since then San Francisco has added 74.3 points and Seattle 12.9, and the Rams have given back 16.1. 0-4 and Still 14th found that the board leans on its August numbers harder than the results have justified, so some of this division's lead is inherited, and inherited strength deserves the most caution.
The Exhibit
What the Strongest Trios Went On to Do
A division's strength shows in the playoff field, and every season's field can be read off the postseason games in the file. The ten strongest trios before this one, measured the same way as week 5 began, sent 20 teams to the playoffs: two each, except the 2007 AFC South, which sent three, and the 2017 AFC West, which sent one. The 2014 NFC West, the nearest match, sent Seattle and Arizona, and San Francisco went 8-8. Eight of those ten seasons came before 2020, when six teams per conference qualified rather than seven.
Three playoff teams from one division has happened 14 times since 2002: seven times in the 18 seasons of the six-team field and seven times in the six seasons since the field grew in 2020. No division has sent four, and only one has sent three in consecutive seasons, the NFC East in 2006 and 2007. The NFC West is trying to be the second. In 2025 Seattle (14-3), the Rams and San Francisco (both 12-5) all made the playoffs and won six playoff games between them, tied with the 2021 NFC West and the 2024 NFC East for the most by one division since 2002. Two of those wins came inside the division, Seattle's 41-6 over San Francisco in the divisional round and 31-27 over the Rams for the conference title, before Seattle beat New England 29-13 in the Super Bowl.
The Simulation, and Whether to Believe It
The site's playoff simulation plays the rest of the season 20,000 times from the board as it stands, holding the ratings fixed and keeping the 65 results already in. Division titles and the three wild cards per conference go by record, and ties are broken at random. It sends three NFC West teams to the playoffs in 54.2% of seasons and all four in 0.1%, so three or more in 54.4%; two in 43.9%, and one in 1.7%. On average the division sends 2.53. No other division comes close: the NFC North sends three or more in 31.2% of seasons, the AFC North in 28.1%, the AFC West in 9.3% and the other four in under 2%.
| Team | Rating | Record | Playoffs | Division title | Expected wins |
|---|---|---|---|---|---|
| Seattle | 1687.5 (1st) | 3-1 | 93.6% | 43.5% | 12.07 |
| San Francisco | 1633.7 (3rd) | 4-0 | 94.7% | 48.4% | 12.27 |
| The Rams | 1598.6 (6th) | 2-2 | 63.4% | 8.2% | 9.98 |
| Arizona | 1389.2 (30th) | 1-3 | 1.1% | 0.0% | 5.46 |
History's two a division and the simulation's 54% look like a contradiction, and the two can be tested against each other. Replay the same simulation from week 5 of every season from 2002 to 2025, with that season's schedule, its first four weeks fixed, the board as it stood and that season's playoff format, and count how often each division sent three. Across the 192 division-seasons the simulations expected 12.94 three-team divisions, and there were 14. The 20 they rated likeliest expected 6.58 and produced eight; the ten likeliest expected 4.46 and produced six, 1.0 standard errors more than expected. Before 2020 the totals were 6.37 expected and seven, and since then 6.58 and seven. Grouped by how many playoff teams each division was expected to send, the averages match to within 0.06 of a team:
| Playoff teams the simulation expected | Division-seasons | The simulation said | Happened |
|---|---|---|---|
| Under 1.5 | 91 | 1.27 | 1.26 |
| 1.5 to 2.0 | 78 | 1.71 | 1.71 |
| 2.0 to 2.3 | 15 | 2.07 | 2.13 |
| 2.3 and up | 8 | 2.47 | 2.50 |
So the count has been right, if anything a little low, and it accounts for the history. Run for the ten strongest trios at the time, the simulation expected them to send 2.04 playoff teams each and 2.20 of the ten to send three; they sent 2.0 each, and one sent three. A strong top three is not a division's whole chance: the fourth team, the schedule, the rest of the conference and the size of the field all count, and eight of those ten played for six places a conference. Run from the same point, the start of week 5, the simulation gave the 2026 NFC West 52.5%, the third-highest of 193 division-seasons since 2002, behind the 2021 NFC West (57.7%, which sent three) and the 2021 AFC West (55.9%, which sent two). Thursday's result in Dallas has since moved it to 54.4%.
The team odds are another matter. Graded the same way, the teams these simulations gave 90% or more made the playoffs 91.0% of the time against 96.0% predicted, those given 70% to 90% made it 70.3% of the time against 80.4%, and those given under 10% made it 9.2% of the time against 3.2%. Shrinking the Playoff Odds found the same simulation too sure of itself after week 1, when teams it put at 90% or better made the playoffs 78.4% of the time, and fitted a repair. Seattle's 93.6% and San Francisco's 94.7% are better read as about nine in ten. Graded by division the simulation has been right; graded by team it has been too sure at both ends, and this page does not establish why the two differ.
Sunday and Monday
All four NFC West teams play this week. The ledger froze its three rows on October 6:
| Game | Kickoff (ET) | The ledger, host | DraftKings, Saturday 08:54 ET, host |
|---|---|---|---|
| San Francisco at Seattle | Sun 16:25 | .6424 | .5934 (Seattle -3, -162 / +136) |
| Detroit at Arizona | Sun 16:25 | .3601 | .3146 (Detroit -5.5, +205 / -250) |
| Buffalo at the Rams | Mon 20:15 | .5080 | .6092 (the Rams -3, -175 / +145) |
Host win probabilities. DraftKings' prices are from ESPN's scoreboard at 08:54 ET on Saturday, October 10, a snapshot that will move before kickoff, not closing prices; moneylines are listed home / away, with the margin removed in proportion. The simulation prices every remaining game with the engine, so it shares the ledger's view of these three, not the market's.
Fixing each game both ways in the simulation, with the same 20,000 seasons each time, separates the title from the count:
| If | Seattle: playoffs / title | San Francisco | The Rams | Three or more NFC West teams |
|---|---|---|---|---|
| As it stands | 93.6% / 43.5% | 94.7% / 48.4% | 63.4% / 8.2% | 54.4% |
| Seattle beats San Francisco | 96.2% / 54.3% | 92.9% / 37.2% | 63.3% / 8.5% | 54.9% |
| San Francisco wins in Seattle | 88.9% / 24.1% | 97.7% / 68.2% | 63.7% / 7.7% | 53.1% |
| The Rams beat Buffalo | 93.1% / 41.9% | 94.3% / 46.8% | 73.0% / 11.3% | 62.4% |
| Buffalo wins in Los Angeles | 94.1% / 44.9% | 95.1% / 50.0% | 53.5% / 5.0% | 46.2% |
| Arizona beats Detroit | 94.3% / 43.5% | 95.2% / 48.4% | 66.1% / 8.2% | 59.1% |
| Detroit wins in Arizona | 93.1% / 43.5% | 94.4% / 48.4% | 62.1% / 8.2% | 52.0% |
Sunday's game in Seattle is about the title. The winner's chance rises to 54.3% for Seattle or 68.2% for San Francisco, and the loser's falls to 37.2% or 24.1%, a swing of 30.2 points for Seattle and 31.0 for San Francisco. It barely moves the count: three or more NFC West playoff teams in 54.9% of seasons if Seattle wins and 53.1% if San Francisco does, because a game inside the division hands one member a win and another a loss. The games that move the count are the ones against everyone else. If the Rams beat Buffalo on Monday night the chance of three rises to 62.4%, and if they lose it falls to 46.2%, a swing of 16.2 points, about nine times as large; Arizona's game against Detroit is worth 7.1. The Six Games That Count Double measured what a division game is worth to a single team's playoff chances; to the division's count, Sunday's is worth 1.8 points.
The prices this morning differ from the ledger most on Monday's game: DraftKings has the Rams at .6092 against the ledger's .5080. Weighting the two Monday rows of the table by that price instead of the ledger's lifts the chance of three to 56.1%. On Sunday's game the price is 4.9 points less sure of Seattle, .5934 against the ledger's .6424, which matters for the title and hardly at all for the count. Three Long Trips in Week 5 looked at the travel in both of the West's other games and found nothing either forecast should add for it.
What This Page Does Not Show
- The official tiebreakers. The simulation breaks ties in record at random. The 2026 NFC West preview derives past champions with the full tiebreaker chain; this page counts playoff places and needs it less, but a close race could be decided by a rule the simulation does not apply.
- Uncertain ratings. The simulation treats each rating as exactly right and never moves it inside a simulated season; Shrinking the Playoff Odds traced the overconfidence of its team odds to that.
- Quarterbacks and injuries. The board reads final scores and nothing else; The Model Cannot See a Quarterback Change measures what that costs.
- Another measure of strength. "Strongest" here means by this board, a scores-only rating that carries part of August with it. The page ranks divisions by nothing else.
- The 2026 format. The simulation assumes seven playoff teams per conference, as in every season since 2020.
- Before 2002. The comparisons start at the realignment that created eight divisions of four.
- One short season. In 2022 Buffalo and Cincinnati played 16 games, one fewer than everyone else, so the replay ranks every season by winning percentage.
- Closing prices. This morning's prices are a snapshot.
- Advice. The page compares forecasts with results. It recommends no wager and links to no sportsbook.
Method and Sources
board          = walk-forward Elo, K 20, 48-point home edge, 1/3 offseason regression   # the ledger's model, replayed from 1999
strength       = mean rating of a division's top three teams, as week 5 began            # 200 division-seasons, 2002-2026
playoff teams  = teams in any postseason game in the file                                 # 12 a season to 2019, 14 from 2020
simulation     = 20,000 seasons, ratings held, played results fixed, seed 2026            # titles and wild cards by winning percentage
graded         = the same simulation from week 5 of 2002-2025, that season's format       # 192 division-seasons, 768 team-seasons
The script make_nfc_west_strength_chart.py replays the engine over 1999-2026, checks that its board as week 5 began and its board now equal the ledger's ratings after week 4 and after Thursday's game, checks the division map against the file's division-game flag and the 65 results of 2026 against ESPN's scoreboards, ranks all 200 division-seasons, reads every playoff field since 2002, runs the 2026 simulation as it stands and with each NFC West game fixed both ways, runs the same simulation from week 5 of every season from 2002 to 2025, and asserts every number on this page.
Sources: the nflverse public game log (games.csv), 1999-2025 from the copy bundled in June, checked identical to a pull at 08:54 ET on October 10, 2026, which also supplies the 2026 schedule and results; ESPN's scoreboards for weeks 1 to 5, the second source for the 2026 scores, and its week-5 scoreboard of October 10 for kickoff times and DraftKings' prices; the site's prediction ledger after the October 9 build.
Further reading
- Two 1-3 Teams Are Favoured Over 3-1 Teams on Sunday: today's companion, the standings against the price
- The 2026 NFC West: Nobody Keeps This Crown: the division's August preview
- Shrinking the Playoff Odds, Tested Out of Sample: the simulation's overconfidence, repaired
- 0-4 and Still 14th: Is the Board Too Slow?: how much the board leans on August
- The Six Games That Count Double: Division Record and the Playoff Race: what a division win is worth to one team
- Remaining Strength of Schedule After Week 4, Measured: every team's last thirteen games, priced
- Elo-Implied 2026 Playoff Odds: 20,000 Seasons from the Frozen Ratings: the simulation, introduced in August
- The Seattle, San Francisco, Rams and Arizona team pages, and the power rankings
Go deeper
Want the code behind these metrics? Work through the 43-chapter NFL analytics tutorial.
Browse tutorials Free tools