Tonight Could Produce the First One
Week 3 opens tonight, Thursday, September 24, with Atlanta at Green Bay. Atlanta is 0-2 and the prediction ledger, frozen on September 22, gives it a 0.2861 chance of winning. So there is a 0.7139 chance that by midnight the league has its first 0-3 team of 2026.
It will certainly have one by Monday. Houston and Indianapolis are both 0-2 and they play each other on Sunday, so unless that game ends in a tie, one of them leaves week 3 without a win. Six more 0-2 teams play someone else.
This page answers two questions from the numbers the site already keeps. What has 0-3 meant, across every season in the bundled game log? And how many 0-3 teams is this week likely to leave? The short answers: 0-3 has ended the season for everyone except Houston, twice; and the ledger's own prices make this a heavier week than usual, with about five 0-3 teams expected against a long-run average of 4.67.
The Exhibit
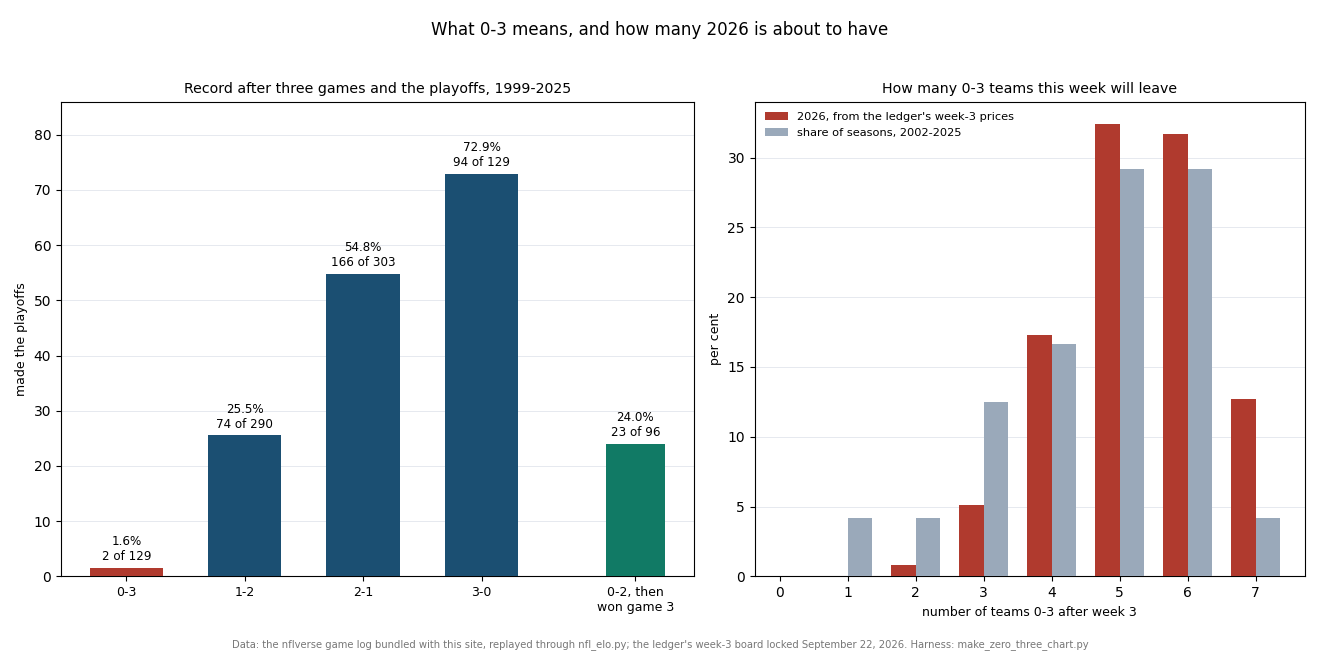
What Three Games Have Meant
The bundled log holds 861 team-seasons from 1999 to 2025. Ten had a tie somewhere in their first three games and are set aside, which leaves 851 teams with a clean record after three games. Here is what each record went on to:
| After three games | Team-seasons | Made the playoffs | Rate |
|---|---|---|---|
| 0-3 | 129 | 2 | 1.6% |
| 1-2 | 290 | 74 of 290 | 25.5% |
| 2-1 | 303 | 166 of 303 | 54.8% |
| 3-0 | 129 | 94 of 129 | 72.9% |
Two out of 129. Both are Houston: the 2018 team, which lost its first three and finished 11-5, and the 2025 team, which lost its first three and finished 12-5. Nobody else in 27 seasons has done it, and the next-best 0-3 finish in the file is nine wins. The average 0-3 team finished with 4.92 wins and played .374 football from game four on; seven of the 129 finished with a winning record.
The playoff field grew from twelve teams to fourteen in 2020, which makes the recent sample the fairer one for a team starting out today. It says the same thing: 25 teams have started 0-3 since 2020 and one of them, Houston last season, reached the postseason.
What Game Three Is Worth to an 0-2 Team
The 0-2 study on this site measured what the first two losses cost. This page looks at the next step: for a team that is already 0-2, how much does game three decide?
A great deal. Of the 96 teams that started 0-2 and then won game three, 23 of 96 made the playoffs, 24.0%. Of the 129 that lost it, two did. One game moved the rate from about one in 65 to about one in four.
The obvious objection is that the teams that won game three were better teams to begin with. The engine lets that be tested, because it records the rating every team carried into every game. Take the 198 0-2 teams since 2002, when the league reached 32 teams, and fit the playoff outcome on the game-three result, first alone and then with the rating the team took into that game:
| Linear probability model, 0-2 teams 2002-2025 | Effect of winning game three | Clustered SE |
|---|---|---|
| Game-three result only | 0.2380 | 0.0422 |
| Holding the pre-game rating fixed | 0.2217 | 0.0398 |
Holding the rating fixed shrinks the effect by only 6.8 per cent. The winners were somewhat better sides, since the engine had priced them at an average of 0.4740 to win game three against 0.3680 for the losers, but the gap in outcomes is almost all the game itself. That matches what the 0-2 study found for the first two games: early results matter mostly because they are already in the standings, not because they reveal who a team was.
The Eight 2026 Teams at 0-2
The league has exactly eight teams at 2-0, eight at 1-1 after a win, eight at 1-1 after a loss and eight at 0-2. Eight 0-2 teams is ordinary; since 2002 the average season has had 8.33. What is unusual is the draw. Four of the eight play 2-0 teams this week, and the ledger makes seven of the eight underdogs:
| 0-2 team | Week 3 | Opponent's record | Ledger's price to win | Chance of 0-3 |
|---|---|---|---|---|
| LA Chargers | at Buffalo, Sunday | 2-0 | 0.2032 | 0.7968 |
| Washington | v Seattle, Sunday | 2-0 | 0.2181 | 0.7819 |
| Tennessee | at NY Giants, Sunday | 1-1 | 0.2853 | 0.7147 |
| Atlanta | at Green Bay, tonight | 1-1 | 0.2861 | 0.7139 |
| Tampa Bay | v Minnesota, Sunday | 2-0 | 0.3599 | 0.6401 |
| Miami | v Kansas City, Sunday | 2-0 | 0.3765 | 0.6235 |
| Indianapolis | v Houston, Sunday | 0-2 | 0.4042 | 0.5958 |
| Houston | at Indianapolis, Sunday | 0-2 | 0.5958 | 0.4042 |
Treating the games as independent, which they are apart from the one Houston and Indianapolis share, the number of 0-3 teams after this week is one (the loser in Indianapolis) plus however many of the other six lose. The expected count is 5.27. Five is the single most likely outcome at 32.4%, six is close behind at 31.7%, seven comes in 12.7% of the time, and four at 17.3%. Fewer than four has a 5.9% chance.
Against history that is a heavy week. From 2002 to 2025 the number of 0-3 teams averaged 4.67 a season, and only once, in 2009, did it reach seven. Put another way: historically 57.3% of 0-2 teams lost game three, and the ledger's prices this week imply 65.9%. The difference is the schedule, not the teams.
Houston is the one to watch. It is the only franchise to reach the playoffs from 0-3, it has done it twice in the last eight seasons, it is 0-2 again, and it is the only 0-2 team the ledger favours this week, at 0.5958 in Indianapolis. The two earlier escapes are not evidence of anything about this one; two cases are too few for that. They are just the whole list.
What This Does Not Tell You
- Two playoff teams out of 129 is a count, not a rate you can lean on. The 1.6% could easily be 0.5% or 3% in another 27 seasons. What is solid is the size of the step from 1-2 to 0-3.
- The week-3 forecast uses frozen prices. These are the probabilities locked on September 22. They do not know about injuries since then, and the ledger is well calibrated but not sharp, so the market may price some of these games differently.
- Formats are pooled. The history mixes the twelve-team playoff (through 2019) with the fourteen-team field, and 16-game seasons with 17. The table since 2020 is small but points the same way.
- "First three games" means by date. A team with an early bye still has its first three games counted, whatever weeks they fell in.
Related
- The 0-2 Hole Is Mostly the Two Games — the same question one game earlier.
- Week 3's Leverage Board — how much each week-3 result moves the playoff picture.
- How Low Is 1314.6? — the lowest-rated of the eight, measured against sixteen seasons.
- Does Winning the Opener Mean Anything? — the one-game version.
- Honest, Not Sharp — how far to trust the ledger's week-3 prices.
- The prediction ledger — every frozen probability and its grade.
Reproducibility
Every figure here is computed by make_zero_three_chart.py from the nflverse game log bundled with the site (data/games.csv), replayed through nfl_elo.py, and from the published ledger's week-3 board, locked September 22. Written September 24, 2026, before Atlanta at Green Bay kicked off. The script runs 88 assertions before it draws the chart, including every count in both tables, the two Houston seasons, the regression coefficients, each 0-2 team's week-3 price, and that the expected number of 0-3 teams equals one plus the six independent loss probabilities. Nothing on the page is typed in by hand.
Go deeper
Want the code behind these metrics? Work through the 45-chapter NFL analytics tutorial.
Browse tutorials Free tools