Eleven of Sixteen
Week 3 is graded. The prediction ledger froze its sixteen week-3 picks on September 22, and eleven of them won. The week's Brier score, the average squared distance between each frozen probability and the result, is .2259, against the .2181 the ledger's own probabilities expected. Five picks missed, where the probabilities allowed for 5.63.
By the count, that was the most ordinary outcome available. The exact distribution of the week made eleven the single most likely number of correct picks, at 20.38% against 20.35% for ten, and gave eleven or better 48.3%. By the Brier score the week ran slightly worse than expected, because the misses were expensive. Seattle at Washington was the costliest row: the ledger had Seattle at 78.2%, Washington won 33-31, and that one game scored .6114. Atlanta at Green Bay, graded on its own page the day after it was played, cost .5097. Together the five misses account for .1337 of the week's .2259 and the eleven hits for .0921.
The more interesting number is what the betting market scored on the same sixteen games. Its closing favourites went nine of sixteen, its Brier score was .2541, and the two games in which it and the ledger picked different winners both went the ledger's way. This page grades the week, sets it against 277 weeks of the same comparison since 2010, and asks what a good week against the market has ever been worth.
The Exhibit
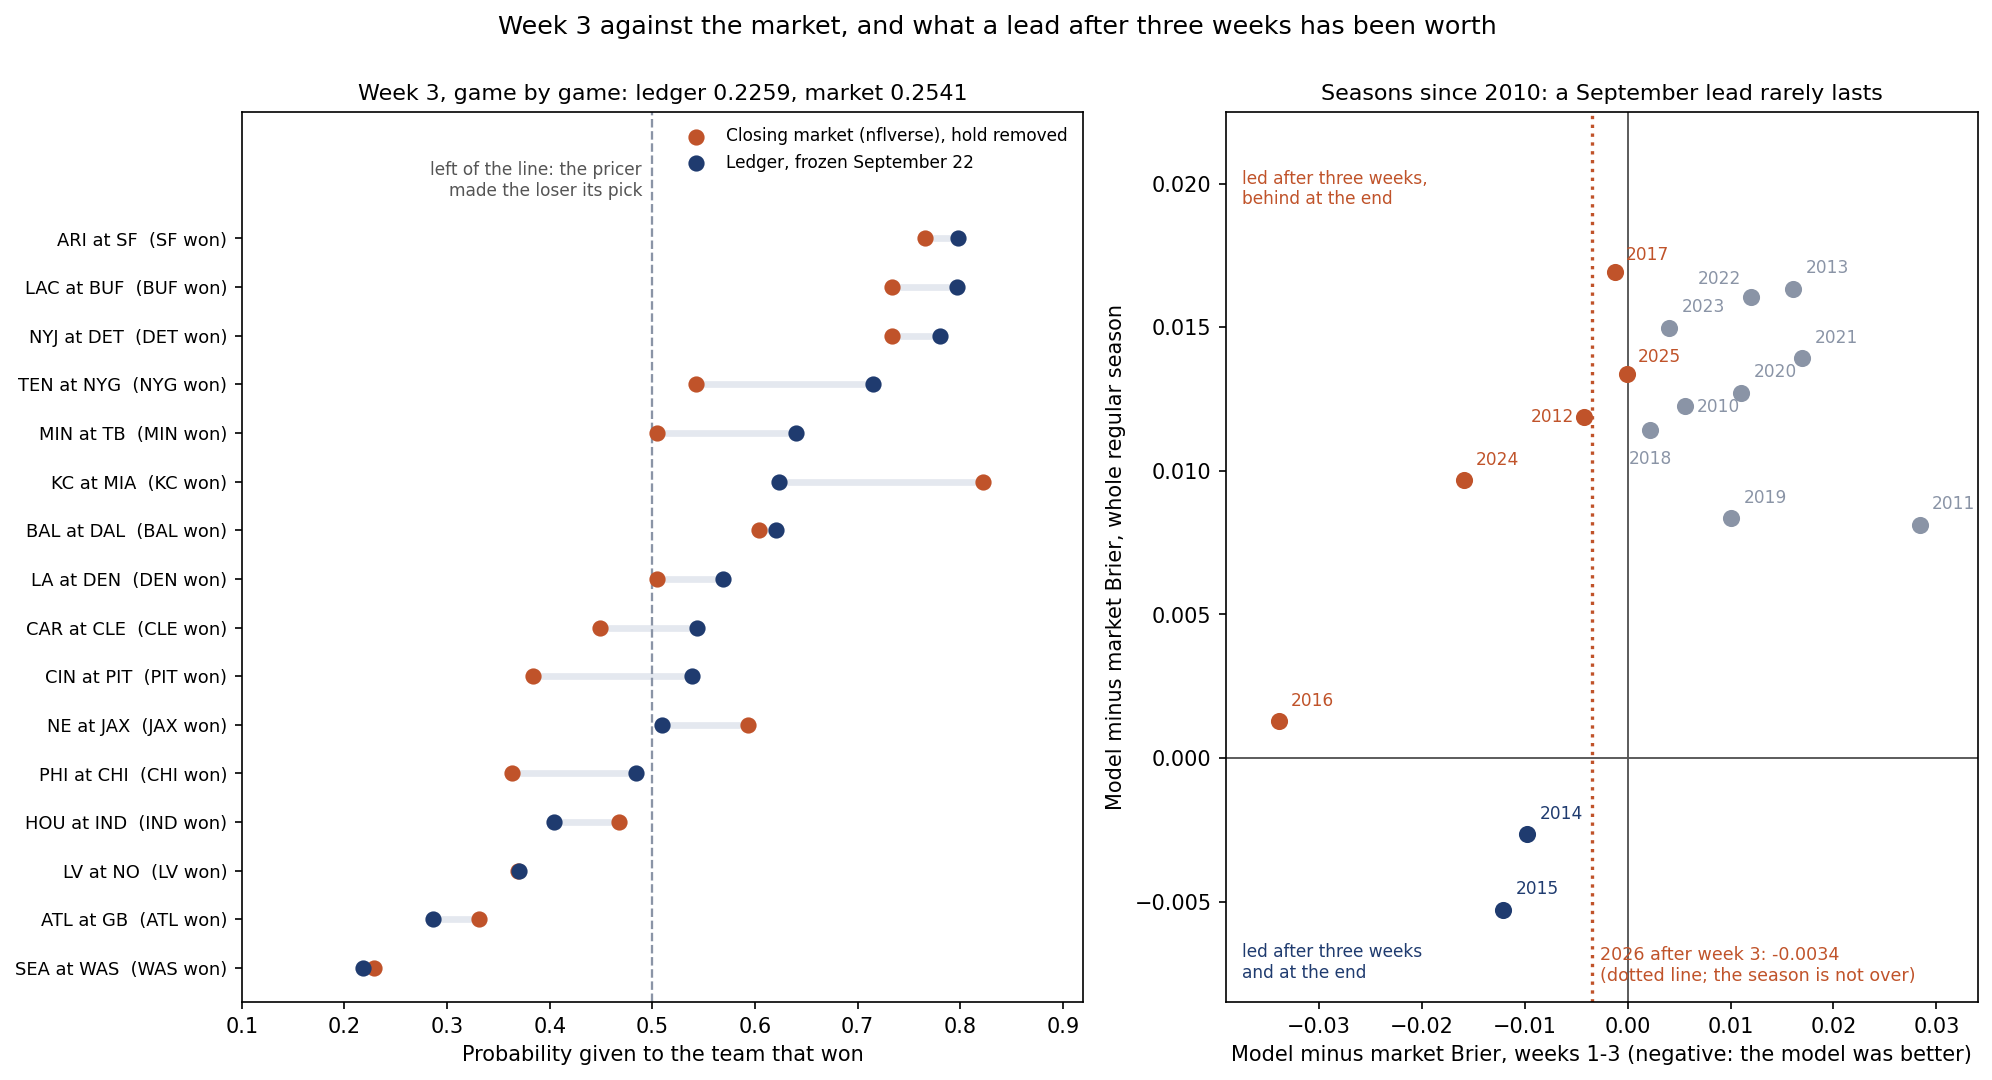
The Sixteen Games
Each row gives the ledger's pick, the probability it froze for that team, and the closing market's probability for the same team.
| Game | Ledger's pick | Ledger | Market, close | Final |
|---|---|---|---|---|
| Atlanta at Green Bay | Green Bay | 71.4% | 66.9% | Atlanta 35-14 (miss) |
| Carolina at Cleveland | Cleveland | 54.4% | 44.9% | Cleveland 21-18 |
| Cincinnati at Pittsburgh | Pittsburgh | 53.8% | 38.4% | Pittsburgh 30-27 |
| Houston at Indianapolis | Houston | 59.6% | 53.2% | Indianapolis 19-17 (miss) |
| Kansas City at Miami | Kansas City | 62.4% | 82.2% | Kansas City 24-10 |
| The Chargers at Buffalo | Buffalo | 79.7% | 73.4% | Buffalo 24-16 |
| New England at Jacksonville | Jacksonville | 51.0% | 59.3% | Jacksonville 35-6 |
| The Jets at Detroit | Detroit | 78.0% | 73.4% | Detroit 31-24 |
| Seattle at Washington | Seattle | 78.2% | 77.2% | Washington 33-31 (miss) |
| Tennessee at the Giants | The Giants | 71.5% | 54.3% | The Giants 12-7 |
| Arizona at San Francisco | San Francisco | 79.8% | 76.6% | San Francisco 36-30 |
| Minnesota at Tampa Bay | Minnesota | 64.0% | 50.4% | Minnesota 23-16 |
| Baltimore at Dallas | Baltimore | 62.1% | 60.4% | Baltimore 34-31 |
| Las Vegas at New Orleans | New Orleans | 63.0% | 63.1% | Las Vegas 35-27 (miss) |
| The Rams at Denver | Denver | 56.9% | 50.4% | Denver 30-26 |
| Philadelphia at Chicago | Philadelphia | 51.6% | 63.7% | Chicago 27-7 (miss) |
Baltimore and Dallas met at a neutral site, so neither side received the home edge. The five misses, in order of the ledger's confidence: Seattle (78.2%), Green Bay (71.4%), New Orleans (63.0%), Houston (59.6%) and Philadelphia (51.6%).
Against the Market, Twice
Two market boards are available for the week. The site saved DraftKings' week-3 prices from ESPN's public scoreboard early on Wednesday, September 23, before any week-3 game had been played, and the nflverse game file carries every game's closing moneylines. With the bookmaker's margin removed, the Wednesday board scored .2600 and the closing board .2541, against the ledger's .2259. The Wednesday favourites went eight of sixteen, the closing favourites nine of sixteen, and the ledger's picks eleven.
The difference came from the games where they disagreed. At the close the market and the ledger picked different winners twice, both times with the ledger on the home team. In Carolina at Cleveland the close had Carolina at 55.1%, and Cleveland won 21-18. In Cincinnati at Pittsburgh the close had Cincinnati at 61.6%, and Pittsburgh won 30-27. On Wednesday there had been a third disagreement, the Rams at Denver, where the market had the Rams favoured and moved to Denver by kickoff; Denver won.
Game by game, the ledger scored better than the close on eleven of the sixteen, one of them, Las Vegas at New Orleans, by .0009. Its largest gains came in Cincinnati at Pittsburgh (.1667), Philadelphia at Chicago (.1391), where both pricers took Philadelphia and the ledger was less sure of it, and Tennessee at the Giants (.1277). The market's largest came in Kansas City at Miami, where it had Kansas City at 82.2% to the ledger's 62.4% and gained .1102. Over the week the ledger finished .0282 ahead of the close and .0341 ahead of the Wednesday board.
How Rare a Week Like This Is
To see how often that happens, the same engine that writes the ledger was replayed over every regular-season game since 2010 that carries both closing moneylines, 4,174 games, with the model blind to the prices. Over that span the market's Brier score is .2104 and the model's .2205, about a hundredth of a point a game in the market's favour, the gap What a 60% Pick Is Worth reported before the season. Split into weeks, the model beat the close in 96 of 277, or 34.7%, about one week in three. Only 15 of the 277 weeks were better for the model than this one, so week 3 would rank 16th of 278, inside the best 6%.
What a week like this does not do is predict the next one. Across the 261 pairs of consecutive weeks, the correlation between one week's model-minus-market score and the next week's is .042, with a 95% interval from -.08 to .16. The average week favours the market by .0099, and that remains the best forecast for week 4 whatever happened in week 3. This is the market version of the finding in The Model Has No Good Years, Only Lucky Ones: a week of results is a draw, not a reading.
The Season, and the Budget
Through the Monday game of September 28, 2026, the ledger reads 31 of 48 with a Brier score of .2293, against the .2204 its own probabilities expected and the 0.2205 the engine scored over the 4,363 games of its backtest. The closing market's Brier on the same 48 games is .2327, so the ledger leads the market for the season by .0034. It trailed by .0115 after week 1, when the closing favourites went twelve of sixteen, and by .0089 after week 2. Week 3 turned it around.
The miss budget is the count that does not depend on anyone else's prices. The budget page opened the season at 99.11 expected misses across 272 games, and each graded week subtracts what its frozen rows expected and adds what happened. Week 1 expected 6.09 misses and delivered six, which left 99.02, the figure the week-1 grading note reported. Week 2 expected 5.22 and delivered six, which raised it to 99.81. Week 3 expected 5.63 and delivered five:
99.11 - (6.0868 + 5.2152 + 5.6265) + (6 + 6 + 5) = 99.11 - 16.9285 + 17 = 99.1815The season reads 99.18, seven hundredths above where it opened. Seventeen misses in 48 games sits near the middle of what the probabilities allowed: they expected 31.07 correct picks, and gave 17 or fewer misses a 57.5% chance.
What a September Lead Has Been Worth
A lead after three weeks has happened before. In seven of sixteen seasons since 2010 the model was ahead of the closing market after week 3: 2012, 2014, 2015, 2016, 2017, 2024 and 2025, the last by less than a ten-thousandth. Two of the seven were still ahead at the end of the regular season, 2014 by .0026 and 2015 by .0053, and no season that trailed after three weeks finished ahead. The largest early lead, 2016's .0339, ended .0013 behind.
The same history shows why early leads are common. The gap has been smallest at the start of the season: over the first three weeks of 2010-2025, 767 games, the market was better by .0018 a game, and from week 4 on, 3,407 games, by .0119. The early gap was the smaller of the two in 13 of 16 seasons, a paired t of -2.57, and week 3 is the only one of the eighteen weeks in which the model has been better on average, by .0050 a game. That pattern turned up in this analysis rather than being predicted, so it is a lead for later work, not a finding. One reading consistent with it is that the market's September prices still rest on preseason opinion, and its edge grows as in-season information accumulates that it can use and the engine cannot, such as a change at quarterback. Nothing on this page tests that.
For 2026 the lead is small in absolute terms. Summed over 48 games, .0034 a game is .1652 of Brier score, and at the post-week-3 average of .0119 a game in the market's favour that is used up in about fourteen games, less than one week of football.
Not in the Ledger
Week 4 began on Thursday, October 1, 2026, with Cleveland 27, Pittsburgh 24, a score confirmed by both the nflverse file and ESPN's scoreboard. That game has no row in the ledger. The week-4 rows were generated after it had been played, and the ledger never prices a game after the fact, so it will never be graded. The same applies to the week's one Sunday-morning game. Every season figure on this page runs through September 28.
What This Page Does Not Show
- Whether the week was skill. The per-game differences between the two Brier scores scatter widely enough that the week's .0282 carries a standard error of .0210, so the margin is 1.3 standard errors from a tie, and the history above says it carries almost nothing forward.
- The best possible market. The closing moneylines come from the nflverse file and the Wednesday prices from one bookmaker; the margin was removed proportionally, and other methods move the market's numbers by small amounts.
- A pre-registered test. The weekly comparison and the early-season split were run after week 3 was known. The 2026 probabilities were frozen before the games; the backtest's were computed afterwards.
Method and Sources
brier(week)     = mean((p_home - home_won)^2)                     # the ledger's rows as frozen
market p_home   = q(home ML) / (q(home ML) + q(away ML))          # q = implied probability; margin removed
gap(week)       = brier(ledger) - brier(market)                   # negative: the ledger was better
budget(season)  = 99.11 - sum(min(p, 1 - p) over graded rows) + misses
The script make_week3_graded_chart.py re-derives every ledger grade from the scores, checks all 48 results against the nflverse file and the sixteen week-3 results against ESPN, reproduces the opening budget of 99.11 from the published ratings, prices both market boards, replays the engine over 2010-2025, and asserts every number on this page. It also checks that no game played on or after October 4 enters any figure.
Sources: the nflverse public game log (games.csv), pulled on October 4, 2026, for the 2026 scores and closing moneylines, with its 1999-2025 rows checked identical to the copy bundled in June; the site's own prediction ledger, whose week-3 picks were frozen on September 22; ESPN's public NFL scoreboard, pulled on September 23 for DraftKings' week-3 prices and on October 4 for the final scores, with no custom user agent.
Further reading
- Boom or Bust Is Not a Trait: Monday night's Atlanta at New Orleans, and why Atlanta's erratic start does not change the price
- The Miss Budget: where the 99.11 comes from
- What a 60% Pick Is Worth: the model against the market over 4,174 games
- The Model Has No Good Years, Only Lucky Ones: why a week says little about a season
- A Worse Score Is Not a Worse Model: the week-2 grading note
- Atlanta 35, Green Bay 14: week 3's Thursday game, graded on its own
- Denver's Home Field, Measured: the Sunday-night pick the market disagreed with on Wednesday
- The Model Cannot See a Quarterback Change: information the market has and the engine lacks
- The Prediction Ledger: every frozen pick and its grade
Go deeper
Want the code behind these metrics? Work through the 43-chapter NFL analytics tutorial.
Browse tutorials Free tools