Lost, Then Won
Green Bay hosts Atlanta tonight at 1-1. It got there the harder-sounding way: it lost 39-22 at Minnesota in week 1, then won 20-17 at the Jets in week 2. Detroit is also 1-1, but won first and lost second. The standings print both as 1-1. The usual commentary does not treat them the same: one team is "bouncing back", the other "coming back to earth".
This page tests whether the order carries any information. It uses every 1-1 start in the bundled game log from 1999 to 2025, the engine's pre-game prices, and the closing spreads the same file carries. The short answer: by the end of the season the order is invisible. In the very next game there is a small lean toward the team that won most recently, and it is too small to separate from noise.
First, Why 2026 Is 8-8-8-8
After two weeks the league splits exactly evenly: eight teams at 2-0, eight 1-1 teams that won first (call them W-L), eight 1-1 teams that lost first (L-W) and eight at 0-2. That looks like a coincidence. Half of it is arithmetic.
Every decided game hands out one win and one loss. Week 1 produced sixteen winners, and those sixteen are either 2-0 or W-L, so 2-0 plus W-L is sixteen. Week 2 produced sixteen winners too, and they are either 2-0 or L-W, so 2-0 plus L-W is also sixteen. Those two facts force W-L to equal L-W, and then 0-2 has to equal 2-0. With no ties and every team playing both weekends, the only free number in the table is how many teams are 2-0. The rest follow from it.
That number has ranged from six to eleven. In the 21 seasons since 2002 where the identity holds, it was eight five times, and the table came out exactly 8-8-8-8 in 2002, 2003, 2010, 2013 and 2016. The three seasons where the identity fails show the exceptions it assumes away: 2017, when Tampa Bay and Miami opened in week 2, so their first two games straddle weeks 2 and 3; 2018, with two ties in the first two weeks (Pittsburgh-Cleveland and Minnesota-Green Bay); and 2022, with the Indianapolis-Houston tie.
The Exhibit
By the End of the Season, Nothing
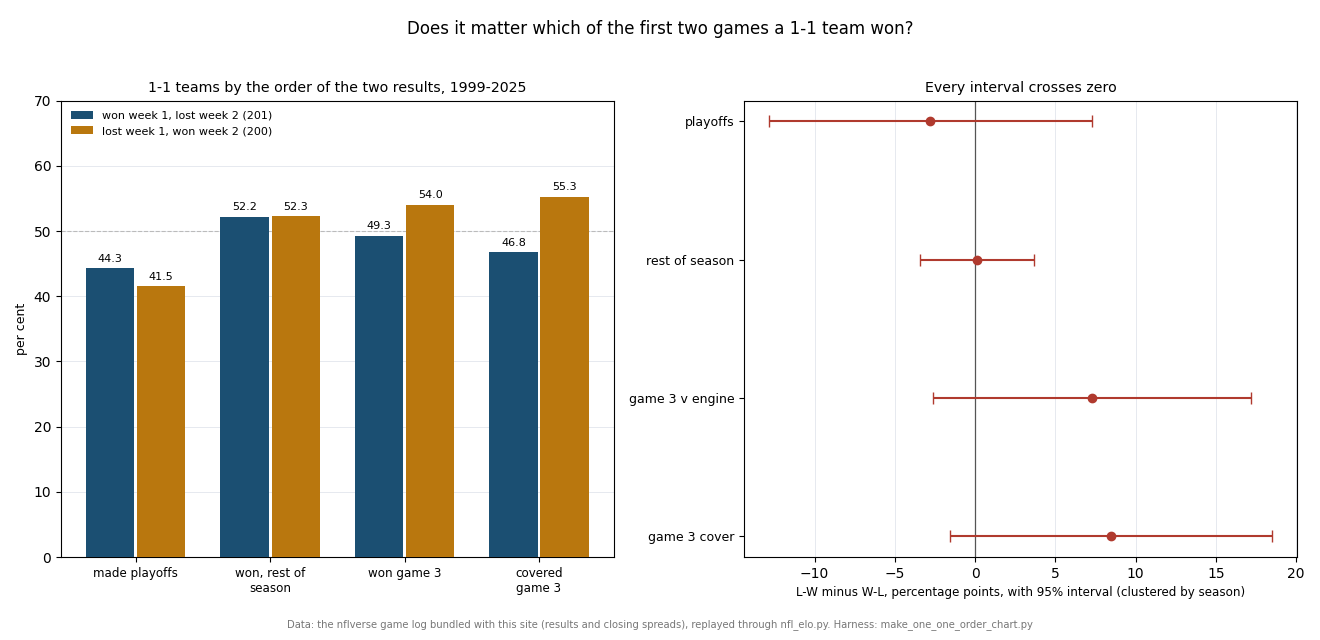
From 1999 to 2025 there are 853 team-seasons whose first two games were both decided. Of those, 201 went W-L and 200 went L-W. Here is how the two orders finished:
| 1-1 start | Teams | Made the playoffs | Won, rest of season | Final wins |
|---|---|---|---|---|
| Won week 1, lost week 2 (W-L) | 201 | 89 of 201, 44.3% | .522 | 8.40 |
| Lost week 1, won week 2 (L-W) | 200 | 83 of 200, 41.5% | .523 | 8.42 |
The two orders played the rest of the season to within 0.0012 of each other. The playoff rates differ by 2.8 points, in favour of the teams that won first, with a standard error of 5.1 points. That is noise. Holding the rating each team took into game three fixed does not change the picture: the rest-of-season gap stays under one standard error.
The Next Game Is Where It Shows, Faintly
Game three is the one place the order seems to show up. Going in, the engine rated the W-L teams slightly higher on average (1511.0 against 1503.3) and priced them at 0.5217 to win, against 0.4962 for the L-W teams. The results ran the other way: the W-L teams won 0.4925 of their game threes and the L-W teams 0.5400.
The market did no better. Every one of the 401 game threes carries a closing spread. It made the W-L teams 0.75-point favourites on average and the L-W teams a pick'em, and the L-W teams beat that number more often: they covered 55.3% of the time against 46.8%, and averaged +1.47 points against the spread where the W-L teams averaged −0.68.
So both the engine and the market lean slightly the wrong way on a team's most recent result. But the size matters more than the direction. With standard errors clustered by season, the three game-three gaps are 1.45, 1.62 and 1.66 standard errors from zero. None clears two. They are also three views of the same 401 games, so they are not three separate pieces of evidence. It is the kind of pattern that appears in any sample this size and then disappears in the next one. By the end of the season it has disappeared in this one too.
The Sixteen 1-1 Teams in Week 3
Here are this year's sixteen 1-1 teams with the ledger's frozen week-3 prices. Five of the sixteen games pit two 1-1 teams against each other. Between them, the ledger expects the W-L eight to win 4.07 games this week and the L-W eight 4.21, a gap that comes from the schedule, not from the order.
| Team | Order | Week 3 | Ledger's price |
|---|---|---|---|
| Green Bay | L-W | v Atlanta (0-2), tonight | 0.7139 |
| New Orleans | L-W | v Las Vegas (2-0) | 0.6302 |
| Denver | L-W | v LA Rams (L-W) | 0.5692 |
| Cleveland | L-W | v Carolina (L-W) | 0.5437 |
| New England | L-W | at Jacksonville (W-L) | 0.4904 |
| Carolina | L-W | at Cleveland (L-W) | 0.4563 |
| LA Rams | L-W | at Denver (L-W) | 0.4308 |
| Dallas | L-W | v Baltimore (W-L), in Rio de Janeiro | 0.3790 |
| Detroit | W-L | v NY Jets (W-L) | 0.7803 |
| NY Giants | W-L | v Tennessee (0-2) | 0.7147 |
| Baltimore | W-L | v Dallas (L-W), in Rio de Janeiro | 0.6210 |
| Pittsburgh | W-L | v Cincinnati (2-0) | 0.5382 |
| Jacksonville | W-L | v New England (L-W) | 0.5096 |
| Chicago | W-L | v Philadelphia (2-0), Monday | 0.4837 |
| NY Jets | W-L | at Detroit (W-L) | 0.2197 |
| Arizona | W-L | at San Francisco (2-0) | 0.2017 |
If the historical lean were real, the L-W teams would beat these prices by a few points this week and the W-L teams would fall a few points short. Sixteen games cannot show that either way, and the history says not to expect it to. The ledger will grade all sixteen by Monday night.
What This Does Not Tell You
- A 1.6-standard-error pattern is not a finding. The game-three lean is reported because it is what the data show, not because it survives. Anyone betting on it is betting on noise.
- The order is not the only difference between these teams. W-L teams tend to have won an opener and lost to a stronger week-2 opponent, and the reverse. The rating control handles some of that, not all of it.
- The closing spread comes from the game file. It is the line the nflverse data record, not a price anyone could necessarily have taken at kickoff.
- Ties are set aside. Eight team-seasons with a tie in the first two games are left out, and the identity section excludes the three seasons it does not fit.
Related
- What 0-3 Means — the other end of this week's table, and the game Green Bay plays tonight.
- The 0-2 Hole Is Mostly the Two Games — how many of the first two a team wins, rather than the order.
- The week-2 overreaction test — how far the market moves after a week-1 surprise.
- Win and loss streaks — the longest runs in the file.
- Week 3's Leverage Board — which of these sixteen games moves the playoff picture most.
- The prediction ledger — every frozen probability and its grade.
Reproducibility
Every figure here is computed by make_one_one_order_chart.py from the nflverse game log bundled with the site (data/games.csv, including its closing spreads), replayed through nfl_elo.py, and from the published ledger's week-3 board, locked September 22. Written September 24, 2026, before week 3 kicked off. The script runs 74 assertions before it draws the chart, including the identity and the three seasons it fails, every count and rate in the tables, the season-clustered standard errors, and each 1-1 team's week-3 price. Nothing on the page is typed in by hand.
Go deeper
Want the code behind these metrics? Work through the 45-chapter NFL analytics tutorial.
Browse tutorials Free tools