A Close 0-4 and a Moving Price
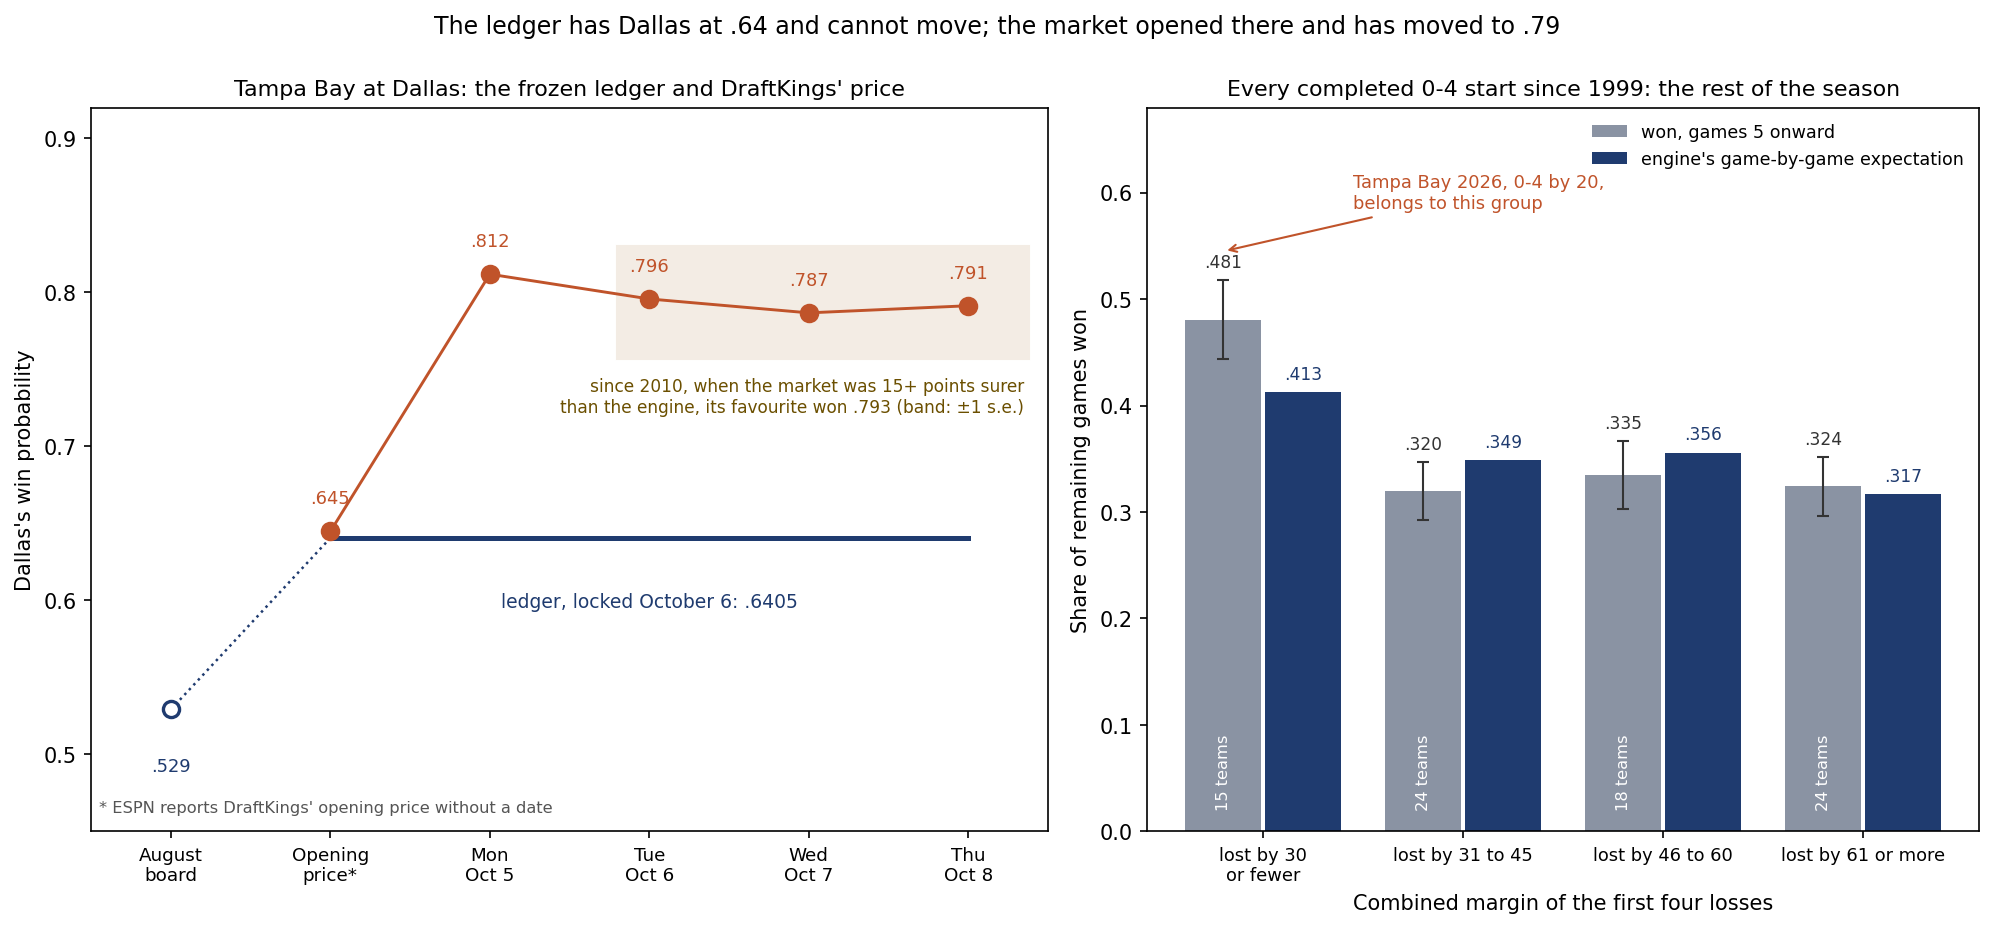
Tampa Bay plays at Dallas on Thursday, October 8, at 20:15 ET at AT&T Stadium, the first game of week 5. The prediction ledger's row for the game, locked on October 6, has Tampa Bay at 1423.0, 26th on the board, and Dallas at 1475.4, 20th: 52.4 rating points apart, and 100.4 once Dallas's 48-point home edge is counted. That makes Dallas a .6405 favourite, worth Dallas by 4.2 points on the scale that What a 60% Pick Is Worth fitted to the file.
DraftKings, as shown on ESPN's scoreboard at 08:22 ET this morning, has Dallas -8.5 at -470/+360, a vig-free .7914, 15.09 points above the ledger, and the nflverse file carries the same prices. The opening price ESPN reports was Dallas -3.5 at -205/+170, a vig-free .6447, 0.42 points from the ledger. The two pricers started in the same place. One of them has moved since and the other, by design, cannot.
The Exhibit
The Price, Four Mornings
| DraftKings on ESPN's scoreboard | Line | Moneylines (DAL / TB) | Dallas, vig-free | Points above the ledger |
|---|---|---|---|---|
| Opening price (undated) | Dallas -3.5 | -205 / +170 | .6447 | +0.42 |
| Monday, 07:13 ET | Dallas -10 | -550 / +410 | .8119 | +17.14 |
| Tuesday, 10:07 ET | Dallas -9.5 | -485 / +370 | .7958 | +15.53 |
| Wednesday, 07:57 ET | Dallas -8.5 | -455 / +350 | .7867 | +14.62 |
| Thursday, 08:22 ET | Dallas -8.5 | -470 / +360 | .7914 | +15.09 |
By Monday morning the market had Dallas by 10, a vig-free .8119, and it has eased back a point and a half since, with the total at 47.5 on all four mornings. The move from the opening price is 14.7 points of probability; three of week 5's other games have moved further. On the fair-prices scale the vig-free .7914 is worth 9.5 points, a point more than the posted line, whose 8.5 maps to .7660; a moneyline and a spread are separate prices and need not agree exactly.
The ledger's number is arithmetic on two ratings that have not moved since Monday night and will not move before kickoff. Had the game been priced on the August board, Tampa Bay at 1488.4 and 18th, Dallas at 1460.7 and 22nd, Dallas would have been a .5292 favourite, about a point. Four weeks of results moved the engine 3.2 points toward Dallas. The market has moved further, on information the engine does not read.
Four Losses by Twenty Points
Tampa Bay lost 33-27 at Cincinnati, then 23-19 to Cleveland, 23-16 to Minnesota and 17-14 to Green Bay, all three at home: four losses by 3 to 7 points, 20 in all. The engine had made Tampa Bay the favourite against Cleveland, at .6585, and by a hair against Green Bay, at .5033. Each loss cost between 13.9 and 20.2 rating points, and the team fell from 1488.4 in August to 1423.0, 26th. Last season it went 8-9.
Of the 86 teams to start 0-4 since 1999, five of them this season, Tampa Bay's 20 points is tied for the second-narrowest margin. 2011 Minnesota lost its four by 19 in all; 2005 Green Bay and 2012 New Orleans lost theirs by 20. Only 2011 Minnesota also lost all four by seven points or fewer, and it finished 3-13. This season's other 0-4 teams lost their four by 25 (Houston), 28 (Tennessee), 39 (the Chargers) and 55 (Miami).
Dallas is 2-2 at +10. It lost 28-20 at the Giants, beat Washington 37-20 at home, lost 34-31 to Baltimore at a neutral site and won 34-30 at Houston, and its rating has risen 14.7 points since August, from 1460.7 to 1475.4. Last season Dallas went 7-9-1.
Does a Narrow 0-4 Mean Anything?
A team that loses four games by a combined 20 points looks unlucky, and the natural question is whether it will play better from here than its record. Part of the answer is already in the rating: the engine's margin multiplier charges less for a four-point loss than for a twenty-point one, so the narrowness is priced in. The file can test whether that is enough. For the 81 completed 0-4 starts from 1999 to 2025, each team's remaining games can be set against what the engine expected, game by game, as the season went:
| Combined margin of the four losses | Teams | Remaining games | Won | The engine expected | Average final wins |
|---|---|---|---|---|---|
| 30 or fewer | 15 | 181 | .481 | .413 | 5.8 |
| 31 to 45 | 24 | 291 | .320 | .349 | 3.9 |
| 46 to 60 | 18 | 218 | .335 | .356 | 4.1 |
| 61 or more | 24 | 290 | .324 | .317 | 3.9 |
Across all 81 the teams won .354 of their 980 remaining games, against .353 from the engine. The 15 narrowest did better, .481 against .413, 6.8 points above the engine's number and 1.8 standard errors from it; the other three groups finished within three points of the engine, two of them below it. A single group landing that far from its price is not rare: with four groups, at least one does so by chance about one time in four.
The test that needs no grouping finds little. Across all 81, each 20 points of narrower margin moved the rest of the season against the engine's expectation by .007 of a win a game, 0.6 standard errors from nothing. Without the engine the relationship is stronger, .032 a game per 20 points at 1.9 standard errors, which is the margin multiplier doing its job: most of what a narrow 0-4 says, the rating has already heard. Two of the 81 reached nine wins and none more, 2004 Buffalo and the 2017 Chargers, both 0-4 by 22 or fewer and both 9-7.
So the history offers Tampa Bay a hint and no promise. Its 1423.0 already reflects the margins of its four losses.
When the Market Is This Much Surer
The file can say which of the two numbers has been the better guide in games like this one. From 2010 to 2025 there are 4,174 regular-season games with a closing moneyline in it. In 121 of them the vig-free closing price was at least 15 points surer of the same favourite than the engine was. Those favourites won .793 of the time, against .765 from the market and .573 from the engine, and the market's Brier score was .1624 against the engine's .2087. A gap this wide in this direction is unusual, 2.9% of the 4,174 games, and when it has happened the market has been the better price, by a wide margin. Today's companion page sets every kind of disagreement on this week's board against the same history.
Both numbers favour Dallas, so the ledger's pick will be graded on the side the market also chose. What the gap changes is the score. A Dallas win scores .1292 for the ledger's .6405 and .0435 for this morning's .7914; a Tampa Bay win scores .4102 and .6263.
What the Result Moves
Run through the site's 20,000-season simulation, with the 64 results so far fixed and the ratings held where they are, the game moves 39.3 points of playoff probability: 20.6 between the two teams and 18.7 among the thirty who are not playing.
Dallas makes the playoffs in 26.8% of simulated seasons today, 32.1% with a win and 17.0% with a loss, and wins the NFC East in 20.5%, 24.5% and 13.0%. Tampa Bay makes the playoffs in 5.7% today, 9.2% with a win and 3.8% with a loss; it wins the NFC South in 5.5%, 8.7% and 3.6%. The largest effect on a team not playing falls on Philadelphia, which makes the playoffs in 54.7% of seasons if Dallas wins and 59.1% if Tampa Bay does, and the next on the Giants, 3.6 points. Weighted by the ledger's .6405, the two branches average back to today's board within a tenth of a point for every team, the check that the two runs are coherent.
The Series in Dallas
Tampa Bay has played eight regular-season games in Dallas since 1999, and Dallas won six. Tampa Bay's two wins there, 10-6 in 2001 and 19-3 in 2022, both came as the favourite, and the closing favourite won seven of the eight. The most recent was on December 22, 2024, a 26-24 Dallas win as a 4.5-point underdog. The one previous Thursday meeting in Dallas was Thanksgiving 2006, Dallas 38-10.
What This Page Does Not Show
- Who plays quarterback. The engine reads final scores only, with no rosters, injuries or quarterbacks, and this page names no starter for either team. The market reads all of that, and its move from the opening price is its own account of something this page cannot see. The page does not explain it; The Model Cannot See a Quarterback Change measures that blind spot in general.
- When the market moved. ESPN's scoreboard reports DraftKings' opening price without a date, so the page can say only that the move had happened by Monday morning.
- A verdict on the game. The ledger's .6405 will be graded on the result; one game cannot settle which price was right.
- A full simulation. The 20,000 seasons hold every rating fixed for the rest of the year and break ties at random rather than by the league's tiebreakers.
- Small samples. The narrow 0-4 group is 15 teams and the market-surer class 121 games. The regression on margin, which needs no grouping, is the check that does not depend on where the groups are cut.
Method and Sources
p(home)          = 1 / (1 + 10 ** (-(rating home + 48 - rating away) / 400))   # the engine; no home edge at a neutral site
fair spread      = (ln(p / (1 - p)) + 0.0265) / 0.14262                         # the fair-prices fit, inverted
vig-free price   = implied(home) / (implied(home) + implied(away))               # implied(-470) = 470 / 570
market surer     = market favourite's vig-free price - the engine's probability for the same team, at least .15
narrow 0-4 test  = (remaining wins - the engine's game-by-game expectation) / remaining games, regressed on the margin
The script make_tb_dal_thursday_chart.py replays the engine over 1999-2025 and the 64 games of 2026 final through Monday, checks its ratings against the ledger's published ones for all 32 teams, reproduces the frozen .6405, prices the game on the August board, reads the four DraftKings snapshots, finds every 0-4 start since 1999 with the engine's expectation for the rest of its season, finds the 121 market-surer games, runs the simulation both ways and asserts every number on this page. It names no quarterback.
Sources: the nflverse public game log (games.csv), 1999-2025 from the copy bundled in June and 2026 from a pull on October 8, 2026, whose 1999-2025 rows were checked identical; ESPN's scoreboards for weeks 1 to 4, pulled October 8, whose 64 final scores match the file's, and for week 5 on October 5, 6, 7 and 8 for the venue and DraftKings' prices; the site's prediction ledger as published on October 6.
Further reading
- Week 5: Where the Ledger and the Market Disagree: today's companion, every week-5 game against the same history
- Houston at Tennessee: Two 0-4 Teams, 217.7 Points Apart: what 0-4 has meant since 1999
- 0-4 and Still 14th: Is the Board Too Slow?: whether the board moves fast enough after four games
- The Model Cannot See a Quarterback Change: the engine's largest blind spot, measured
- One-Score Records Are Luck: The Year-After Test Close-Game Heroes Keep Failing: close games and what they predict
- What a 60% Pick Is Worth: The 2026 Openers at Fair Prices: the fit that turns a probability into a spread
- The Tampa Bay Buccaneers and Dallas Cowboys team pages, and the power rankings
Go deeper
Want the code behind these metrics? Work through the 43-chapter NFL analytics tutorial.
Browse tutorials Free tools