The Forecast
On September 6 this site published The First Four Games, Priced. It took every team's weeks 1 to 4 and priced each game from the frozen August ratings with the arithmetic the prediction ledger uses: the rating gap plus a 48-point home edge, waived at the three neutral sites, Melbourne in week 1, Rio in week 3 and London in week 4. One of its sections was written for today: what the board expected the standings to say on October 5. Multiplying each team's four probabilities, it expected 2.41 teams at 4-0 and 2.44 at 0-4.
It also named names. Seattle was the likeliest 4-0 at 29.3%, then Baltimore at 20.3% and Houston at 19.0%. Arizona was the likeliest 0-4 at 27.5%, ahead of the Jets at 23.3% and Las Vegas at 20.5%. This page grades that published table. The replay behind it rebuilds the August board from the game log, matches the ratings frozen into the ledger's week-1 rows, and reproduces all 32 rows of the September table to the decimal shown.
What Happened
Thirty of the 32 teams have played four games. Atlanta and New Orleans are both 1-2 and meet on Monday night, so neither can finish its opening four at 4-0 or 0-4, and both counts are already final: three teams at 4-0 and five at 0-4. Every record here matches the records on ESPN's week-4 scoreboard, pulled on the morning of October 5.
| Team | August rank | Priced wins | Priced chance of that start | Record | Gap |
|---|---|---|---|---|---|
| Kansas City | 17 | 2.20 | 8.5% | 4-0 | +1.80 |
| Minnesota | 11 | 2.29 | 10.3% | 4-0 | +1.71 |
| San Francisco | 10 | 2.39 | 11.2% | 4-0 | +1.61 |
| Houston | 5 | 2.66 | 1.1% | 0-4 | -2.66 |
| Chargers | 14 | 2.10 | 2.8% | 0-4 | -2.10 |
| Tampa Bay | 18 | 2.08 | 5.0% | 0-4 | -2.08 |
| Miami | 23 | 1.69 | 10.2% | 0-4 | -1.69 |
| Tennessee | 32 | 1.34 | 17.8% | 0-4 | -1.34 |
The surprise came from the wrong teams. The three likeliest 0-4 teams all won at least once: Arizona and the Jets are 1-3, and Las Vegas, 31st on the August board, is 3-1. Between them those three carried 0.71 of the 2.44 expected 0-4 starts and produced none, while the five teams that did start 0-4 had carried 0.37. By the board's own 0-4 odds they ranked 4th, 11th, 16th, 23rd and 30th of 32. Houston was the 30th: priced at 1.1% to start 0-4, about 1 in 89, and at 19.0% to start 4-0, third-likeliest in the league behind Seattle and Baltimore, who are both 3-1. The 4-0 teams were less exotic, 8th, 10th and 13th by the board's 4-0 odds.
The Exhibit
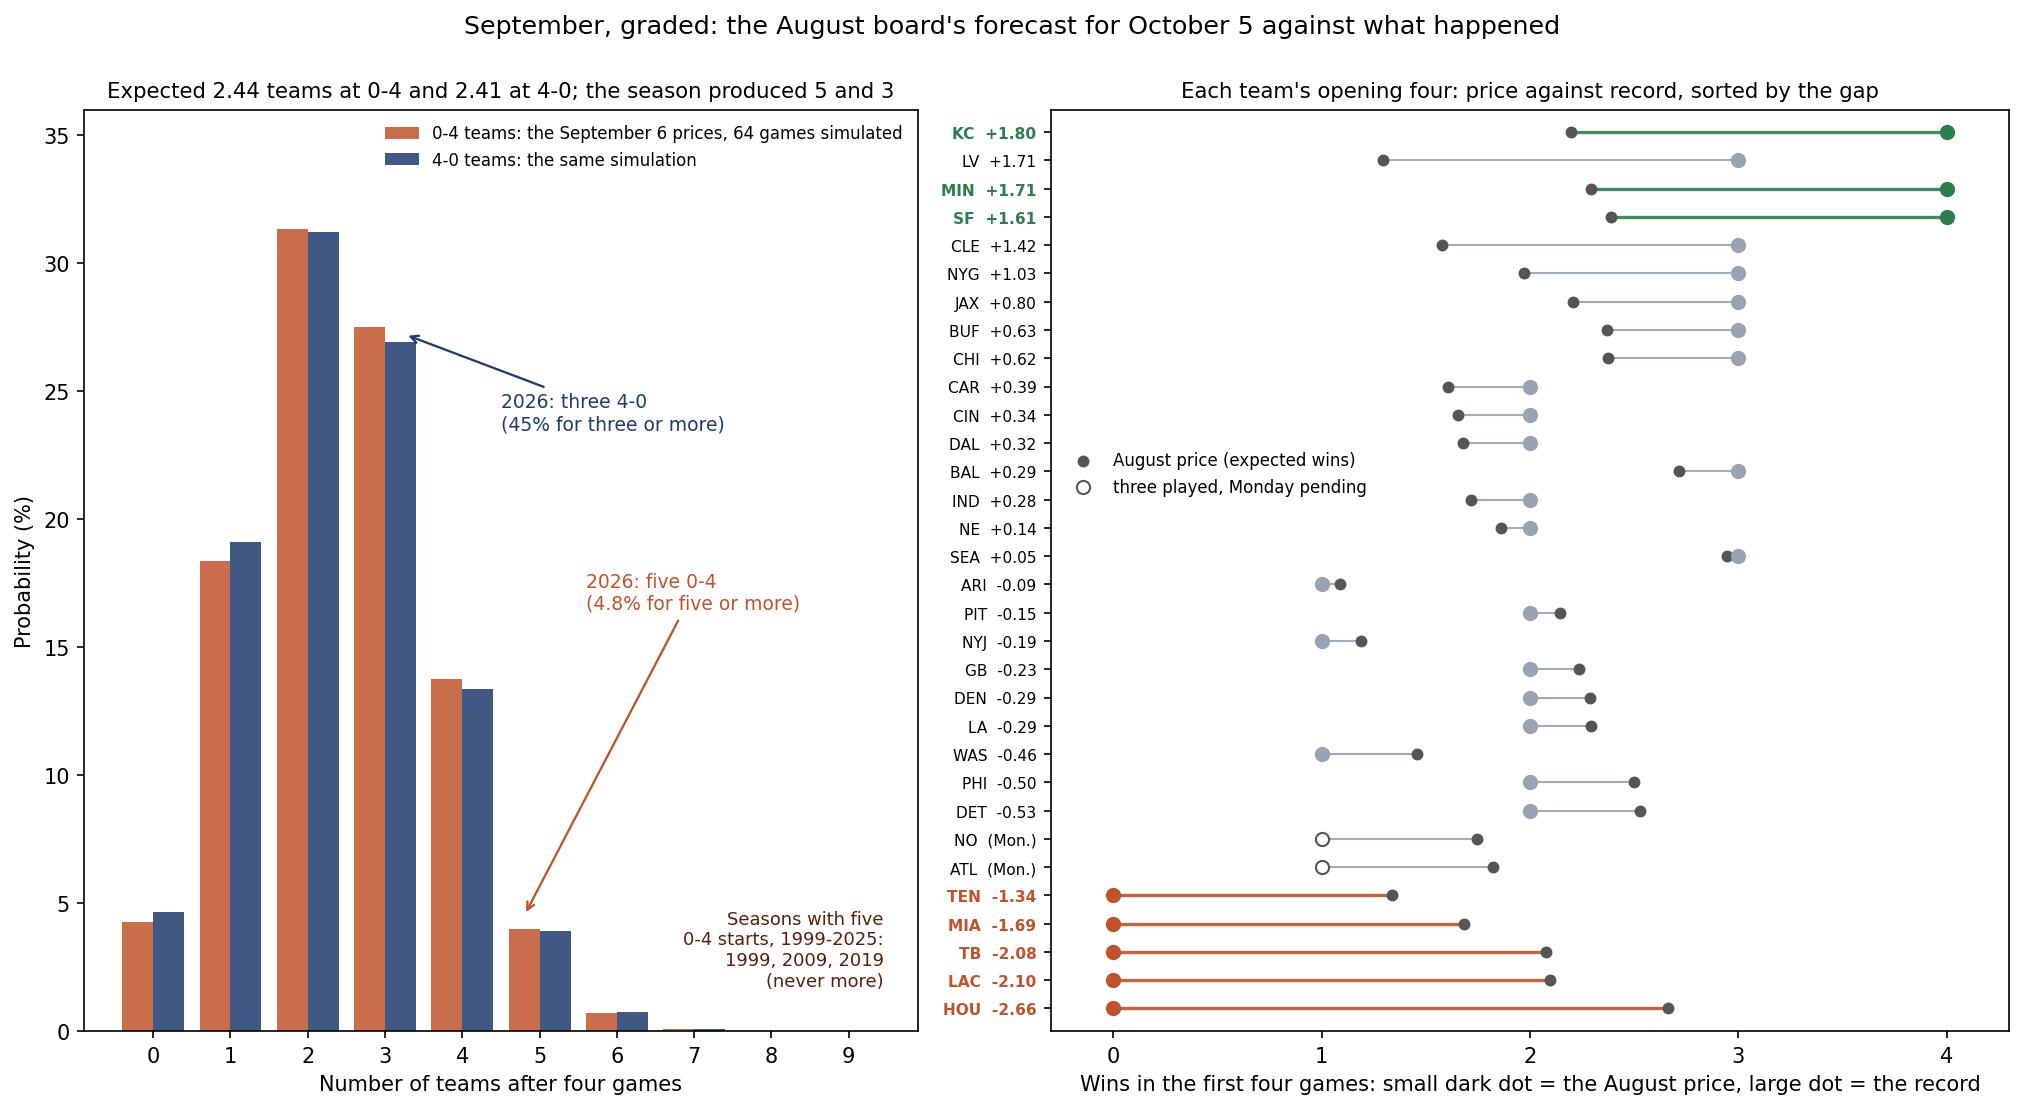
How Surprising Was Five?
Multiply each team's probabilities and treat the 32 teams as independent, and five or more 0-4 teams comes out at 8.5%. The September page itself warned that the teams are not independent: two teams that meet cannot both lose that game, so the counts are less spread out than independent products suggest. Simulating the 64 games together, 200,000 times at the September prices, gives the honest figure. Two 0-4 teams was the likeliest count, exactly five came up 4.0% of the time, and five or more 4.8%, about 1 in 21. Three 4-0 teams is ordinary by the same simulation: three or more in 45% of runs. The expected counts are 2.44 and 2.41 either way, because an average does not depend on how the games are linked.
History agrees that five is a lot. In the 27 seasons of the nflverse file, 1999 to 2025, 81 teams started 0-4, exactly three a season, and no season had more than five; 1999, 2009 and 2019 had five. 2026 ties the file's high. In the sixteen seasons the model has graded, 2010 to 2025, there were 40 starts at 0-4 and 38 at 4-0, 2.50 and 2.38 a season, which the September page noted are almost exactly the board's 2026 expectations.
Graded on All Thirty-Two
Counts are the loudest part of a forecast and the least informative. The September page set a plainer yardstick: the average miss, in wins per team, between the priced expectation and the actual four-game record, against the rule that everybody goes 2-2. Over 2010 to 2025 the board beat that rule by .021 wins a team on average, and in 9 of the 16 seasons.
This year the 2-2 rule misses by .875 wins a team whatever happens on Monday night. The board misses by .82 to .84, depending only on that game, so it beat the rule by .04 to .05, roughly twice its usual margin. The correlation between price and record is .34 to .35, below the .424 pooled across sixteen seasons and inside their range. In the middle of the table the prices did their ordinary job.
The edges are where they missed. Eight teams finished their opening four at least a win and a half from their price: Houston (-2.66), the Chargers (-2.10), Tampa Bay (-2.08) and Miami (-1.69) below it, and Kansas City (+1.80), Las Vegas and Minnesota (+1.71 each) and San Francisco (+1.61) above it. Tennessee's 0-4 was a smaller miss, 1.34 below a price that already expected little. The September prices expected 3.75 starts that far out, and the joint simulation put eight or more at 2.8%. Since 2010 only 2020 produced eight, also a 2.8% outcome by that season's own prices, and 2020 was the board's second-best season against the 2-2 rule, behind only 2016. Across the sixteen seasons the prices expected 60.7 starts that far from their price and 53 arrived, so in the long run the board has allowed for more of these than happened. 2026's eight is a tail, not a habit.
How the Extremes Were Built
Close games did much of the sorting. Counting a one-score game as one decided by eight points or fewer, 13 of the five 0-4 teams' 20 losses were one-score games. Tampa Bay lost all four of its games by one score: 33-27 at Cincinnati, then 23-19 to Cleveland, 23-16 to Minnesota and 17-14 to Green Bay, all three at home. The August board favoured Houston in all four of its games, three of them at home, and Houston lost 36-31 to Buffalo, 20-6 to Cincinnati, 19-17 at Indianapolis and 34-30 to Dallas: three losses by five points or fewer and one by fourteen. Its 2.66 expected wins had been third in the league, behind Seattle and Baltimore.
A team cannot be 0-4 with a one-score win, so the comparison that matters is how close the losses were. Across the 81 0-4 starts since 1999, 147 of 324 losses were by one score, 45%, against 13 of 20 this year, and the four-game point differential averaged -51.5, against -33.4 for this year's five: Houston -25, Tampa Bay -20, Tennessee -28, the Chargers -39 and Miami -55. Only one 0-4 start in the file came closer to even than Tampa Bay's -20. The 4-0 teams look ordinary by the same measures: 6 of their 12 wins were by one score, against 45% for the 73 4-0 starts since 1999, and their differentials, Kansas City +41, Minnesota +35 and San Francisco +58, average +44.7 against +50.9. This year's winless teams lost closer than winless teams usually do. Close results are the least repeatable part of a record: an earlier page found that a team's one-score record correlates +0.08 with its own one-score record the following season, statistical zero, while point margin per game holds at +0.40.
What the Grade Means
The September page warned against reading its table as a forecast of anyone's record, and the grade bears that out in both directions. Four games are mostly noise, and the priced expectation is a weak instrument that still beat the 2-2 rule this year by more than it usually does. What the prices could not do, and never claimed to, is say which teams would land in the tails. The extremes cut straight across the August board: Houston began 5th and Las Vegas 31st.
What these records mean for the rest of the season is a separate question, and it belongs to the board as it stands now rather than as it stood in August. The ratings have already moved, Houston down 87.9 points since August and Kansas City up 72.7. Today's companion page asks whether they moved far enough.
What This Page Does Not Show
- Why any team lost. The August ratings come from scores alone, with no rosters, injuries or quarterbacks. The grade measures the prices, not the reasons.
- A verdict on the tails. With 2026, two of the seventeen seasons since 2010 have produced eight extreme starts, and over the sixteen before this one the prices allowed for more such starts than arrived. Two seasons are not enough to call the prices too tight.
- Monday night. Atlanta and New Orleans finish their opening four on Monday night, October 5. Whatever the result, each ends within 0.82 wins of its price, the two counts and the eight extreme starts stay as they are, and every figure that depends on the game is given as the range it can take.
- A calendar month. Weeks 1 to 4 ran from September 9 to October 5; the label follows the September page.
Method and Sources
p(home)        = 1 / (1 + 10 ^ (-(R_home + 48 - R_away) / 400))   # 48 waived at a neutral site; R = the August board
expected wins  = sum of a team's four p                             # 4-0 chance = product of the four p
P(count)       = share of 200,000 simulated openings, 64 games drawn together (seed 20261005)
gap            = wins in the first four games - expected wins       # extreme: |gap| of 1.5 or more
The script make_september_graded_chart.py rebuilds the August board from the game log, checks it against the ratings frozen into the ledger's week-1 rows and against all 32 rows of the September table, prices the 64 games, reads the results and checks every team's record against ESPN, runs the joint simulation and the 1999-2025 history, and asserts every number on this page under all three possible Monday results: an Atlanta win, a New Orleans win and a tie.
Sources: the nflverse public game log (games.csv), 1999-2025 and the 2026 schedule from the copy bundled in June, 2026 results from a pull on October 5, 2026, whose 1999-2025 rows were checked identical; ESPN's public NFL scoreboard for week 4, pulled on October 5 with no custom user agent, for every team's record; the table published on September 6 in The First Four Games, Priced.
Further reading
- The First Four Games, Priced: the forecast graded here
- 0-4 and Still 14th: Is the Board Too Slow?: today's companion, on what the board has done since
- What 0-3 Means, and How Many 2026 Is About to Have: last week's look at winless starts
- One-Score Records Are Luck: why close results do not repeat
- Elo-Implied 2026 Win Totals: the same August ratings over all seventeen games
- Eleven of Sixteen: Week 3, Graded Against the Market: the last weekly grade
- Houston Texans and Kansas City Chiefs: the team pages
- Power Rankings: the board as it stands
Go deeper
Want the code behind these metrics? Work through the 43-chapter NFL analytics tutorial.
Browse tutorials Free tools