Monday's Number
Monday night's game is Atlanta at New Orleans, two 1-2 teams in the same division. The prediction ledger froze its price on October 4: Atlanta is rated 1454.1 and New Orleans 1434.2, so Atlanta is the better team by 19.9 points and New Orleans gets the 48-point home edge every home team receives. The net of 28.1 points makes New Orleans a .5403 pick. Without the home edge the engine would have Atlanta at .5287 and New Orleans at .4713. Neither team has played since week 3, and a rating moves only when its own team plays, so the price is the same as it would have been at any moment since New Orleans' last game on September 27.
The market agrees almost exactly. DraftKings, as shown on ESPN's scoreboard on the afternoon of October 4, had New Orleans favoured by 1.5 points with moneylines of -130 and +110, a vig-free .5427; the line opened at New Orleans -2.5, -135 and +114, or .5514. The nflverse game file carries the same -130, +110 and 1.5. The ledger and the market sit 0.24 points of probability apart. At the conversion What a 60% Pick Is Worth fitted, 1.153 to the odds per point of spread, the ledger's .5403 is a 1.1-point favourite against the market's 1.5.
The two prices agree, so the interesting question is about the visitors. Atlanta's three games have been the most erratic of 2026, wild enough to ask whether a team that swings like that should be priced as a wider distribution than an ordinary one. This page tests that on 27 seasons of the game log. The answer is no.
The Exhibit
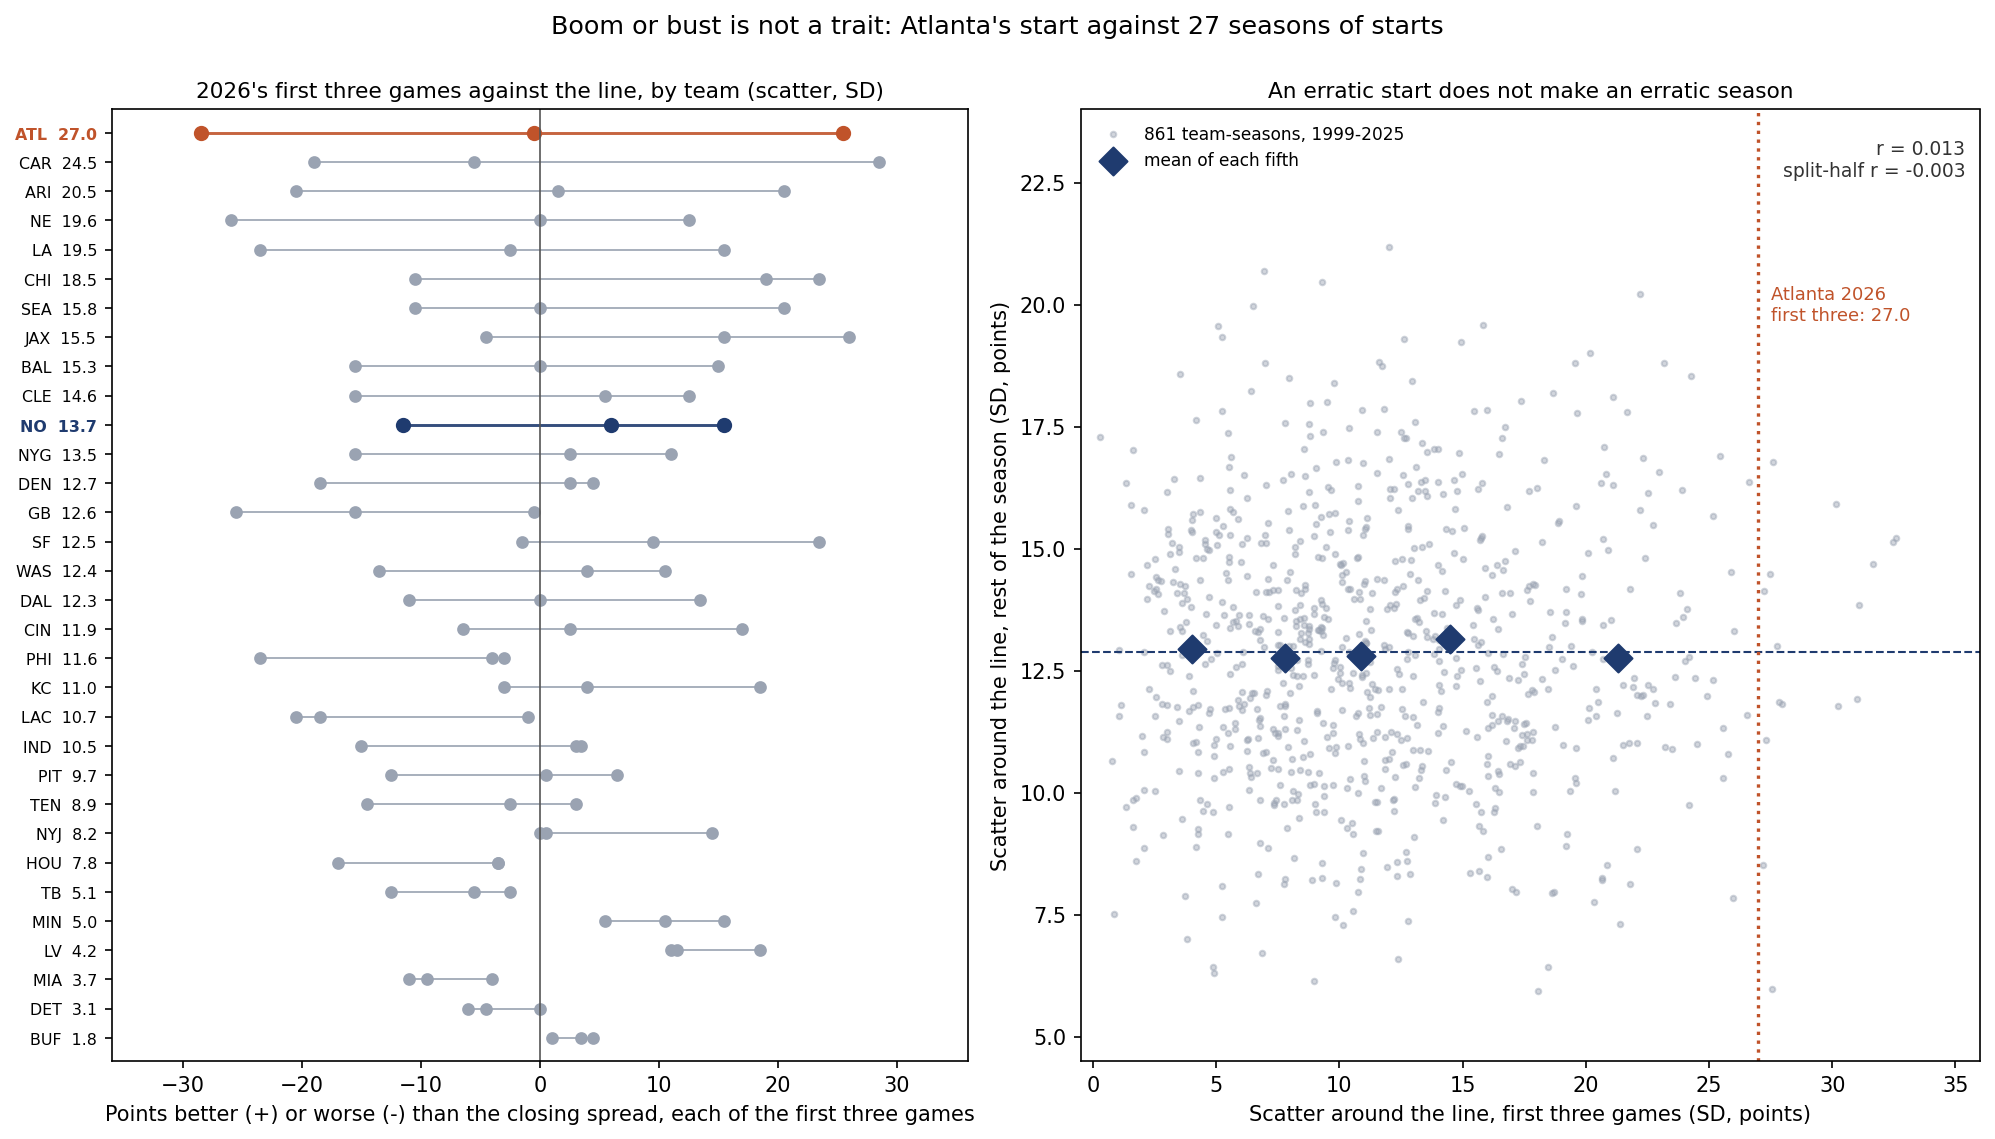
Atlanta, Three Ways
The cleanest way to measure how erratic a team has been is to compare each result with the closing spread, the market's expected margin for that game. A team that finishes close to the line every week is steady; one that misses it by four touchdowns in both directions is not.
| Game | Closing line | Result | Against the line |
|---|---|---|---|
| Atlanta at Pittsburgh, Sep 13 | Pittsburgh by 6.5 | Lost 20-13 | -0.5 |
| Carolina at Atlanta, Sep 20 | Carolina by 2.5 | Lost 34-3 | -28.5 |
| Atlanta at Green Bay, Sep 24 | Green Bay by 4.5 | Won 35-14 | +25.5 |
| New Orleans at Detroit, Sep 13 | Detroit by 7 | Lost 31-30 | +6.0 |
| New Orleans at Baltimore, Sep 20 | Baltimore by 8.5 | Won 24-17 | +15.5 |
| Las Vegas at New Orleans, Sep 27 | New Orleans by 3.5 | Lost 35-27 | -11.5 |
Atlanta landed half a point from the line in Pittsburgh, then 28.5 points under it at home to Carolina and 25.5 over it in Green Bay. The standard deviation of those three numbers is 27.0 points, the largest of the 32 teams this season. Carolina is second at 24.5, mostly because it was on the other side of the 34-3. New Orleans, at 13.7, is eleventh. Across the 861 team-seasons from 1999 to 2025, a typical first three games scatter by 11.7 points (median 10.9), and only 17 starts were as erratic as Atlanta's, 2.0%.
The ratings have already absorbed all of it. Atlanta opened the season at 1470.3 and moved -14.69, -42.66 and +41.16, the last two the largest single-game moves of 2026 through October 1. That is 98.51 points of travel for a net of -16.19. New Orleans moved -3.41, +28.84 and -26.58 from an opening 1435.3. What is left to ask is whether the swings themselves, rather than where they left the rating, say anything about the next game.
Is Volatility a Trait?
If some teams were genuinely boom-or-bust, a team that scattered widely around the line early in a season would keep doing it. The game log says it does not. For each of the 861 team-seasons, the standard deviation of the first three games against the line correlates .013 with the same measure over the rest of the season, with a 95% interval from -.05 to .08. Sorted into fifths by how erratic the start was, the rest of the season does not move:
| First three games, by scatter | Team-seasons | Scatter, first three | Scatter, rest of season | Engine's Brier, rest of season |
|---|---|---|---|---|
| Steadiest fifth | 172 | 4.01 | 12.95 | .2235 |
| Second | 172 | 7.79 | 12.75 | .2205 |
| Middle | 172 | 10.86 | 12.81 | .2186 |
| Fourth | 172 | 14.50 | 13.14 | .2141 |
| Most erratic fifth | 173 | 21.29 | 12.77 | .2190 |
Teams whose starts scattered by 21.29 points went on to scatter by 12.77, which is 0.18 points less than the steadiest starters managed afterwards. The engine's own later Brier score shows no gradient either: its picks in the later games of the most erratic starters scored .2190, better than its .2235 on the steadiest. Nothing about a wild start made a team harder to forecast.
Two further checks close the obvious gaps. The first three games are a small sample, so the stronger test drops the calendar altogether: split each season's games into odd and even in date order and ask whether one half's scatter predicts the other's. Across the same 861 team-seasons the split-half correlation is -.003 (95% interval -.07 to .06). And the closing spread is the market's expectation, so the test was repeated against the engine's own expected margin, converted from its probability at the same 1.153 a point: the correlations are .032 and .021. Whoever sets the expectation, a team's scatter around it is not a property of the team.
What the Test Could Have Seen
A null result is only as good as the test's power, so the harness planted a real difference and checked whether the split-half test would find it. In each of 300 simulated versions of the 861 team-seasons, every team-season received its own true scatter, drawn around the league's 13.2 points with a chosen spread between teams, and each game's residual was resampled from the real residuals and rescaled. With no planted difference the test flagged 3.7% of runs, close to its nominal 5%. With a real spread of 1 point between teams, about 7.6% of the usual scatter, the split-half correlation averaged .06 and the test caught it in 60% of runs. At 1.5 points it averaged .14 and was caught in 99%; at 2 points .22, and at 3 points .37, caught every time.
The observed -.003 sits below even the 1-point average. Real differences between teams of 1.5 points or more would almost certainly have shown up, and did not. Differences of a point or less could exist and stay invisible, but a point is small against a 13.2-point scatter that every team shares.
What It Would Have Meant for Monday
Suppose the test had gone the other way and Atlanta's 27.0 were a real, permanent property. A wider distribution of margins pulls any favourite toward a coin flip. Holding the ledger's 1.1-point edge fixed and scaling the league's 13.2-point scatter up to Atlanta's 27.0, New Orleans would fall from .5403 to .5197, 2.1 points of probability. That is the most the question could ever have been worth on Monday, and the evidence says the true adjustment is zero.
The level does not carry either. Whether a team beat the line in its first three games correlates .033 with how it did against the line afterwards, which is what a market that adjusts its numbers quickly would produce. An earlier page found the same thing one week in: the week-2 line moves just enough. What carries forward from Atlanta's three games is the rating, and the rating already moved.
What This Page Does Not Show
- Why Atlanta swung. Injuries, quarterback play and game plans are outside the bundled log and outside the engine. The test says such swings do not repeat as a team trait on average; it cannot rule out a specific cause that persists for one team.
- One team's share of a game. A margin against the line belongs to both teams at once, so a team's scatter includes its opponents'. Carolina's 24.5 is partly Atlanta's 34-3.
- Shapes other than spread. The test is about the size of the misses. It says nothing about late-game collapses or blowout patterns, which the game log cannot see by quarter.
Method and Sources
residual(team, game) = team margin - team's closing spread       # points better (+) or worse (-) than the line
scatter(team-season)  = sample SD of residuals over a set of games  # first three, rest of season, odd, even
engine margin         = ln(p / (1 - p)) / ln(1.153)                 # the engine's probability as a spread
P(home) at scatter s  = 1 / (1 + 1.153 ^ (-edge * 13.2 / s))         # the Monday upper bound
The script make_boom_or_bust_chart.py replays the engine over the game log, rebuilds every residual and every team-season's scatter, reproduces Atlanta's and New Orleans' scores, lines, rating moves and ratings, runs the correlations, the fifths and the split-half test with their intervals, runs the seeded power simulation, prices Monday's game from the frozen row and from both market sources, and asserts every number on this page. It also checks that neither team plays on October 4 and that no game played on or after that date enters any figure.
Sources: the nflverse public game log (games.csv), 1999-2025 from the copy bundled in June and 2026 from a pull on October 4, 2026, whose 1999-2025 rows were checked identical; the site's own prediction ledger, whose Monday row was frozen on October 4; ESPN's public NFL scoreboard, pulled on October 4 with no custom user agent, for DraftKings' prices.
Further reading
- Eleven of Sixteen: Week 3, Graded Against the Market: the week these six games belong to
- Atlanta 35, Green Bay 14: the 41.16-point swing, graded
- How Accurate Is the Point Spread?: where the 13.2-point scatter comes from
- What a 60% Pick Is Worth: the 1.153-per-point conversion
- The Model Has No Good Years, Only Lucky Ones: the same kind of null result, for the model's seasons
- What a Blowout Is Worth to a Rating: why the 34-3 moved Atlanta so far
- The NFC South in 2026: the division both teams play in
- Atlanta Falcons and New Orleans Saints: the team pages
- The Prediction Ledger: Monday's frozen row
Go deeper
Want the code behind these metrics? Work through the 43-chapter NFL analytics tutorial.
Browse tutorials Free tools