Thirteen Agreements, Six Wide Gaps
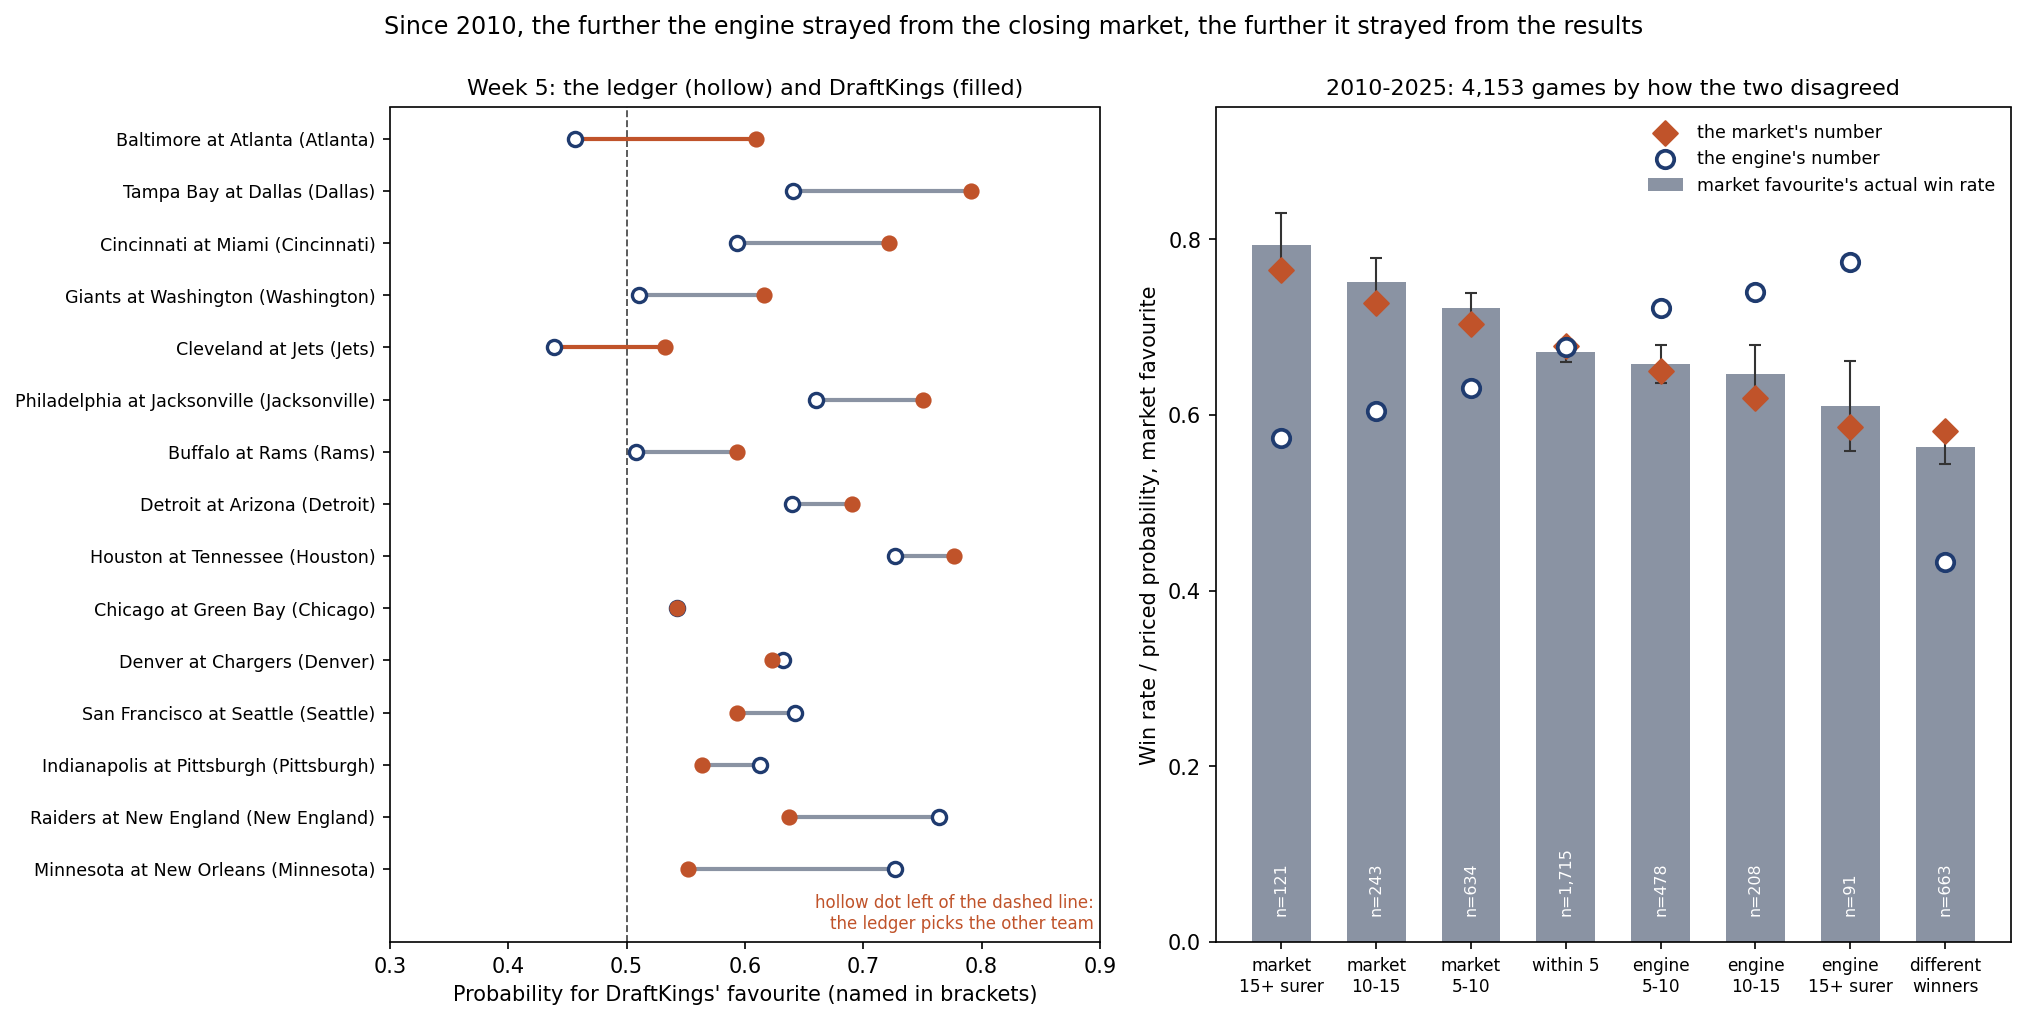
Week 5 has fifteen games, from Tampa Bay at Dallas on Thursday night to Buffalo at the Rams on Monday. The prediction ledger froze a number for each of them on October 6. DraftKings' prices, as shown on ESPN's scoreboard at 08:22 ET this morning, before the first kickoff, are a second opinion on the same fifteen games. The two pick the same winner in thirteen. They pick different winners in two, Cleveland at the Jets and Baltimore at Atlanta, and in six games they are 10 or more probability points apart. The market is the surer of the two in ten of the fifteen.
Which number to believe is not a matter of taste. The engine behind the ledger can be replayed over sixteen seasons of games that also had a closing moneyline, and every kind of disagreement on this week's board can be graded on what happened in those games.
The Exhibit
The Fifteen
| Game | Kickoff (ET) | The ledger's pick | DraftKings' favourite | Gap (points) | Kind |
|---|---|---|---|---|---|
| Tampa Bay at Dallas | Thu 20:15 | Dallas .6405 | Dallas -8.5, .7914 | +15.1 | Market 15+ points surer |
| Philadelphia at Jacksonville | Sun 09:30 | Jacksonville .6603 | Jacksonville -7, .7508 | +9.1 | Market 5 to 10 surer |
| Chicago at Green Bay | Sun 13:00 | Chicago .5424 | Chicago -1.5, .5427 | +0.0 | Within 5 points |
| Cincinnati at Miami | Sun 13:00 | Cincinnati .5931 | Cincinnati -6.5, .7221 | +12.9 | Market 10 to 15 surer |
| Cleveland at the Jets | Sun 13:00 | Cleveland .5611 | The Jets -1.5, .5325 | +9.4 | Different winners |
| Houston at Tennessee | Sun 13:00 | Houston .7265 | Houston -7.5, .7768 | +5.0 | Market 5 to 10 surer |
| Indianapolis at Pittsburgh | Sun 13:00 | Pittsburgh .6128 | Pittsburgh -2.5, .5635 | -4.9 | Within 5 points |
| The Raiders at New England | Sun 13:00 | New England .7644 | New England -3.5, .6369 | -12.7 | Ledger 10 to 15 surer |
| Minnesota at New Orleans | Sun 13:00 | Minnesota .7270 | Minnesota -1.5, .5514 | -17.6 | Ledger 15+ points surer |
| The Giants at Washington | Sun 13:00 | Washington .5102 | Washington -3.5, .6164 | +10.6 | Market 10 to 15 surer |
| Denver at the Chargers | Sun 16:05 | Denver .6320 | Denver -3.5, .6225 | -1.0 | Within 5 points |
| Detroit at Arizona | Sun 16:25 | Detroit .6399 | Detroit -5.5, .6908 | +5.1 | Market 5 to 10 surer |
| San Francisco at Seattle | Sun 16:25 | Seattle .6424 | Seattle -3, .5934 | -4.9 | Within 5 points |
| Baltimore at Atlanta | Sun 20:20 | Baltimore .5440 | Atlanta -3.5, .6092 | +15.3 | Different winners |
| Buffalo at the Rams | Mon 20:15 | The Rams .5080 | The Rams -3, .5934 | +8.5 | Market 5 to 10 surer |
Gap: DraftKings' vig-free price for its favourite minus the ledger's number for the same team, in percentage points; positive means the market is the surer of the two. Philadelphia and Jacksonville play in London at 09:30 ET. The nflverse file carries the same moneylines for 14 of the 15 games; for San Francisco at Seattle it has Seattle -2.5 at -155/+130, against DraftKings' -3 at -162/+136.
The widest gap is Minnesota at New Orleans, where the ledger is 17.6 points surer of Minnesota than the market, .7270 against .5514. The narrowest is Chicago at Green Bay, 0.03 points, and the market closed it: DraftKings had Chicago -3, a vig-free .5830, on Wednesday morning, and has Chicago -1.5 this morning.
Sixteen Seasons of Disagreement
From 2010 to 2025 the nflverse file carries a closing moneyline for 4,174 regular-season games. Twenty-one were priced level, which leaves 4,153 with a market favourite. Replaying the engine walk-forward over the same seasons gives its number for every one of them, and the games sort into the same kinds as this week's, always read from the side of the market's favourite:
| How the two disagreed | Games | Favourite won | The market said | The engine said | Brier, market | Brier, engine |
|---|---|---|---|---|---|---|
| The market 15+ points surer | 121 | .793 | .765 | .573 | .1624 | .2087 |
| The market 10 to 15 surer | 243 | .751 | .728 | .604 | .1783 | .1989 |
| The market 5 to 10 surer | 634 | .722 | .703 | .630 | .1956 | .2028 |
| Within 5 points | 1,715 | .671 | .678 | .677 | .2071 | .2091 |
| The engine 5 to 10 surer | 478 | .658 | .650 | .721 | .2132 | .2175 |
| The engine 10 to 15 surer | 208 | .647 | .619 | .740 | .2195 | .2277 |
| The engine 15+ points surer | 91 | .610 | .586 | .774 | .2400 | .2682 |
| Different winners | 663 | .563 | .582 | .433 | .2435 | .2689 |
In seven of the eight groups the favourite's record sat nearer the market's number than the engine's, and the market's Brier score was lower in all eight. The exception is the largest group, the 1,715 games in which the two were within five points of each other: there the two averages are .0012 apart, both sit above the result, and the engine's is nearer by about a tenth of a point.
Everywhere else the pattern runs one way. The further the engine strayed from the market, the further it strayed from the results. When the market was 15 or more points surer of the favourite, the engine was .220 too low, 6.0 standard errors; when the engine was 15 or more points surer, it was .164 too high, 3.2 standard errors. The market's own largest miss in any group was 1.02 standard errors, and in six of the seven groups with the same favourite its favourites won a little more often than its vig-free price said. Across all 4,174 games the market's Brier score is .2104 and the engine's .2205.
Read against that table, this week's board sorts itself. Tampa Bay at Dallas is the one game in the group where favourites won .793, against .765 from the market and .573 from the engine; today's Thursday page takes it up in detail. Cincinnati at Miami and the Giants at Washington sit in the next group down. At the other end, the ledger's .7270 for Minnesota is in the group in which the engine's number has been .164 too high, and its .7644 for New England in the group in which it has been .093 too high.
When They Pick Different Winners
There are 663 such games in the file. The market's side won 373 of them and the engine's 289, with one tie, .563 of the decided games for the market. How far apart the two numbers were matters. When they were less than 10 points apart, the engine's side won 100 and the market's 91, with one tie, 0.65 standard errors from an even split. From 10 to 20 points apart the market's side won 187 of 321, .583, and from 20 points up 95 of 150, .633.
This week has one game of each kind. Cleveland at the Jets is 9.36 points apart, in the group where the record has been a coin flip. Baltimore at Atlanta is 15.32 apart, in the group where the market's side has won .583 of the time.
The Ledger's Own Season
Through four weeks of 2026 the ledger has done better than that history. Graded against the closing moneylines the nflverse file carries for the same 62 games, its Brier score is .2254 and the market's .2297. In the eleven games in which the two picked different winners, the ledger's side won five and the market's six; in week 3 both went the ledger's way, as the week-3 grading page reported.
Sixteen seasons counsel patience with that lead. The market's edge over the engine has been smallest in the first four weeks, .0048 of Brier score over 1,010 games, against .0097 in weeks 5 to 8, .0094 in weeks 9 to 12 and .0145 from week 13 on. The opening month is the stretch in which the engine has come closest.
What This Page Does Not Show
- Closing prices. This morning's prices are a snapshot and will move before kickoff. The history is graded on closing prices, so this week's gaps are the right kind of number but not yet the final one.
- Why the market moved. The engine reads final scores only, with no rosters, injuries or quarterbacks, and this page names no starter for any team. Where the market is far surer than the ledger it may be reading something of that kind; the page does not say what.
- A verdict on any game. The ledger's fifteen numbers are frozen and will be graded on the results, one game at a time.
- Advice. The page compares two forecasts. It recommends no wager and links to no sportsbook.
- The cut points. The groups are cut at 5, 10 and 15 points. The pattern does not depend on the cuts: the engine's error moves the same way across all seven groups with the same favourite, and the market's Brier score is lower overall.
- The vig. It is removed in proportion to each side's implied price. Favourites beat that number slightly in six of the seven groups with the same favourite, which a different way of removing the vig would partly absorb.
Method and Sources
vig-free price = implied(home) / (implied(home) + implied(away))     # implied(-470) = 470 / 570, implied(+360) = 100 / 460
gap            = the market favourite's vig-free price - the ledger's (or the engine's) number for the same team
kind           = different winners if that number is below .5; otherwise by the gap:
                 15+, 10 to 15, 5 to 10, within 5, and the same three bands with the engine surer
history        = 2010-2025 regular season with a closing moneyline in the file, the engine replayed walk-forward from 1999
The script make_week5_market_chart.py replays the engine over 1999-2025 and the 64 games of 2026 final through Monday, checks its ratings against the ledger's published ones for all 32 teams, reproduces all fifteen frozen week-5 numbers, reads this morning's DraftKings prices, sorts the 4,153 historical games and this week's fifteen into the same kinds, grades the ledger's 62 games of 2026 against the closing moneylines, and asserts every number on this page.
Sources: the nflverse public game log (games.csv), 1999-2025 from the copy bundled in June and 2026 from a pull on October 8, 2026, whose 1999-2025 rows were checked identical; ESPN's scoreboards for weeks 1 to 4, pulled October 8, whose 64 final scores match the file's, and for week 5 on October 7 and 8 for DraftKings' prices; the site's prediction ledger as published on October 6.
Further reading
- Week 5 Thursday: Tampa Bay at Dallas, 0-4 by 20 Points: today's companion, the week's game with the market 15 points surer
- Week 5: Chicago Favoured at Lambeau, a First Since 2006: the week's narrowest gap
- Is London a Jacksonville Home Game? The Price Says Yes: how the ledger prices the London game
- Houston at Tennessee: Two 0-4 Teams, 217.7 Points Apart: the week's meeting of two 0-4 teams
- Eleven of Sixteen: Week 3, Graded Against the Market: the last full week graded against the close
- A Worse Score Is Not a Worse Model: what a Brier score does and does not measure
- The Model Cannot See a Quarterback Change: one thing the market reads and the engine cannot
- The prediction ledger and the power rankings
Go deeper
Want the code behind these metrics? Work through the 43-chapter NFL analytics tutorial.
Browse tutorials Free tools