Tampa Bay 24, Dallas 16
Week 5 opened on Thursday night with a result the prediction ledger gave a .3595 chance, a little better than one in three. The ledger froze Dallas at .6405 on October 6, two days before kickoff, as Thursday's preview set out. Tampa Bay, 0-4 and rated 1423.0, won 24-16 at AT&T Stadium. Dallas led 10-7 at the half; Tampa Bay scored 17 points in the third quarter, and Dallas's only points after the break were 6 in the fourth, by ESPN's line score. ESPN's scoreboard and the nflverse game log carry the same final, and the October 9 build graded the row from it: a miss, with a Brier score of .4102.
The ledger now reads 39 of 63, and its season Brier score moved from .2254 over 62 games to .2284 over 63. The miss is ordinary. What makes the game worth a page is the price: the betting market spent the week moving away from the ledger, toward Dallas, so Tampa Bay's win scored every later market price worse than the frozen number.
The Exhibit
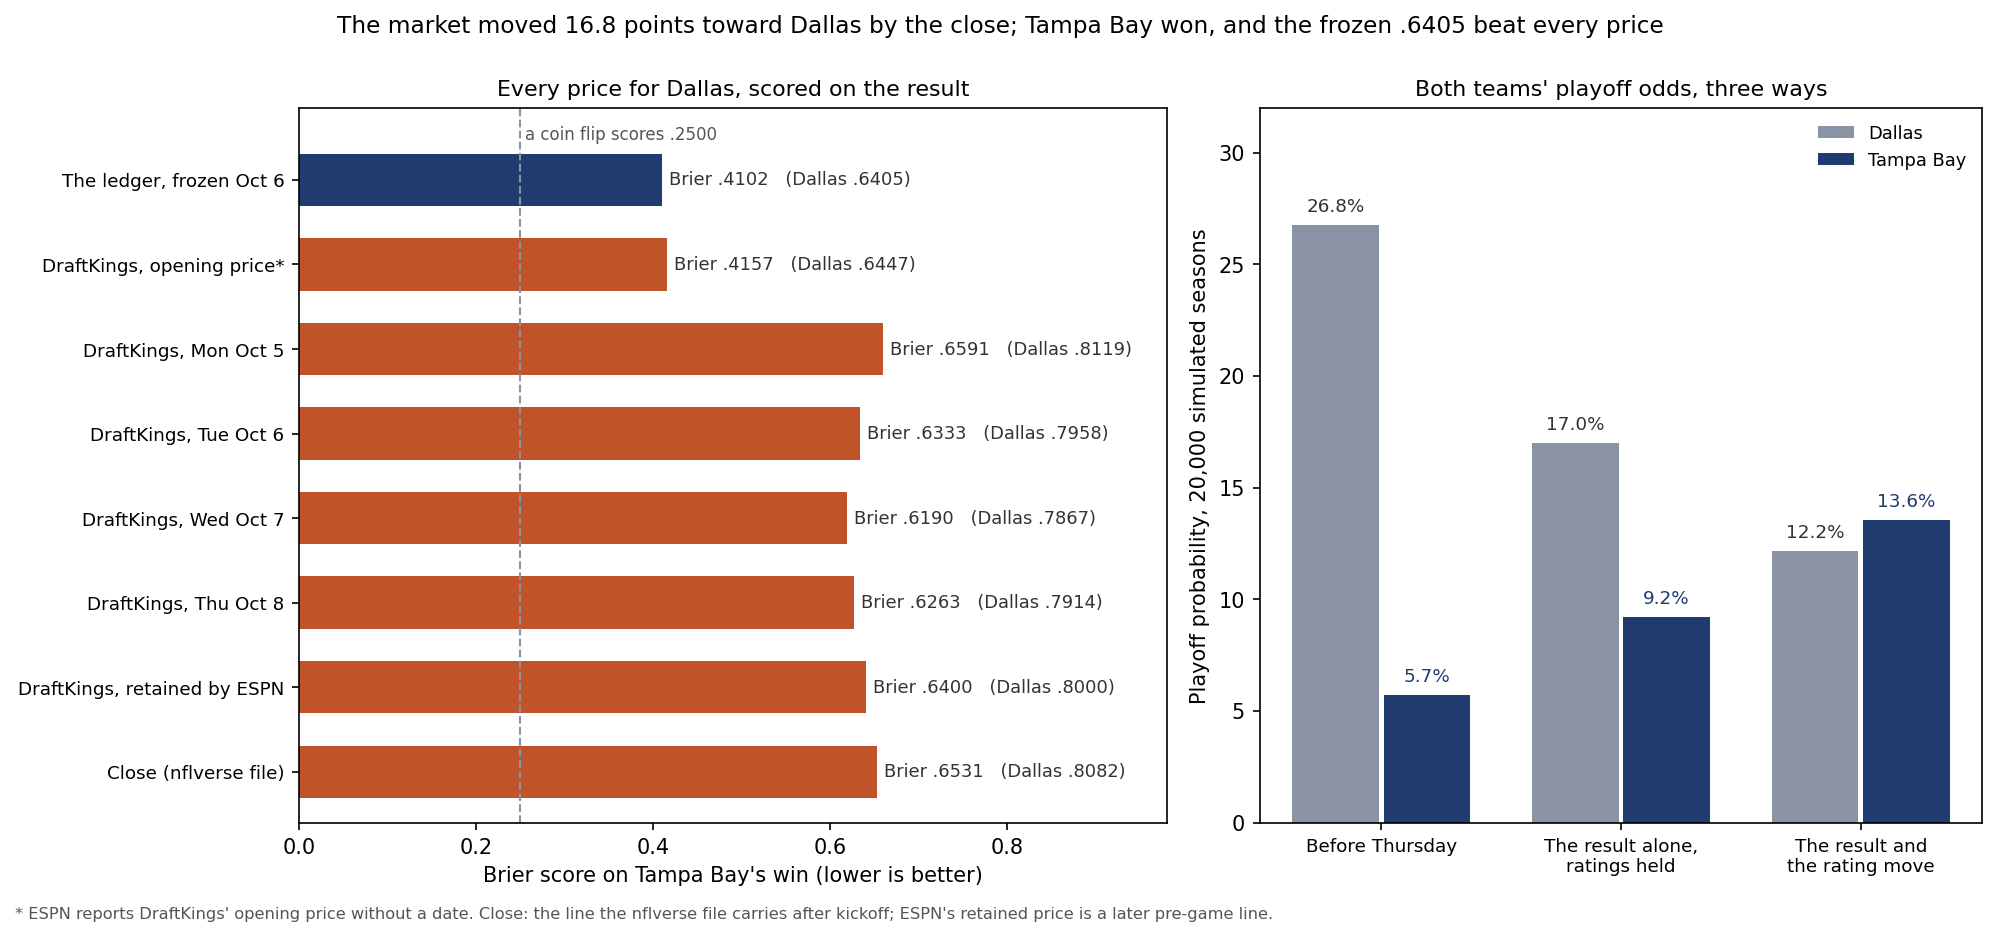
The Pick Against Every Price
The ledger's number was fixed on Tuesday. The market's was not, and the site's own snapshots, ESPN's game summary and the nflverse file preserve its path. Removing the bookmaker's margin from each pair of moneylines gives Dallas's implied probability:
| Forecast | Price | Dallas | Brier on this game |
|---|---|---|---|
| The ledger, frozen October 6 | Elo 1475.4 + 48 against 1423.0 | .6405 | .4102 |
| DraftKings, opening price (undated) | Dallas -3.5, -205 / +170 | .6447 | .4157 |
| DraftKings, Monday 07:13 ET | Dallas -10, -550 / +410 | .8119 | .6591 |
| DraftKings, Tuesday 10:07 ET | Dallas -9.5, -485 / +370 | .7958 | .6333 |
| DraftKings, Wednesday 07:57 ET | Dallas -8.5, -455 / +350 | .7867 | .6190 |
| DraftKings, Thursday 08:22 ET | Dallas -8.5, -470 / +360 | .7914 | .6263 |
| DraftKings, the price ESPN retained after kickoff | Dallas -8.5, -500 / +380 | .8000 | .6400 |
| The closing line in the nflverse file | Dallas -9.5, -535 / +400 | .8082 | .6531 |
The market opened within half a point of the ledger, .6447 against .6405, and had moved to .8119 by Monday morning. It eased during the week and firmed again before kickoff: the closing line the nflverse file carries is Dallas -9.5 at -535/+400, a vig-free .8082, 16.8 points surer of Dallas than the ledger. On the scale that What a 60% Pick Is Worth fitted, that is Dallas by 10.3 points, against 4.2 for the ledger. Graded on the result, the frozen number beat every price the market posted, the opening price by .0054 and the close by .2429. The preview noted that one of the two pricers had moved and the other, by design, could not. On this game, not moving was the better forecast.
ESPN's retained price is a later pre-game line, recorded after kickoff, and is quoted as one. The season-long comparison uses the closing moneylines the nflverse file carries, as the week-5 page on the ledger and the market did: over its 62 games the ledger led .2254 to .2297, and over 63 it leads .2284 to .2365. One upset moved the gap from .0043 to .0081. That is what a single result does to a 63-game average, and it says little about which forecaster is better; A Worse Score Is Not a Worse Model explains why one game is weak evidence in either direction.
How Rare Was It?
By the spread, not very. Since 1999, closing underdogs of exactly 9.5 points have won 29 of 154 games, .188, close to the .192 that the vig-free close gave Tampa Bay. Across all 1,024 underdogs of 9.5 points or more, 159 won outright, .155, and 56 won by 8 or more, as Tampa Bay did, .055. How Often Does the NFL Favorite Actually Win? has the full table by spread.
By the gap between the two forecasts, Thursday was the kind of game that flatters the ledger. The preview found 121 games from 2010 to 2025 in which the closing market was at least 15 points surer of the same favourite than the engine. The favourites won .793 of them, and the market's Brier score, .1624, was far better than the engine's .2087. The class splits in two. In the 96 games the favourite won, the market averaged .0571 to the engine's .1820; in the 25 it lost, the engine averaged .3115 to the market's .5665. Thursday, at a 16.8-point gap at the close, was one of the 25. The class still belongs to the market, because the first kind of game is almost four times as common.
What One Game Moved
The update rule is the one on What One Game Moves: K times the margin multiplier times the gap between the result and the stated probability. Tampa Bay won by 8 while standing 100.3 points below Dallas's home-adjusted rating, so the multiplier is ln(9) × 2.2 / (0.001 × 100.3 + 2.2) = 2.1014 and the shift 20 × 2.1014 × .6405 = 26.92 points each way. The ledger publishes the new ratings rounded: Tampa Bay 1450.0, up 27.0, and Dallas 1448.5, down 26.9.
Of the replay's 7,276 games from 1999 to 2025, 1,295 moved a team at least as far, which puts Thursday near the 82nd percentile, and 15th of the 65 games of 2026. The season's largest is still Carolina's win at Atlanta in week 2, 42.66. What a Blowout Is Worth to a Rating explains why an eight-point upset moves less than a three-score one.
On the board, Tampa Bay rises from 26th to 23rd and Dallas falls from 20th to 24th, 1.5 rating points below Tampa Bay. Five teams between them moved one place: the Giants, Carolina and Cleveland up, the Chargers and the Raiders down. The power rankings show the new order.
The Playoff Picture, Three Ways
The preview ran the game both ways through the site's 20,000-season simulation, with the ratings held where they were. A real result does two things at once: it adds a win and a loss, and it moves the ratings that price every remaining game. Running the same simulation three times, with the same schedule, seed and rules, separates the two, and the first two runs reproduce the preview's published figures exactly.
| Board | Dallas playoffs | Dallas division | Dallas expected wins | Tampa Bay playoffs | Tampa Bay division | Tampa Bay expected wins |
|---|---|---|---|---|---|---|
| Before Thursday | 26.8% | 20.5% | 8.05 | 5.7% | 5.5% | 5.23 |
| The result alone, ratings held | 17.0% | 13.0% | 7.41 | 9.2% | 8.7% | 5.87 |
| The result and the rating move | 12.2% | 9.3% | 7.00 | 13.6% | 12.8% | 6.30 |
For Tampa Bay the win was worth 3.5 points of playoff probability and the re-rating 4.4 more; for Dallas the loss cost 9.8 and the re-rating 4.8. Tampa Bay now has the better odds of the two, and all but 0.8 points of its 13.6 comes through the NFC South, where Carolina and Atlanta are 2-2, New Orleans 1-3 and Tampa Bay 1-4. Among the thirty teams that did not play, the largest moves were Philadelphia, up 5.0 points, the Giants, up 3.7, and Atlanta and Carolina, down 3.5 and 2.7. Shrinking the Playoff Odds explains why the simulation's certainty should be discounted.
The 0-5 Count, Updated
Houston at Tennessee: Two 0-4 Teams priced week 5's 0-5 count from the ledger's frozen rows: 2.87 teams expected, and four at .2401. Tampa Bay carried a .6405 chance of a loss into that count. Without it the expected number falls to 2.23. Four is no longer possible; three needs both the Chargers and Miami to lose, which the frozen rows put at .3748. Houston and Tennessee meet on Sunday, so, barring a tie, one of them will be 0-5.
Tampa Bay joins the other group that page counted. Of the 81 teams that started 0-4 from 1999 to 2025, the 33 that won game five averaged 5.30 wins and none won more than 9, and none of the 81 reached the playoffs. The simulation's 13.6% is a statement about this season's ratings and this season's division; the 81 seasons are history, not a model of 2026.
The Series in Dallas
Before Thursday, Tampa Bay had won two of its eight regular-season games in Dallas since 1999, in 2001 and 2022, both as the closing favourite, and the favourite had won seven of the eight. Thursday's win is its first there as the underdog in a file that begins in 1999.
What This Page Does Not Show
- Why Tampa Bay won. The engine reads final scores only, with no plays, rosters, injuries or quarterbacks, and this page names no starter for either team. The line score is the only in-game detail used.
- Why the market moved. The move from the opening price had happened by Monday morning, and the page does not explain it. The Model Cannot See a Quarterback Change measures one kind of information the market reads and the engine cannot.
- A certified close. The closing line is the one the nflverse file carries, the same source the site's earlier grading pages used; ESPN's retained price is a later pre-game line. Neither is certified as the last price before kickoff.
- A verdict on the market. One game cannot settle which price was right. When the market has been this much surer than the engine, it has been the better price over 121 games.
- A full simulation. The 20,000 seasons hold every rating fixed for the rest of the year and break ties at random rather than by the league's tiebreakers.
Method and Sources
shift          = K * mov_multiplier(-8, 1423.0 - (1475.4 + 48)) * (0 - .6405)   # -26.92
vig-free price = implied(home) / (implied(home) + implied(away))                # implied(-535) = 535 / 635, implied(+400) = 100 / 500
board_before   = simulate(ratings of October 6, 64 results fixed)              # reproduces the preview
board_result   = simulate(ratings of October 6, 64 results + Tampa Bay's win)
board_now      = simulate(ratings of October 9, 64 results + Tampa Bay's win)  # 20,000 seasons, seed 2026
The script make_tb_dal_graded_chart.py replays the engine over 1999-2025 and the 65 games of 2026, checks its ratings against the ledger's published ones before and after Thursday for all 32 teams, reproduces the frozen .6405 and the graded row, reads the four DraftKings snapshots, the retained price and the close, grades each, recomputes the season against the close, measures the move against every game in the replay, runs the three simulations, updates the 0-5 count and asserts every number on this page. It names no quarterback.
Sources: the nflverse public game log (games.csv), 1999-2025 from the copy bundled in June and 2026 from a pull at 09:29 ET on October 9, 2026, whose 1999-2025 rows were checked identical and whose scores match every graded row of the ledger; ESPN's week-5 scoreboard and its game summary for Thursday's game, pulled October 9, for the final, the line score and the retained price, and its week-5 scoreboards of October 5 to 8 for DraftKings' earlier prices; the site's prediction ledger as published on October 6 and after the October 9 build.
Further reading
- Week 5 Thursday: Tampa Bay at Dallas, 0-4 by 20 Points: the preview this page grades
- Three Long Trips in Week 5: What a Time Zone Costs: today's companion, on Sunday's and Monday's cross-country games
- Week 5: Where the Ledger and the Market Disagree: all fifteen week-5 games against the market
- Houston at Tennessee: Two 0-4 Teams, 217.7 Points Apart: the 0-5 count and what 0-4 has meant
- Atlanta 35, Green Bay 14: The Swing Back, Graded: the week-3 Thursday miss, when the market moved toward the winner
- What One Game Moves: the update rule behind the 26.92
- A Worse Score Is Not a Worse Model: reading a Brier score after a miss
- The Tampa Bay Buccaneers and Dallas Cowboys team pages, and the prediction ledger
Go deeper
Want the code behind these metrics? Work through the 43-chapter NFL analytics tutorial.
Browse tutorials Free tools