Two London Games, Two Rules
Philadelphia and Jacksonville play at Tottenham Hotspur Stadium on Sunday, October 11, at 09:30 ET. The prediction ledger's row for the game was locked on October 6 with Philadelphia at 1544.8, 12th on the board and 2-2, and Jacksonville at 1612.3, 5th and 3-1. It prices Jacksonville at .6603. That number includes the engine's 48-point home edge, because the schedule file codes the game location=Home. Coded Neutral, the same two ratings would give Jacksonville .5959. ESPN lists the game as a neutral site, and the same schedule file codes Jacksonville's next game, Houston at Jacksonville at Wembley on October 18, as Neutral. As the file stands, the ledger will price two London games seven days apart under two different rules.
This was flagged in August. The international games page found the same coding on the opening board, pricing the Jaguars at 54.7% where a neutral coding would put them at 47.8%, and added: "If the Jaguars lose that game as a 54.7% favorite, this paragraph is where to look first." The ratings have moved since, and the coding is now the difference between .6603 and .5959, or .0644 of an expected win handed to Jacksonville.
DraftKings, as shown on ESPN's scoreboard at 10:07 ET on Tuesday, has Jacksonville -6.5 at -285/+230, a vig-free .7095, and the nflverse file carries the same prices. So the question the coding raises has an answer that does not depend on the ledger: is London a Jacksonville home game? The betting market has priced fourteen Jacksonville games in London since 2013, and Jacksonville has played them.
The Exhibit
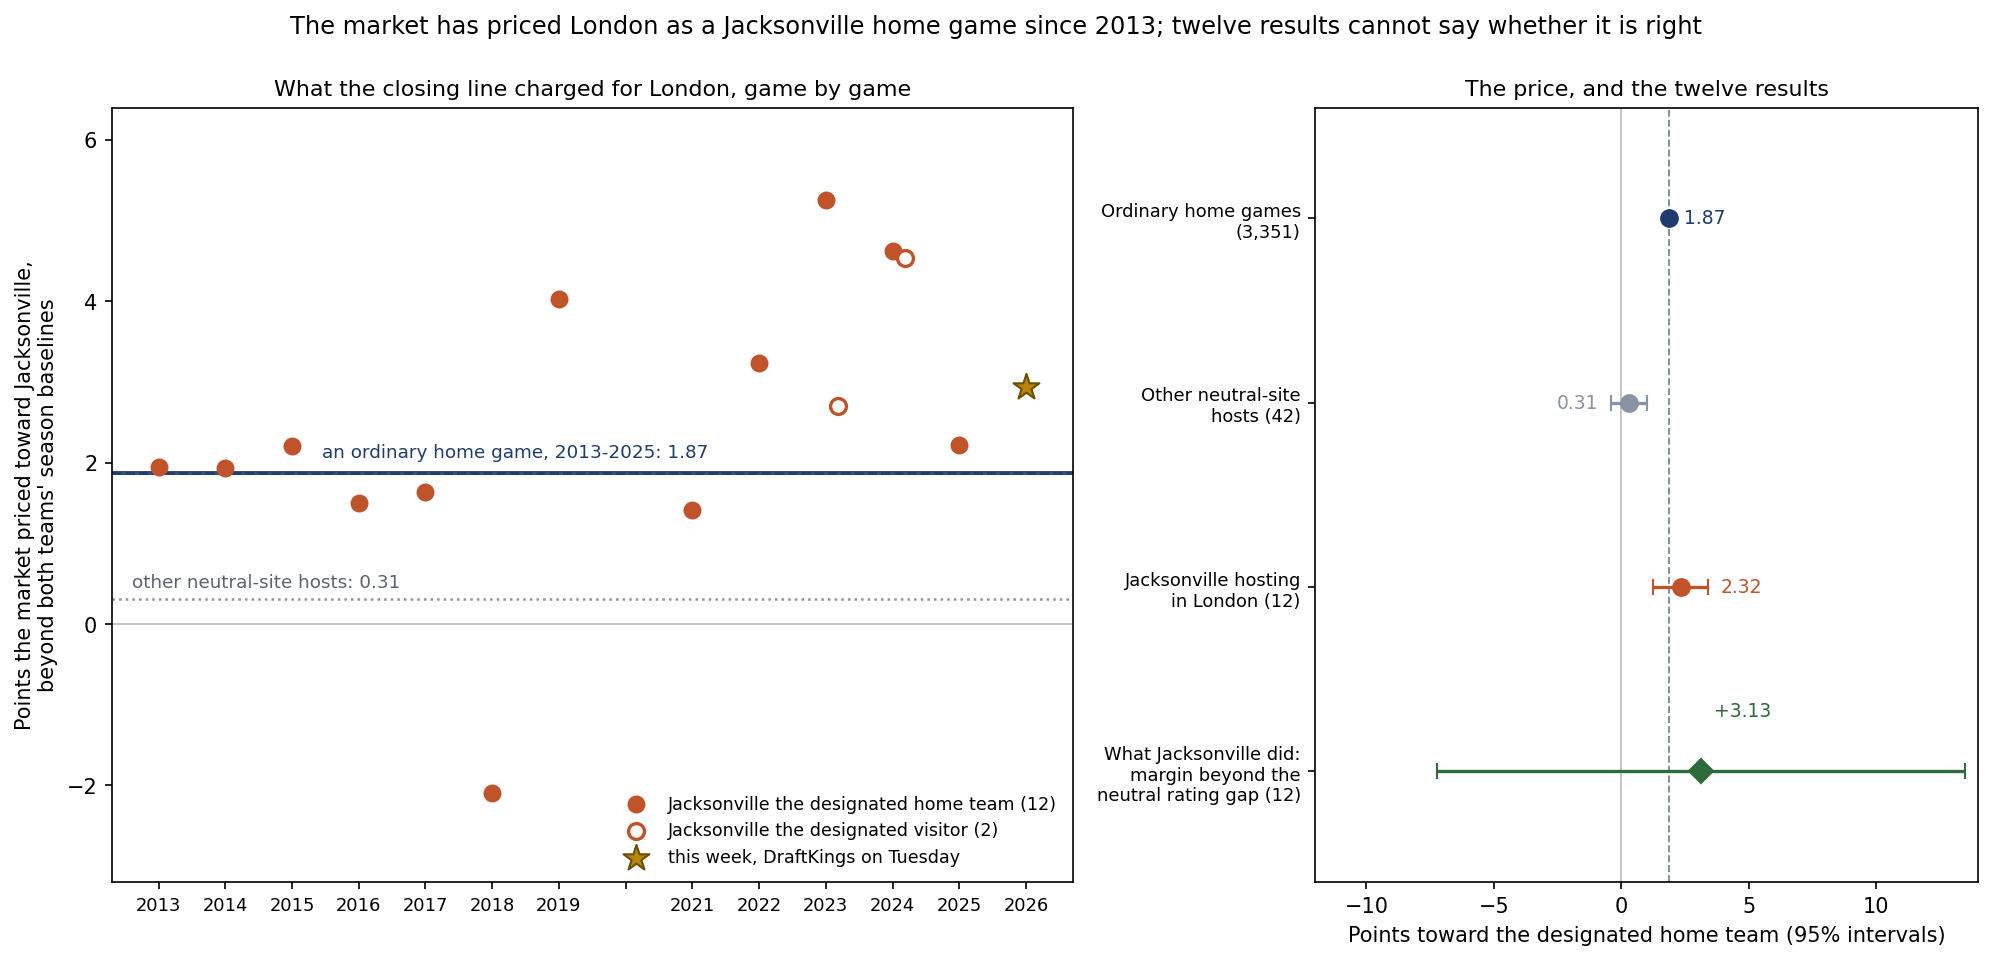
What the Closing Line Charged
A closing spread is the market's whole opinion of a game, the teams and the venue together. The engine's rating gap is an opinion of the teams alone. Convert the engine's neutral-site probability into points at the slope the fair-prices page fitted to 7,261 decided games with a closing line, .14262 in log-odds per point (each point of spread multiplies the odds by 1.153), and subtract it from the closing spread. What is left is the market's view of the venue, plus any disagreement between the market and the engine about the two teams. The second part is removed by netting out both teams' season baselines: each team-season's average gap between the market and the engine in its ordinary games, with home and road games weighted equally so that home field cancels. What remains is what the line charged for the venue.
| Games | Number | Charge in points, spreads | Charge in points, moneylines |
|---|---|---|---|
| Ordinary home games, 2013-2025 | 3,351 | 1.87 | 1.85 |
| Other neutral-coded games, 2013-2025 | 42 | 0.31 | 0.29 |
| Jacksonville hosting in London | 12 | 2.32 | 2.16 |
| Jacksonville visiting in London | 2 | 3.62 | 3.21 |
For an ordinary home game the line charged 1.87 points for the venue (SE .04), across 3,351 games. For the 42 other games the file codes Neutral over the same seasons it charged 0.31 (SE .36), 0.9 standard errors from zero: for those designated hosts the market, the ledger and the international page all agree that there is no measurable home field. For Jacksonville's twelve London home games it charged 2.32 points (SE .55), more than four standard errors from zero and 0.8 standard errors above an ordinary home game. Over the same seasons it charged 1.75 points a season, on average, for Jacksonville's games in Jacksonville. London has been priced as at least a full home game.
It does not depend on which side of the schedule Jacksonville is listed on. In 2023 and 2024 Jacksonville was the designated visitor at Tottenham, in games Buffalo and Chicago nominally hosted, and the line still leaned to Jacksonville by 2.70 and 4.54 points, an average of 3.62. In 13 of the 14 London games the charge favoured Jacksonville; across all fourteen it averaged 2.51. The single exception was the 2018 game, also against Philadelphia, at -2.09. Pricing the same games from the closing moneylines instead of the spreads gives 2.16 against 1.85 for an ordinary home game and 0.29 for the other neutral-coded games. The fitted intercept on the fair-prices slope, left out here, is worth 0.19 points and would lower every row by the same amount, leaving every comparison unchanged.
| Season | Opponent | Jacksonville as | Venue | Closing line | Result | London charge |
|---|---|---|---|---|---|---|
| 2013 | San Francisco | host | Wembley | Jacksonville +16 | L 32 | +1.94 |
| 2014 | Dallas | host | Wembley | Jacksonville +7.5 | L 14 | +1.93 |
| 2015 | Buffalo | host | Wembley | Jacksonville +3.5 | W 3 | +2.20 |
| 2016 | Indianapolis | host | Wembley | Jacksonville -1 | W 3 | +1.50 |
| 2017 | Baltimore | host | Wembley | Jacksonville +3 | W 37 | +1.64 |
| 2018 | Philadelphia | host | Wembley | Jacksonville +4 | L 6 | -2.09 |
| 2019 | Houston | host | Wembley | Jacksonville -1 | L 23 | +4.03 |
| 2021 | Miami | host | Tottenham Hotspur | Jacksonville +2.5 | W 3 | +1.41 |
| 2022 | Denver | host | Wembley | Jacksonville -1 | L 4 | +3.23 |
| 2023 | Atlanta | host | Wembley | Jacksonville -3.5 | W 16 | +5.25 |
| 2023 | Buffalo | visitor | Tottenham Hotspur | Jacksonville +5.5 | W 5 | +2.70 |
| 2024 | New England | host | Wembley | Jacksonville -6.5 | W 16 | +4.62 |
| 2024 | Chicago | visitor | Tottenham Hotspur | Jacksonville -1.5 | L 19 | +4.54 |
| 2025 | The Rams | host | Wembley | Jacksonville +3 | L 28 | +2.22 |
What the Twelve Results Say
As the designated home team in London, Jacksonville went 6-6 straight up and 6-6 against the closing line, with an average margin of -2.42 points as 2.21-point underdogs on average. Against the closing line, London charge included, Jacksonville finished -0.21 points (SE 5.11) per game: the price was right on average. Against the engine's neutral expectation, which charges nothing for the venue, Jacksonville finished +3.13 points (SE 5.28) per game. That is the sign a home edge would leave, and it is nowhere near enough to tell the market's 2.32 points from zero. Counting the two games as the visitor, Jacksonville is 7-7 in London.
More games will not settle it soon. Results scatter around a closing line with a standard deviation of 13.20 points, as the spread-accuracy page measured across 7,276 games since 1999. Telling a 2.32-point edge from no edge at two standard errors would take about 129 games. Jacksonville has played fourteen in London since 2013, in every season but 2020 and never more than two in a year.
Nothing here overturns the international page's finding that a designated home team at a neutral site carries no measurable edge. Its 30-35-1 across 66 neutral-coded games includes these twelve, and for the other designated hosts the market's charge of 0.31 is statistically zero. Jacksonville is the one designated host abroad that the market prices differently, and the one the schedule file now codes differently, though only in week 5.
Sunday's Three Prices
Put in points at the same slope, the neutral coding makes Jacksonville a 2.72-point favourite, the ledger's .6603 a 4.66-point favourite and DraftKings' vig-free .7095 a 6.26-point favourite, close to the posted 6.5. Here the engine's 48-point home edge is worth 1.94 points, between an ordinary home game's 1.87 and the 2.32 the line has charged for Jacksonville in London.
The line of -6.5 sits 3.78 points beyond the engine's neutral rating gap of 2.72 points. Part of that is the market rating the two teams differently from the engine this season. From their first four games, two at home and two away for each, the 2026 baselines are -0.23 for Jacksonville and -1.07 for Philadelphia, which accounts for 0.84 of the 3.78. The remaining 2.93 points is this week's London charge, within one game-to-game standard deviation (1.89) of the 2.32 average. Four games make both baselines rough, so this is a reading, not a measurement.
The coding that looked like the error turns out to match the price. The Home coding gives Jacksonville 1.94 points on Sunday, about what the line has charged on average; the Neutral coding of the Wembley game against Houston, as the file stands on October 6, will give it nothing. Whether the market is right to charge it, twelve results cannot say.
What This Page Does Not Show
- Why the market charges it. Whatever the price is paying for, whether travel, a club's familiarity with the trip or the crowd, fourteen games cannot separate the reasons.
- A change to the ledger. The frozen .6603 stands, and so does the Neutral coding of week 6. The ledger follows the schedule file rather than overriding it, and the charge measured here is reported, not applied.
- A verdict on Sunday. The prices above were taken on Tuesday morning and will move before kickoff. The game will be graded against the ledger's frozen number.
- The venue record behind every row. The file's stadium field names TIAA Bank Stadium for the 2025 game against the Rams, though it codes that game Neutral with a 09:30 ET kickoff; ESPN's summary puts it at Wembley Stadium. The fourteen venues here are ESPN's, and every score matches the file. ESPN flags 13 of the 14 as neutral sites, all but the 2013 game.
Method and Sources
engine points  = ln(p / (1 - p)) / .14262, p = the engine's neutral-site probability   # walk-forward ratings
gap            = closing spread for the designated home team - engine points
baseline(team) = (mean gap in its home games + mean of minus the gap in its road games) / 2       # ordinary games, same season
charge         = gap - (baseline(home team) - baseline(away team))                    # same season
The script make_phi_jax_london_chart.py replays the engine over 1999-2025 and the 64 games of 2026 final through Monday, checks its ratings against the ledger's published ones for all 32 teams, reproduces the frozen .6603, computes every team-season baseline from closing spreads and again from moneylines, rebuilds both tables, checks each London venue and score against ESPN, and asserts every number on this page.
Sources: the nflverse public game log (games.csv), 1999-2025 from the copy bundled in June and 2026 from a pull on October 6, 2026, whose 1999-2025 rows, locations and kickoff times were checked identical; ESPN's public game summaries for the fourteen London venues; ESPN's week-5 scoreboard on October 5 and October 6 for the neutral-site flag and DraftKings' prices; the site's prediction ledger as published on October 6.
Further reading
- Houston at Tennessee: Two 0-4 Teams, 217.7 Points Apart: today's companion, on Sunday's meeting of two 0-4 teams
- The 48-Point Home Edge, Switched Off: the August page that flagged this coding
- Denver's Home Field, Measured: one team's home edge, measured from results and from the market
- Home-Field Advantage in the NFL Is Shrinking: the league-wide edge and its decline
- The Constants Nobody Tuned: the evidence that 48 points has been too many since 2018
- What a 60% Pick Is Worth: the slope used here
- How Accurate Is the Point Spread?: the 13.20-point scatter
- The Jacksonville Jaguars and Philadelphia Eagles team pages
Go deeper
Want the code behind these metrics? Work through the 43-chapter NFL analytics tutorial.
Browse tutorials Free tools