Favoured at Lambeau
Chicago plays at Green Bay on Sunday, October 11, at 13:00 ET at Lambeau Field. The prediction ledger's row for the game, locked on October 6, has Chicago at 1574.2, 10th on the board, and Green Bay at 1496.6, 17th: a gap of 77.6 rating points, or 29.6 once Green Bay's 48-point home edge is counted. That makes Chicago a .5424 favourite, worth about a point of spread on the scale that What a 60% Pick Is Worth fitted to the file. DraftKings, as shown on ESPN's scoreboard at 07:57 ET on Wednesday, has Chicago -3 at -155/+130, a vig-free .5830, 4.06 points higher than the ledger, and the nflverse file carries the same prices.
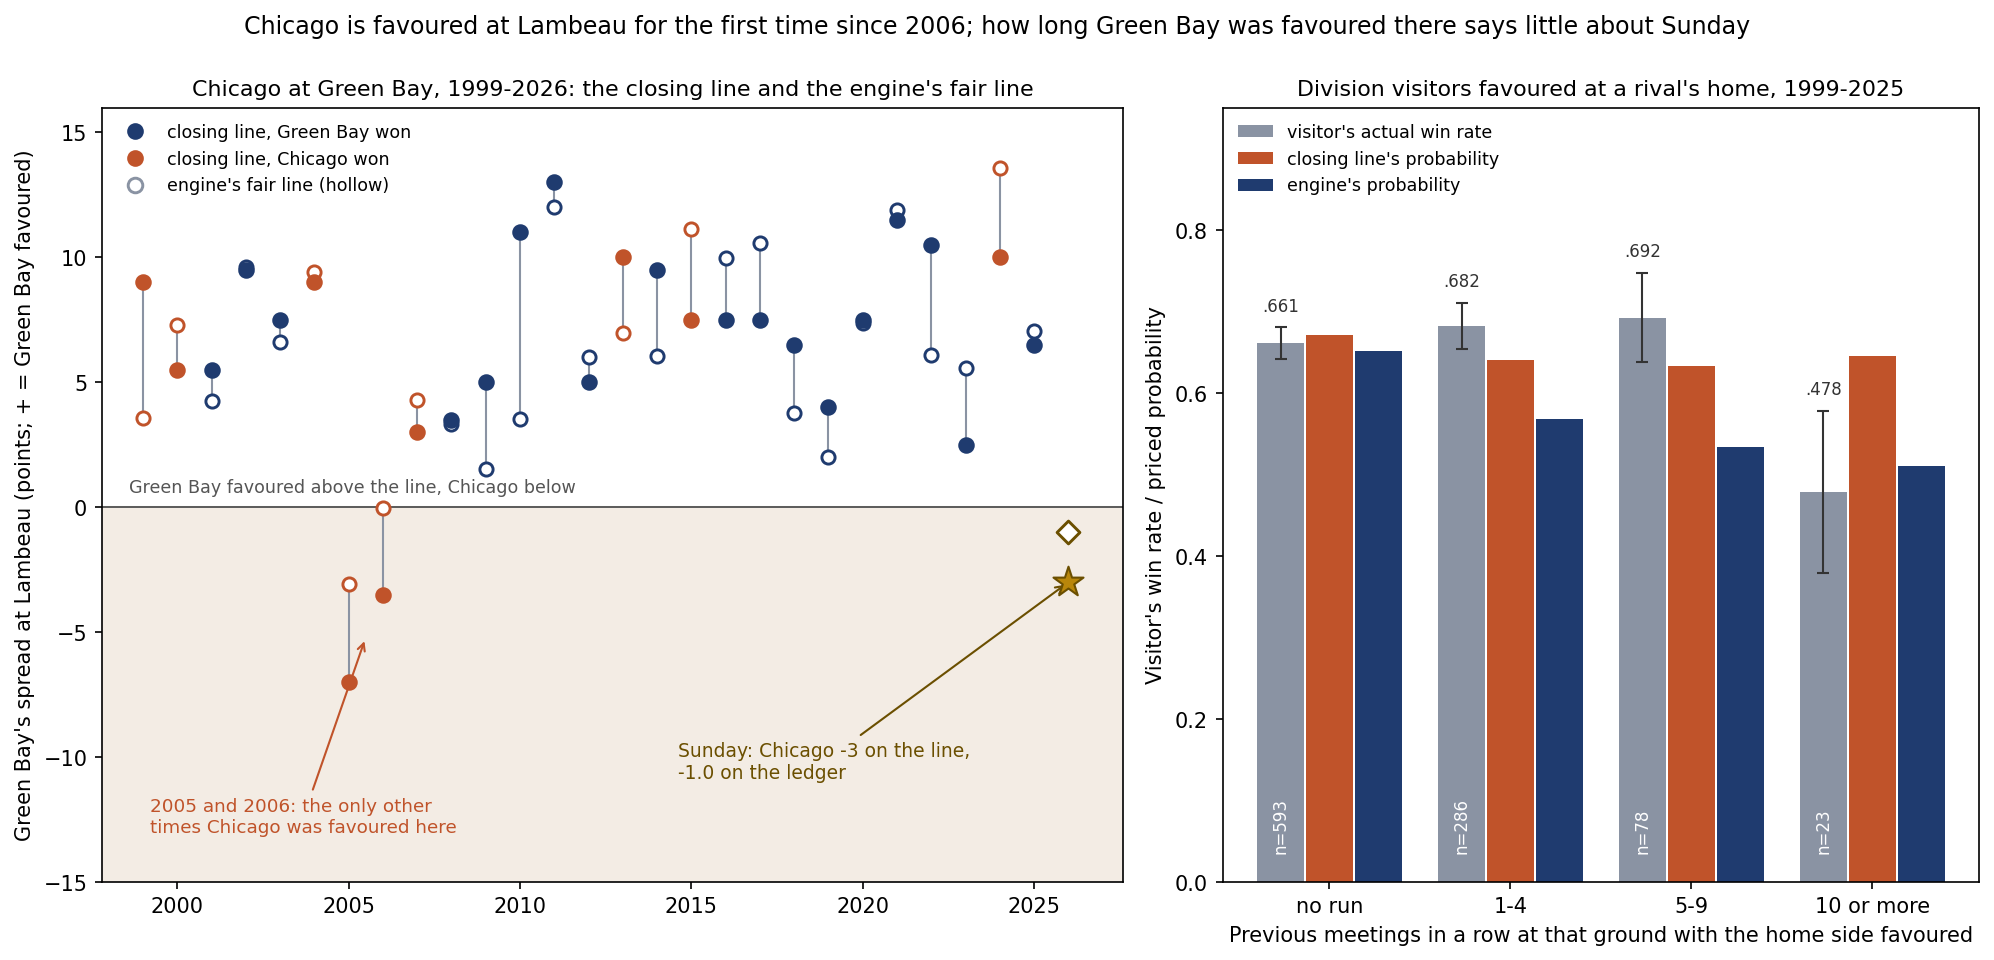
Neither pricer had favoured Chicago at Lambeau since 2006. The nflverse file carries a closing line for all 27 Chicago-at-Green Bay games from 1999 to 2025, one a season, and Green Bay was favoured in 25 of them, including the last 19 in a row, from 2007 to 2025. Chicago was favoured twice: by 7 on December 25, 2005, and by 3.5 in week 1 of 2006. It won both, 24-17 and 26-0. The site's engine, replayed walk-forward over the same file, favoured Chicago at Lambeau in the same two games, at .6138 and .5075, and in no other.
The Exhibit
How Four Weeks Turned It
In August the board had Green Bay 13th at 1535.9 and Chicago 15th at 1528.7. Priced on those ratings, this game would have made Green Bay a .5787 favourite, about 2.4 points. DraftKings' opening line, as ESPN's scoreboard reports it, was Green Bay -3 at -166/+140, a vig-free .4004 for Chicago. The two pricers started close together, with Green Bay a field-goal favourite or nearly so.
Then Chicago went 3-1 with a point differential of +47: it won 59-37 at Carolina, lost 9-3 at home to Minnesota, and beat Philadelphia 27-7 and the Jets 23-12. Green Bay went 2-2 at -32: it lost 39-22 at Minnesota, won 20-17 at the Jets, lost 35-14 at home to Atlanta and won 17-14 at Tampa Bay. Chicago's rating rose 45.5 points and Green Bay's fell 39.3. The engine has moved 3.4 points toward Chicago, from Green Bay by 2.4 to Chicago by 1.0. The market has moved six points, across the field-goal number: Chicago -2.5 at -148/+124 on Monday morning, -3 at the same price on Tuesday and -3 at -155/+130 on Wednesday, an 18.3-point rise in Chicago's vig-free probability since the opening price.
The teams met three times last season. Green Bay won 28-21 at Lambeau on December 7, 2025, Chicago won 22-16 at home on December 20, and Chicago won 31-27 at home in the wild-card round on January 10. After Sunday they meet again on December 25 in Chicago.
Nineteen in a Row
Since 1999 Green Bay is 18-9 at home against Chicago, with no ties, and 16-10-1 against the spread. Chicago won seven of the 25 games in which it was the underdog, four of them as an underdog of nine points or more: 1999, 2004, 2013 and 2024. The average line was Green Bay by 6.56 and the average result Green Bay by 7.00.
The market and the engine have mostly agreed about this game. Turning the engine's probability into a spread with the fair-prices fit, the closing line sat 0.24 points nearer Green Bay than the engine's number on average, 0.46 since 2007, with one wide disagreement: in week 17 of 2010 the line was Green Bay by 11 and the engine's number Green Bay by 3.5, a gap of 7.46. On the final margin the line missed by 9.41 points a game and the engine by 9.87. On Sunday the line sits 1.99 points further from Green Bay than the engine does, and that direction is not unusual either: it was true of 14 of the 27 earlier meetings.
Nineteen straight meetings with the home side favoured is the seventh-longest such run in the file for a division visitor at one rival's home, and Sunday makes it the sixth of the seven to end. The five longer ones that ended:
| Run | Game that ended it | Date | Line | Result |
|---|---|---|---|---|
| 22 | The Jets at New England | October 27, 2024 | Jets -7 | New England 25-22 |
| 21 | The Raiders at Denver | January 3, 2021 | Raiders -2.5 | The Raiders 32-31 |
| 20 | Cleveland at Pittsburgh | December 1, 2019 | Cleveland -1 | Pittsburgh 20-13 |
| 20 | Buffalo at New England | December 28, 2020 | Buffalo -7 | Buffalo 38-9 |
| 20 | Miami at New England | September 17, 2023 | Miami -2 | Miami 24-17 |
| 19 | Chicago at Green Bay | October 11, 2026 | Chicago -3 | Sunday |
The visitor won three of the five. The longest run in the file is still going: the Raiders at Kansas City, 23 meetings in a row with Kansas City favoured.
Does a Long Run Mean Anything?
A price that has just crossed after years on one side invites a question: is the market moving too far, too fast, or not far enough? The file can answer it for every division rivalry at once. From 1999 to 2025 there are 980 regular-season division games in which the visitor was favoured at the rival's home, and each one can be tagged with how many meetings in a row at that ground had gone the other way just before it. Graded against the closing line, converted to a probability with the fair-prices fit, and against the engine:
| Meetings in a row with the home side favoured | Games | Visitor won | The line said | The engine said | Against the spread |
|---|---|---|---|---|---|
| None | 593 | .661 | .671 | .651 | 283-294-16 |
| 1 to 4 | 286 | .682 | .640 | .568 | 151-127-8 |
| 5 to 9 | 78 | .692 | .633 | .534 | 39-35-4 |
| 10 or more | 23 | .478 | .645 | .510 | 7-15-1 |
After runs of one to nine meetings, the newly favoured visitor won .6841 of 364 games against .6388 from the line, so the market, if anything, has been a little short of the visitor. After runs of ten or more the record is 11 wins in 23 games, .4783 against .6454, and 7-15-1 against the spread. That is the only group in which the engine's lower number, .5097, scored better than the line, with a Brier score of .2371 against .2617.
It is also 1.68 standard errors from its price, on 23 games. A single group lands that far from its line about one time in eleven by chance, and at least one of four groups does so about one time in three. The test that needs no grouping finds nothing: across all 980 games, each extra meeting in the run moves the visitor's result against the line by 0.00 points, with a standard error of 0.54. None of the four groups is two standard errors from its line, and across all 980 the visitor won .6653 against .6581.
So twenty years of Green Bay favoured at Lambeau is a fact about the past, not evidence about Sunday. The 23 long-run games are the one place in the file that points the other way, and they are too few to act on.
Sunday's Two Numbers
The ledger's .5424 is frozen and will be graded on the result. DraftKings' .5830 is a Wednesday-morning price and will move before kickoff. The two agree on the side and differ by 4.06 points on the size, about two points of spread. That is a smaller disagreement than usual: in 64.2% of the 4,174 regular-season games from 2010 to 2025 with a moneyline in the file, the engine and the closing price were further apart than that, and the median gap was 6.05 points.
For the ledger's pick to miss, Green Bay has to win at home, as it has in 18 of 27 meetings since 1999. That record belongs to other seasons and other rosters; the ledger's .4576 for Green Bay is the number that will be graded.
What This Page Does Not Show
- Why the market moved. The engine reads final scores only, with no rosters, injuries or quarterbacks. The market reads all of those, and the 18.3-point move since the opening price is its own account of something this page cannot see. The page does not explain it.
- When the opening line was posted. ESPN's scoreboard reports DraftKings' opening price without a date.
- A verdict on Sunday. The ledger's .5424 will be graded on the result; a single game cannot confirm or refute either price.
- Small samples. The series is 27 games, and the long-run group 23. The four groups are one way to cut the runs; the regression on run length, which needs no grouping, is the check that does not depend on where the cuts fall.
- Neutral sites and the postseason. Both are left out of the run counts, and both of last season's later meetings were in Chicago.
Method and Sources
line probability = 1 / (1 + exp(-(-0.0265 + 0.14262 x home spread)))    # the fair-prices fit
engine fair line = (ln(p / (1 - p)) + 0.0265) / 0.14262                  # the same fit, inverted
run              = meetings in a row at the host's home, before this one, with the host favoured
                   (regular-season division games, not at a neutral site; a level line ends a run)
event            = a division game in which the visitor is favoured at the host's home    # 980, 1999-2025
The script make_chi_gb_lambeau_chart.py replays the engine over 1999-2025 and the 64 games of 2026 final through Monday, checks its ratings against the ledger's published ones for all 32 teams, reproduces the frozen .4576, prices the game on the August board, reads the three DraftKings snapshots, finds every Chicago-at-Green Bay game and every division visitor favoured at a rival's home with the run it ended, and asserts every number on this page. Franchises that moved are followed under their current codes, so the Raiders' run at Kansas City counts Oakland's games there.
Sources: the nflverse public game log (games.csv), 1999-2025 from the copy bundled in June and 2026 from a pull on October 7, 2026, whose 1999-2025 rows were checked identical; ESPN's scoreboards for weeks 1 to 4, whose 64 final scores match the file's, and for week 5 on October 5, 6 and 7 for the venue and DraftKings' prices; the site's prediction ledger as published on October 6.
Further reading
- Remaining Strength of Schedule After Week 4, Measured: today's companion, in which Chicago has the hardest road left
- The 2026 NFC North: The Division That Flipped Upside Down: the division's head-to-head record since 2002
- What a 60% Pick Is Worth: The 2026 Openers at Fair Prices: the fit that turns a probability into a spread
- The Road Favorite Discount That Isn't There: road favourites in general, measured
- Division Games and Home Field: Why Familiar Rivals Travel Better: home field inside a division
- Atlanta 35, Green Bay 14: The Swing Back, Graded: Green Bay's week-3 loss
- The Chicago Bears and Green Bay Packers team pages, and the power rankings
Go deeper
Want the code behind these metrics? Work through the 43-chapter NFL analytics tutorial.
Browse tutorials Free tools