Which Week-3 Results Actually Move the Picture
Every week this site publishes sixteen probabilities and, a few days later, grades them. That answers who the model thinks will win. It says nothing about which of those sixteen results will matter, and the two questions have very different answers.
So this page asks the second one, before a snap is played. For each week-3 game I took the board as it stands this morning, forced the game to a home win, forced it to an away win, and ran the site's 20,000-season simulation both ways. The difference between the two boards is what the result is worth: how many points of playoff probability change hands, and where they land.
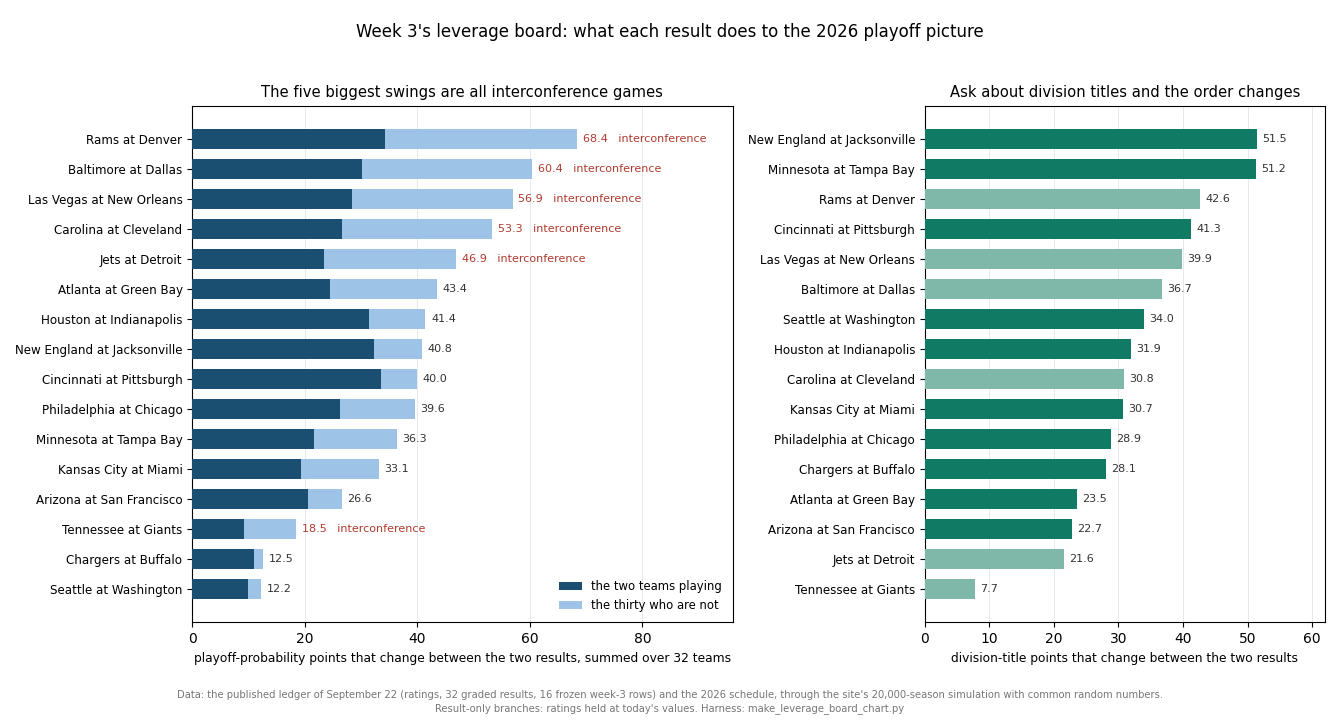
The headline is structural rather than about any team. The five games that move the most playoff probability are all interconference games, and in every one of them exactly half of the movement lands on teams that are not playing. That is not a coincidence of this week's schedule. It is arithmetic, and it is the reason a Rams game in Denver matters more to the Chicago Bears than most people would guess.
All of it is pre-game. The ledger froze these sixteen rows on September 22 and none has been graded; the harness asserts that before it computes anything.
The Exhibit
How the Board Is Priced
The simulation is the one behind the playoff-odds page: every remaining 2026 game is played 20,000 times from the published ratings, the 32 graded results of weeks 1 and 2 are fixed in every run, and each simulated season awards four division titles and three wild cards per conference. The harness checks the bookkeeping on every run: fourteen playoff seats and eight division titles, no more and no fewer.
Two choices keep the comparison honest. Each game's two branches are result-only: the ratings are held at this morning's values, so the only thing that differs is one win moving from one column to the other. And the two runs share their random numbers, so the other 239 remaining games break identically in both; the difference is the game and nothing else.
The check that this works is simple. If each branch is weighted by the ledger's own probability for the game, the two must average back to today's board. They do: across all sixteen games and all 32 teams, the worst disagreement is 0.34 of a percentage point.
Today's board, for reference: Seattle 97.3 per cent to make the playoffs, Buffalo 95.6, Green Bay 36.1, Atlanta 8.0 and Tennessee 0.5.
The Sixteen, by What They Move
| Game | Ledger, home | Swing | The two teams | Everyone else | Expected move | Division titles |
|---|---|---|---|---|---|---|
| the Rams at Denver | 0.5692 | 68.4 | 34.2 | 34.2 | 33.5 | 42.6 |
| Baltimore v Dallas, Rio de Janeiro | 0.3790 | 60.4 | 30.2 | 30.2 | 28.4 | 36.7 |
| Las Vegas at New Orleans | 0.6302 | 56.9 | 28.5 | 28.5 | 26.3 | 39.9 |
| Carolina at Cleveland | 0.5437 | 53.3 | 26.7 | 26.7 | 26.4 | 30.8 |
| the Jets at Detroit | 0.7803 | 46.9 | 23.4 | 23.4 | 15.9 | 21.6 |
| Atlanta at Green Bay (Thursday) | 0.7139 | 43.4 | 24.4 | 19.0 | 17.9 | 23.5 |
| Houston at Indianapolis | 0.4042 | 41.4 | 31.4 | 10.0 | 19.9 | 31.9 |
| New England at Jacksonville | 0.5096 | 40.8 | 32.3 | 8.4 | 20.4 | 51.5 |
| Cincinnati at Pittsburgh | 0.5382 | 40.0 | 33.5 | 6.5 | 19.9 | 41.3 |
| Philadelphia at Chicago | 0.4837 | 39.6 | 26.3 | 13.3 | 19.8 | 28.9 |
| Minnesota at Tampa Bay | 0.3599 | 36.3 | 21.7 | 14.7 | 16.6 | 51.2 |
| Kansas City at Miami | 0.3765 | 33.1 | 19.3 | 13.8 | 15.6 | 30.7 |
| Arizona at San Francisco | 0.7983 | 26.6 | 20.5 | 6.0 | 8.2 | 22.7 |
| Tennessee at the Giants | 0.7147 | 18.5 | 9.2 | 9.2 | 7.6 | 7.7 |
| the Chargers at Buffalo | 0.7968 | 12.5 | 10.9 | 1.6 | 4.1 | 28.1 |
| Seattle at Washington | 0.2181 | 12.2 | 9.9 | 2.3 | 4.3 | 34.0 |
Swing: playoff-probability points, summed over all 32 teams, that differ between the home-win and away-win boards. Expected move: the same, weighted by the ledger's probability and measured from today's board, so it is what the result is likely to do rather than what it could do. Shaded rows are interconference games. Baltimore and Dallas meet at the Maracanã in Rio de Janeiro, so that game carries no home-field constant.
Why Interconference Games Split Exactly in Half
Look at the shaded rows: the two teams' share and everyone else's share are the same number every time. 34.2 and 34.2 for the Rams at Denver; 30.2 and 30.2 in Rio; 9.2 and 9.2 even for Tennessee at the Giants. The harness checks all six to nine decimal places.
The reason is that playoff seats are handed out within a conference, seven each, and they are conserved. When Denver beats the Rams instead of losing to them, exactly one AFC team's win total changes: Denver's. Every seat Denver gains in that branch has to come from some other AFC team, and because the other AFC clubs' records are untouched, the only way they can move is down. So the AFC bystanders lose exactly what Denver gains. The same happens in the NFC, in the other direction, for the Rams. Add the two conferences up and the bystanders move precisely as much as the two teams do.
A conference game breaks that symmetry. When Houston plays Indianapolis, one AFC team gains a win and another AFC team loses one, and most of the seat that changes hands passes directly between them. The bystanders still move — division titles make the effects run both ways — but they absorb less: across this week's ten conference games, 41.6 per cent of what the two teams move, against exactly 100 per cent in the interconference six.
That is why the top of the table looks the way it does. The Rams at Denver has the largest effect on its own two teams of any game this week, 15.1 points for Denver (from 74.2 today) and 19.1 for the Rams (from 57.8), and then doubles it. The largest single bystander effect of that game lands on Chicago, 3.2 points, in a race Denver is not even in: an NFC wild-card seat the Rams either take or leave.
Three Ways to Rank the Same Sixteen Games
Which game "matters most" depends on the question, and the answers genuinely disagree.
Counting only the two teams playing, the Rams at Denver still leads at 34.2, but it is followed by three AFC conference games: Cincinnati at Pittsburgh 33.5, New England at Jacksonville 32.3 and Houston at Indianapolis 31.4. Those are the games that matter most to the teams in them.
Weighting by how likely each result is changes the middle of the list. The Jets at Detroit has the fifth-largest swing, 46.9, but the ledger makes Detroit a .7803 favourite, and a favourite winning mostly leaves the board where it already is. Its expected move is 15.9, eleventh of sixteen. The game is almost entirely about Detroit: 18.9 points of its playoff odds ride on it, against 4.6 for the Jets. Summed across all sixteen, the week is expected to move 284.6 points of playoff probability.
Asking about division titles reorders it again. New England at Jacksonville moves 51.5 points of division-title probability and Minnesota at Tampa Bay 51.2, the top two, while Carolina at Cleveland — fourth by playoff swing — drops to ninth. A game between division rivals, or between two teams who both lead their divisions, decides titles in a way a cross-conference game cannot.
And at the bottom: Tennessee, at 0.5 per cent today, moves 0.8 points whichever way its game goes. Its game still ranks fourteenth by swing only because the Giants' odds, 12.4 per cent today, move 8.5 points on it. The Chargers at Buffalo and Seattle at Washington close the list at 12.5 and 12.2: one side of each is already nearly in, the other nearly out.
Where the Market Disagrees
This morning's DraftKings prices, pulled from ESPN's scoreboard and stripped of their margin, sit beside the ledger in the harness. They do not enter the simulation; this is a comparison, not an input.
The widest disagreement of the week is Kansas City at Miami: the ledger gives Miami 0.3765, the market 0.1370, with Kansas City -900 and favoured by 11.5. Then Cincinnati at Pittsburgh, where the market has Pittsburgh at 0.3691 against the ledger's 0.5382; Tennessee at the Giants; and Philadelphia at Chicago. The two pick opposite sides in three games — Carolina at Cleveland, Cincinnati at Pittsburgh, and the most leveraged game of the week, where the market makes the Rams 2.5-point favourites at Denver.
Thursday's game is the other extreme. Atlanta at Green Bay is 0.7139 in the ledger and 0.7002 at -270: model and market within 1.4 points, on a game that ranks sixth by swing. Whether the ledger or the market is closer on these games will be settled on Sunday and graded here; the calibration study explains why two weeks of results is too few to judge either one yet.
What This Does Not Tell You
- The ratings do not move inside a branch. A real Denver win also lifts Denver's rating and lowers the Rams', which changes every later game's probability. Holding ratings fixed isolates the result; including the rating move would make every swing somewhat larger. The week-2 Thursday page priced both versions for one game.
- The simulation's tiebreaker is random. Ties on record are broken by a coin, not the league's head-to-head and division-record ladder, so a result that matters mainly through a tiebreaker is under-counted.
- Raw ratings, not shrunk ones. The out-of-sample calibration test found this board over-confident this early in a season. A shrunk board would spread probability more evenly and give the middle of the table somewhat larger swings.
- Twenty thousand seasons is a sample. The common random numbers make the branch differences far steadier than two independent runs would be, but figures in the tenths are still simulation estimates.
Related
- What Would Change Its Mind — the same sixteen picks, measured by how far each is from flipping.
- What a Fortnight Bought — the week-3 board priced on August ratings and on today's.
- The Six Games That Count Double — why division games carry extra weight in a race.
- What Sunday Can Do — a slate of picks treated as one distribution.
- The 2026 miss budget — how many of these picks the model expects to get wrong.
- The prediction ledger — every frozen probability and its grade.
Reproducibility
Every figure on this page is computed by make_leverage_board_chart.py from the published ledger (data/predictions.json, as updated September 22), the 2026 schedule, and _2026_week3_espn_2026-09-23.json, ESPN's week-3 scoreboard as pulled the morning of September 23, 2026. The script runs 188 assertions before it draws the chart, including the exact interconference identity on all six games, the coherence check on all sixteen, and that each frozen probability is arithmetic on the two published ratings. Nothing on the page is typed in by hand.
Go deeper
Want the code behind these metrics? Work through the 45-chapter NFL analytics tutorial.
Browse tutorials Free tools