Three Long Trips
Three of week 5's remaining games send a team three time zones from home. Las Vegas plays at New England on Sunday at 13:00 ET, 10:00 on the Raiders' own clock. Detroit plays at Arizona at 16:25 ET; Arizona keeps standard time all year, so until daylight time ends in November it sits three hours behind Detroit, and the game starts at 13:25 local time. On Monday night Buffalo plays the Rams at SoFi Stadium at 20:15 ET, 17:15 in Inglewood. The prediction ledger froze all three on October 6 with the same 48-point home edge it gives a game between neighbours. The engine knows who is at home, not how far the visitors travelled.
Whether it should know is a question the file can answer. Every regular-season game from 1999 to 2025 has a host, a visitor and a date, and the IANA time-zone database turns each into the clock change the visiting team made. Measured against the engine's number and against the closing spread, the 6,900 games played at a home venue show what a trip has cost.
The Exhibit
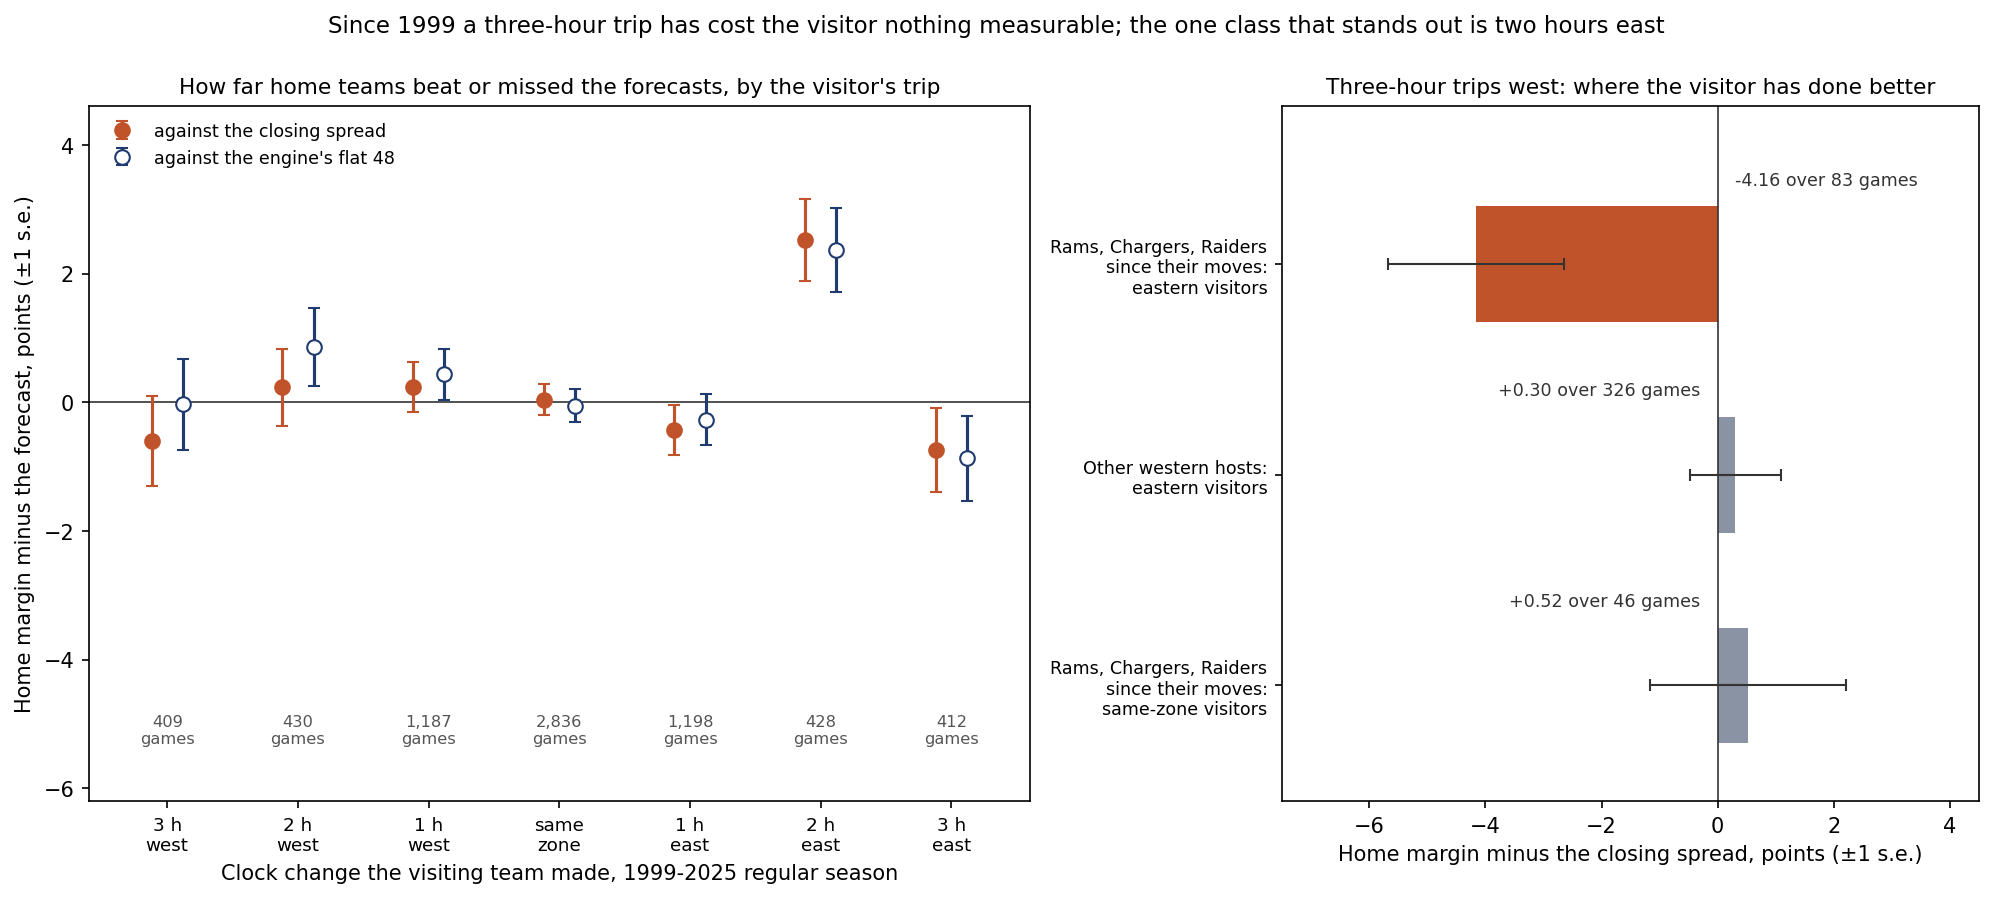
What a Time Zone Has Cost, 1999 to 2025
| Visitor's clock change | Games | Home won | The engine said | Home margin | Closing spread | Margin minus spread (s.e.) | Spread minus the engine |
|---|---|---|---|---|---|---|---|
| 3 hours west | 409 | .554 | .555 | 1.92 | 2.52 | -0.60 (0.70) | +0.57 |
| 2 hours west | 430 | .562 | .543 | 2.43 | 2.20 | +0.23 (0.60) | +0.63 |
| 1 hour west | 1,187 | .598 | .580 | 3.18 | 2.94 | +0.24 (0.39) | +0.20 |
| Same zone | 2,836 | .552 | .559 | 2.03 | 1.99 | +0.04 (0.24) | -0.09 |
| 1 hour east | 1,198 | .538 | .547 | 1.42 | 1.85 | -0.43 (0.39) | +0.16 |
| 2 hours east | 428 | .633 | .576 | 4.97 | 2.45 | +2.52 (0.64) | -0.15 |
| 3 hours east | 412 | .539 | .561 | 1.28 | 2.02 | -0.74 (0.65) | -0.13 |
West and east are the visitor's direction of travel: three hours west is an eastern team at a Pacific host. Margins and spreads are the home side's, in points. The last column is what the closing spread charged beyond the engine, once the engine's probability is turned into points with the fit from What a 60% Pick Is Worth.
Across all 6,900 games both forecasts get the home side right on average: home teams won .563 against the engine's .560 and beat the closing spread by 0.07 points. The three-hour trips do not change that. When the visitor came three hours west, the home side fell short of the closing spread by 0.60 points and finished 0.1 points of probability under the engine's number; when it came three hours east, 0.74 points and 2.2. Both are about one standard error from nothing, and both lean the wrong way for the travel story: the long-distance visitors did slightly better than priced.
The market charges for some trips anyway. In same-zone games the closing spread sits 0.09 points under the engine's number. When the visitor came two or three hours west it sits 0.63 and 0.57 points above it, a charge of 0.72 and 0.66 points relative to same-zone games that the engine does not make. For trips of two or three hours east it charges nothing extra. On the three-hour trips west the results did not earn the charge.
One class does point the way the travel story says. When the visitor came two hours east, mostly Pacific teams at Central hosts (264 of the 428 games) and Denver and Arizona at hosts further east (161), the home side beat the closing spread by 2.52 points, 3.9 standard errors, beat the engine by 2.37, and covered .547 of the time. It held in September and October, +2.77 over 193 games, and from November on, +2.31 over 235. It does not grow with distance, though: one hour east the home side fell short of the spread by 0.43 points, and three hours east by 0.74. A cost that appears at two hours and is gone at three is hard to read as jet lag, and this page does not explain it.
The 1 p.m. Body Clock, and Monday Night
The most repeated version of the travel story is the western team in a 13:00 ET game, kicking off at 10:00 on its own clock, which is Las Vegas on Sunday. The file has 312 such games with a three-hour trip and a recorded kickoff time. The hosts won .554 against the engine's .564 and fell short of the closing spread by 0.22 points, with a standard error of 0.74. The 85 later kickoffs on the same trip went further the visitors' way, 2.02 points against the spread at 1.4 standard errors. There is no sign of a 10 a.m. penalty.
Monday's game is the other version: an eastern team at a western host at night. In the 67 three-hour trips west that kicked off at 19:00 ET or later, the hosts beat the spread by 1.74 points with a standard error of 1.63, and in the 27 played on Mondays they fell short by 0.56, with a standard error of 2.53. Neither is distinguishable from zero.
Where the Visitor Has Done Better
Two splits of the same games lean one way, and both were made after looking at the table, which makes their standard errors look more convincing than they are. The first is time:
| Seasons | 3 hours west: games | Margin minus spread (s.e.) | Same zone: games | Margin minus spread (s.e.) | 3 hours east: games | Margin minus spread (s.e.) |
|---|---|---|---|---|---|---|
| 1999-2009 | 148 | +0.46 (1.20) | 1,118 | -0.69 (0.39) | 148 | +0.68 (1.10) |
| 2010-2017 | 126 | +0.93 (1.23) | 841 | +0.50 (0.46) | 117 | -0.16 (1.21) |
| 2018-2025 | 135 | -3.20 (1.17) | 877 | +0.52 (0.42) | 147 | -2.63 (1.09) |
Before 2018 the long trips sat within a point of the closing spread in both directions. Since then the visitors have beaten it in both, and eastern hosts of western teams won only .374 of their games against the engine's .511. That runs against the travel story, not for it. This season has gone the other way so far: the hosts are 7-1 in the eight three-hour trips of weeks 1 to 4, a sample of eight.
The second split is the host. The Rams moved to Los Angeles in 2016, the Chargers in 2017 and the Raiders to Las Vegas in 2020, and 71 of their 83 home games against visitors three hours from home fall in 2018-2025. In those 83 games the hosts won .458 against the engine's .563, fell short of the closing spread by 4.16 points, with a standard error of 1.51, 2.7 standard errors, and covered 40.7% of the time. Against visitors from their own zone the same three hosts were +0.52 over 46 games, and the other western hosts against eastern visitors were +0.30 over 326. Whatever the pattern is, it belongs to the three hosts more than to the trip. The Rams alone, against eastern visitors since 2016: 29 games, .483 against the engine's .595, 3.76 points short of the spread, with a standard error of 2.82. Moving cities is one thing the three share; this page measures nothing about crowds, travel days or rosters, and tests none of them.
Week 5's Trips, Priced
| Game | Kickoff (ET) | Visitor's clock change | The ledger, host | DraftKings, Friday 09:29 ET, host | Market minus ledger |
|---|---|---|---|---|---|
| Las Vegas at New England | Sun 13:00 | 3 hours east | .7644 | .6369 (New England -3.5, -198 / +164) | -12.7 |
| Detroit at Arizona | Sun 16:25 | 3 hours west | .3601 | .3042 (Detroit -5.5, +215 / -265) | -5.6 |
| Buffalo at the Rams | Mon 20:15 | 3 hours west | .5080 | .6092 (the Rams -3, -175 / +145) | +10.1 |
| Denver at the Chargers | Sun 16:05 | 1 hour west | .3680 | .3908 (Denver -3.5, +145 / -175) | +2.3 |
Host win probabilities. DraftKings' prices are from ESPN's scoreboard at 09:29 ET on Friday, October 9, a snapshot that will move before kickoff, not closing prices; moneylines are listed home / away, with the margin removed in proportion. Philadelphia and Jacksonville play in London, a trip for both teams that Is London a Jacksonville Home Game? covered. Every other remaining week-5 game is played in the visitor's own time zone, and all four games above have equal rest.
The ledger adds nothing for any of these trips, and the history gives no general reason to. The market's numbers this morning differ from the ledger's by far more than any travel charge it has made: its usual premium for a westward trip, about two-thirds of a point, is worth about 2.3 points of probability in an even game. At New England the market is 12.7 points less sure of the host than the ledger, the opposite of a travel charge. At Arizona it is 5.6 points surer of the travelling team. Only Monday's gap points the way a travel charge would, 10.1 points toward the Rams, more than four times the market's usual westward premium. These are disagreements about the teams, and the week-5 page on the ledger and the market sets them against sixteen seasons of the same comparison.
The one pattern above that touches these games runs against a host: the three teams that moved, the Rams among them, have done worse against eastern visitors than either forecast expected. It was found by looking, its standard error is wide, and nothing in it says whether it will hold. It is not a number this page would add to either forecast.
What This Page Does Not Show
- Miles. The measure is the clock change, not the distance: a trip from Seattle to Miami and one from Oakland to Atlanta count the same.
- Rest and travel days. The file records days of rest, and Does Rest Matter in the NFL? measures them; this page does not adjust for them. It knows nothing about when a team flew.
- Crowds. Nothing here measures who fills the stands, so the host pattern is described, not explained.
- A clean test. This page reports 26 averages with a standard error, and among that many about one would land two standard errors from zero by chance. The two-hour eastward class, at 3.9, is harder to explain away, and the page leaves it open. The era and host splits were made after looking, and they overlap: 71 of the 83 moved-host games are among the 135 recent westward trips.
- Closing prices for week 5. This morning's prices are a snapshot. The history is graded on closing spreads.
- Some kickoff times. The file gives no kickoff time, or 09:00 ET, for 350 games from 1999 to 2005, the 1999 season's Sundays and most of that era's Monday games; the kickoff-time splits leave them out. The clock change itself does not depend on the hour.
- Neutral sites. The 66 neutral-site games since 1999, London among them, are left out, as is New Orleans' 2005 home game against the Giants, played at Giants Stadium.
- Advice. The page compares forecasts with results. It recommends no wager and links to no sportsbook.
Method and Sources
clock change   = venue clock - visitor's home clock, at kickoff         # IANA zones; Arizona and pre-2006 Indianapolis keep standard time
engine         = walk-forward Elo with a flat 48-point home edge       # the ledger's model, replayed from 1999
against spread = home margin - closing spread                          # the nflverse file's spread_line, home side
engine spread  = (ln(p / (1 - p)) + 0.0265) / 0.14262                  # the fair-prices fit, inverted
games          = 1999-2025 regular season at a home venue: 6,900
The script make_cross_country_trips_chart.py assigns every franchise code its home time zone season by season (STL, SD and OAK before the moves; LA, LAC and LV after), checks the zone rules on known dates, replays the engine over 1999-2025, computes each game's clock change at kickoff, sorts the 6,900 games by it, computes every split on this page, reads the ledger's frozen week-5 rows and this morning's DraftKings prices, and asserts every number on this page.
Sources: the nflverse public game log (games.csv), 1999-2025 from the copy bundled in June, checked identical to a pull at 09:29 ET on October 9, 2026, which also supplies the 2026 schedule and results; the IANA time-zone database as shipped with Python's zoneinfo; ESPN's week-5 scoreboard, pulled October 9, for venues, kickoff times and DraftKings' prices; the site's prediction ledger after the October 9 build.
Further reading
- Tampa Bay 24, Dallas 16: The Ledger Beat Every Price: today's companion, Thursday's game graded
- Week 5: Where the Ledger and the Market Disagree: every week-5 game against the market
- Is London a Jacksonville Home Game? The Price Says Yes: the week's longest trip
- Denver's Home Field, Measured: Above Average, Not Exceptional: one host's edge, measured the same way
- Home-Field Advantage in the NFL Is Shrinking: 27 Seasons of Evidence: the edge itself
- Does Rest Matter in the NFL? What 27 Seasons of Schedules Show: the other schedule effect
- The Constants Nobody Tuned: where the flat 48 comes from
- The New England, Arizona and Rams team pages, and the prediction ledger
Go deeper
Want the code behind these metrics? Work through the 43-chapter NFL analytics tutorial.
Browse tutorials Free tools