The First Two Byes
Kansas City and Carolina are off this week, the first byes of 2026, and from week 6 they play thirteen straight weeks to January 10. The schedule-quirks page called that painfully early in August. The usual worry is the back end: a team that rested in early October and is on its twelfth or thirteenth game in a row in January, against opponents who rested in November. Two other teams carry the same thirteen-game run at the other end of the season: Arizona and Dallas play weeks 1 to 13 before their week-14 byes.
The two bye teams arrive in different shape. Kansas City is 4-0 at +41, after 31-10 over Denver, 33-30 over Indianapolis, 24-10 at Miami and 30-27 at Las Vegas, and the engine has moved it from 17th in August to 9th, at 1580.9. Carolina is 2-2 at +12, after losing 59-37 to Chicago, winning 34-3 at Atlanta, losing 21-18 at Cleveland and beating Detroit 32-26, and has moved from 26th to 21st, at 1453.7. Neither plays this weekend, so nothing below depends on a game still to be played.
Since 2002, with 32 teams and one bye each, the file has 766 team-seasons whose bye can be read off the schedule, 166 of them in week 5 or earlier. That is enough to ask whether a long run of games without a week off has cost anything, measured against two forecasts: this site's engine, which reads only final scores and cannot see a schedule, and the closing spread, which can.
The Exhibit
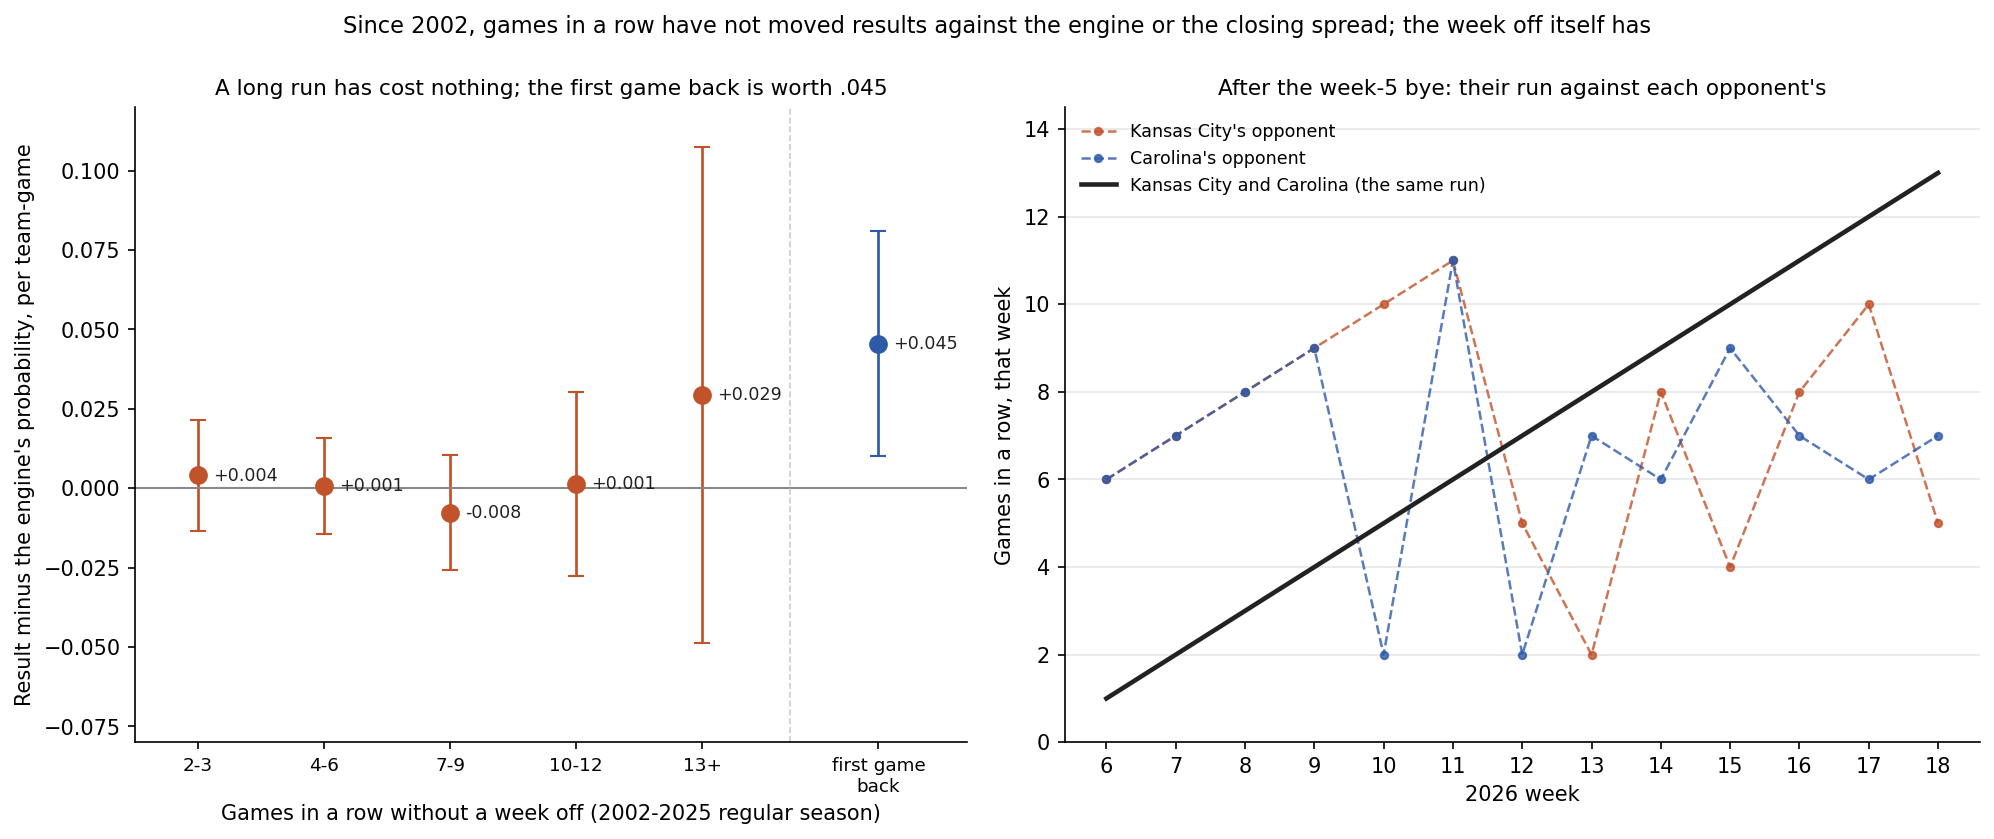
Games in a Row, 2002-2025
Count each team's games in a row, from week 1 or from the week after its bye, and set aside the first game back from a bye, which is a rest question, not a fatigue one. Then compare results with what each forecast said before kickoff.
| Games in a row | Team-games | Won | The engine | The closing line | Won minus engine | Standard error | Against the spread |
|---|---|---|---|---|---|---|---|
| 2-3 | 2,830 | .503 | .499 | .503 | +0.004 | 0.009 | +0.11 |
| 4-6 | 3,727 | .502 | .501 | .502 | +0.001 | 0.008 | -0.02 |
| 7-9 | 2,488 | .492 | .500 | .493 | -0.008 | 0.009 | -0.15 |
| 10-12 | 1,010 | .500 | .499 | .498 | +0.001 | 0.015 | +0.12 |
| 13 or more | 145 | .534 | .505 | .524 | +0.029 | 0.040 | +0.03 |
| First game back from the bye | 654 | .541 | .496 | .521 | +0.045 | 0.018 | +0.44 |
Regular-season team-games 2002-2025, each game counted from both sides; games in which either team was coming off its bye are left out of the run rows and shown in the last row, where only one side was. Week-1 games, in which both teams are on their first game, are left out. Buffalo's and Cincinnati's 2022 seasons, with the cancelled game, are left out. The closing line's probability is the fair-prices fit on the closing spread.
No run length stands out. Every group from two games to sixteen finishes within about one standard error of the engine's numbers and within a quarter of a point of the spread, and the 145 team-games on a thirteenth game or later came out slightly ahead of both. A team-game, though, has an opponent, and the opponent's run matters as much as the team's own. The cleaner test fits each game's result on the difference between the two teams' runs. Across 5,481 games with no team coming off a bye, the difference runs from -11 to +10 games, and each game of it moved results by -.001 against the engine (standard error .002) and -0.01 points against the closing spread (standard error 0.07). In the 421 games in which one team was six or more games deeper into its run, that team won .502 against .491 from the engine and .486 from the line.
The back end of the season gives the same answer. From week 13 on, the 166 early-bye team-seasons played 842 team-games with an average run of 10.71 games, against 6.56 for everyone else. They won .504 against .504 from the engine; measured against the other teams, the difference is -.0008 with a standard error of .018 (clustered by team-season), and against the spread -0.08 points with a standard error of 0.52. The 958 December team-games played on a run of ten or more finished +.008 above the engine and +0.01 points against the spread.
Where the Bye Does Show Up
The first game back is different. In the 654 games since 2002 in which exactly one team was coming off its bye, that team won .541. The engine, which has no input for rest, gave it .496, so the rested side beat the engine's numbers by .045, 2.5 standard errors. The closing line gave it .521: the market charges for the week off, and the results ran .020 above even that, 1.1 standard errors, and +0.44 points against the spread (standard error 0.49). Does Rest Matter in the NFL? measured the same edge on the scoreboard, about 1.8 points of expected margin for a home team off its bye; against the engine it is the one schedule effect in this file large enough to see.
Both bye teams collect it in week 6, on 14 days' rest against 7: Kansas City at home to the Chargers and Carolina at Philadelphia. The ledger's rows for those two games will come from ratings alone, as every row does, with no allowance for rest.
The Thirteen, Run Against Run
An early bye looks like a burden only if the opponents are fresh, and most of them will not be. The other 30 teams take their byes from week 6 to week 14, so in October and November Kansas City and Carolina are the rested side of the run comparison, and in December and January the deeper one. Kansas City's run is longer than its opponent's in 7 of its 13 games and Carolina's in 8. Summed over the thirteen, Kansas City's runs come to two games fewer than its opponents' and Carolina's to four more.
| Team | Weeks 6-18 | Longer run than the opponent | Summed run difference | Leaving out week 6 | Wins at the fitted rate | At the 95% bound |
|---|---|---|---|---|---|---|
| Kansas City | 13 games, runs 1-13 | 7 | -2 | +3 | -0.00 | -0.02 |
| Carolina | 13 games, runs 1-13 | 8 | +4 | +9 | -0.01 | -0.05 |
Leave out week 6, where the rest edge is theirs, and the summed differences are +3 for Kansas City and +9 for Carolina. At the fitted rate that costs nothing to two decimals; at the harsher end of its 95% interval, -.006 a game per game of difference, it comes to -0.02 wins for Kansas City and -0.05 for Carolina over thirteen games. Whatever the week-5 bye costs, it is smaller than anything sixteen seasons of results can measure, and the schedule hands back part of it by letting both teams play fresh while their opponents are not.
What This Page Does Not Show
- Injuries and rosters. A long run could matter through injuries that pile up; the file records results, not rosters, and the market's spread already reflects whatever it knew about them.
- Byes chosen at random. The league sets the calendar. Early and late byes are not assigned by lottery, and nothing here controls for how they are placed.
- Thursday games. A Thursday game after a Sunday is a short week inside a run; the run count treats every week the same, and the rest page covers short weeks.
- Independent games. The run-length rows count each game from both sides, so their standard errors are a little narrow; the game-level fit counts each game once.
- This weekend. Kansas City and Carolina do not play; no result from October 11 or 12 is used or named.
- Advice. The page compares forecasts with results. It recommends no wager and links to no sportsbook.
Method and Sources
bye            = the one regular-season week a team does not appear in the file           # 766 team-seasons, 2002-2025
games in a row = week, or week minus the bye week once past it                              # 1 to 16
engine         = walk-forward Elo with a 48-point home edge, replayed from 1999             # the ledger's model, no rest input
line's chance  = 1 / (1 + exp(-(-0.0265 + 0.14262 x home closing spread)))                 # the fair-prices fit
fit            = result minus forecast on (own run - opponent's run), each game once        # 5,481 games, post-bye games out
The script make_early_bye_chart.py reads every team-season's bye off the schedule, replays the engine over 1999-2026, counts each team's games in a row before every regular-season game since 2002, grades the engine and the closing line by run length, for the first game back from a bye, by the run difference and for early-bye teams in December, reads Kansas City's and Carolina's 2026 calendars, and asserts every number on this page.
Sources: the nflverse public game log (games.csv), 1999-2025 from the copy bundled in June, checked identical to a pull at 08:54 ET on October 10, 2026, which also supplies the 2026 schedule, results and rest days; the site's prediction ledger after the October 9 build.
Further reading
- Four of Seven New Coaches Are 3-1. Does It Last?: today's companion, the seven new head coaches after four games
- Does Rest Matter in the NFL? What 27 Seasons of Schedules Show: what a rest gap is worth on the scoreboard
- Reading the 2026 Schedule: Rest Edges, Short Weeks, and Who the Calendar Actually Favors: the bye map and every rest edge of the season
- The Week 10 Problem That Isn't: the peak bye week, and a pattern that did not survive testing
- Kansas City Is 17th: What 2025 Did to the Chiefs' Rating: where Kansas City's August rating came from
- The Kansas City and Carolina team pages, and the prediction ledger
Go deeper
Want the code behind these metrics? Work through the 43-chapter NFL analytics tutorial.
Browse tutorials Free tools