Seven New Sidelines, Four Games Later
Seven teams started 2026 under a different head coach from the one who finished 2025: Baltimore, Cleveland, Las Vegas, Miami, the Giants, Pittsburgh and Tennessee. On September 9 Seven New Sidelines priced them off the August board and found, over sixteen seasons, that the site's engine, which reads only final scores, needs no coaching input. Four games in, Baltimore, Cleveland, Las Vegas and the Giants are 3-1, Pittsburgh is 2-2, and Miami and Tennessee are 0-4. Together the seven are 14-14, after winning 40 games among them in 2025.
Every forecast this site keeps had them lower. Summed over their 28 team-games, the August board expected 12.73 wins, the engine's pre-game numbers 12.55 and the closing line 11.74, so the seven are 1.45 wins ahead of the engine and 2.26 ahead of the line. Against the spread they covered 16 of the 27 games that were not pushes, by +0.64 points a team-game. The other 25 teams went 51-51, 1.45 wins behind the engine, which is the same number seen from the other side.
All seven play this weekend. This page was written before any of those games and counts only the first four.
The Exhibit
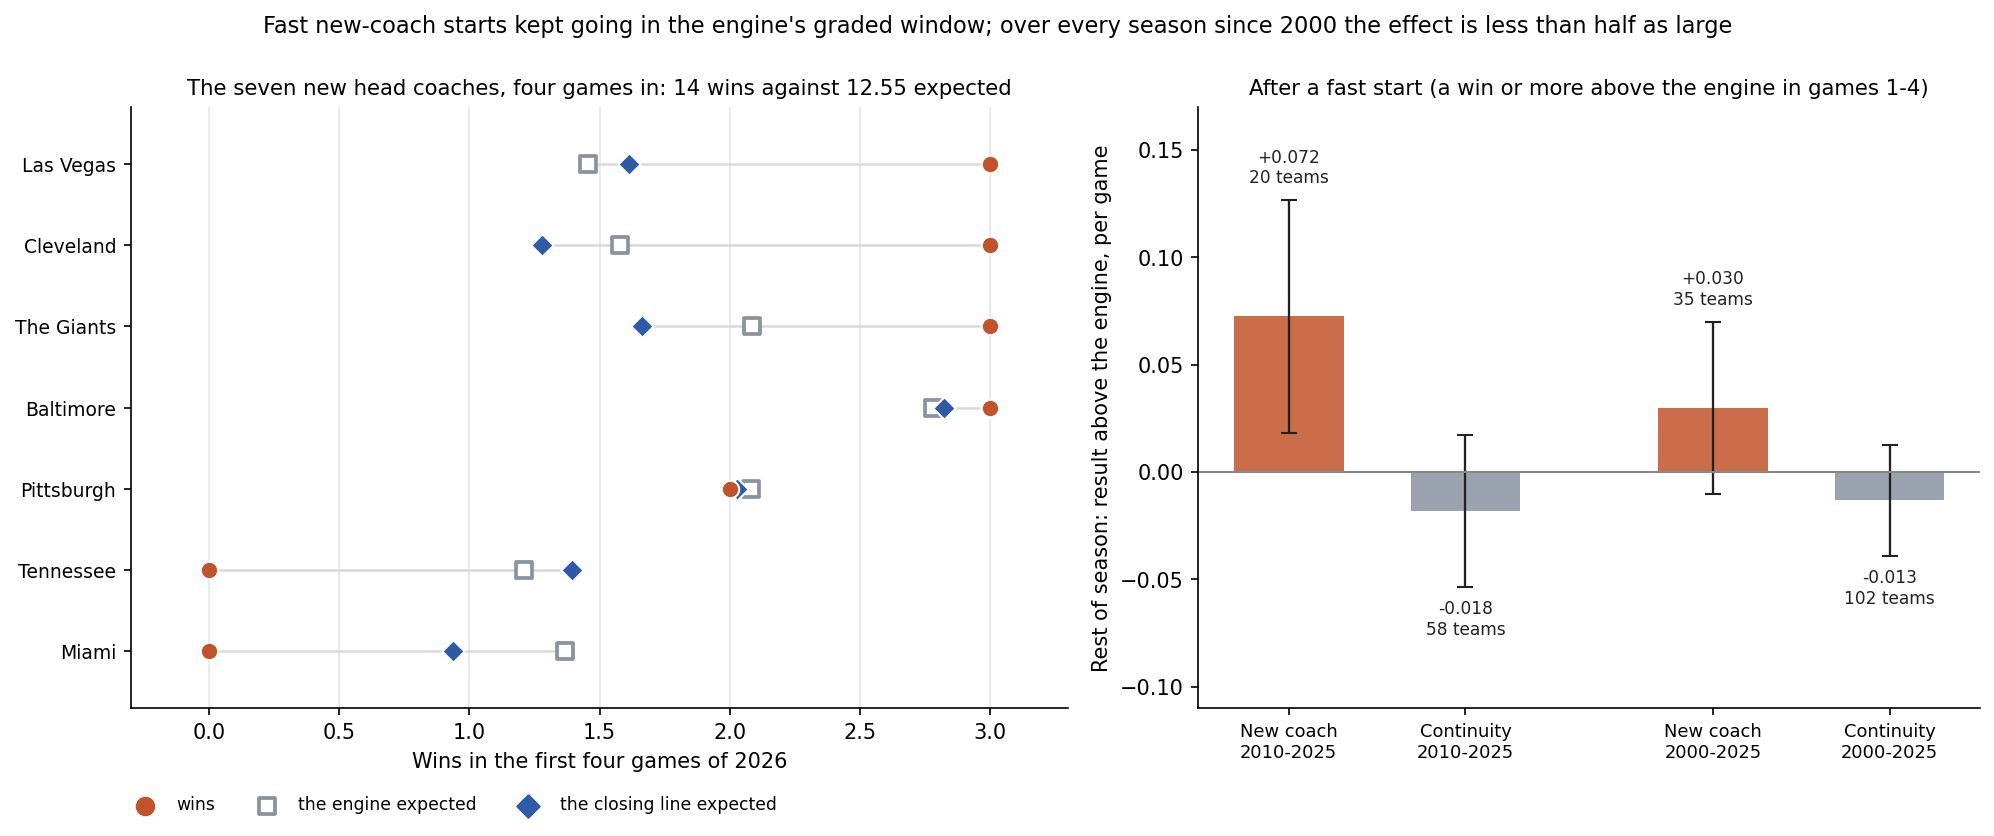
The Seven, Game by Game
| Team | Record | Points | August board | Engine | Closing line | Against the spread | Rank, August / now |
|---|---|---|---|---|---|---|---|
| Baltimore | 3-1 | +20 | 2.71 | 2.78 | 2.82 | -1.50 | 12 / 11 |
| Cleveland | 3-1 | -14 | 1.58 | 1.58 | 1.28 | +2.00 | 27 / 22 |
| Las Vegas | 3-1 | +31 | 1.29 | 1.45 | 1.61 | +10.62 | 31 / 26 |
| Miami | 0-4 | -55 | 1.69 | 1.37 | 0.94 | -4.88 | 23 / 29 |
| The Giants | 3-1 | +3 | 1.97 | 2.08 | 1.66 | +3.12 | 28 / 20 |
| Pittsburgh | 2-2 | -10 | 2.15 | 2.08 | 2.03 | -2.75 | 16 / 15 |
| Tennessee | 0-4 | -28 | 1.34 | 1.21 | 1.40 | -2.12 | 32 / 32 |
August board, engine and closing line are expected wins over the four games. The engine's numbers are its pre-game probabilities, replayed walk-forward; they match the ledger's frozen rows to the fourth decimal in the 26 team-games that have one (Pittsburgh at Cleveland on October 1 has no row). Against the spread is the average margin over the closing spread per game. Ranks are on the engine's board, August and after the October 9 build.
The four 3-1 starts are not alike. Las Vegas covered all four games, by +10.62 points a game, and its point differential, +31, is the best of the seven. Baltimore was the favourite in all four and lost the one to New Orleans, and its record sits almost exactly where the engine put it. Cleveland is 3-1 with a point differential of -14: it lost 34-10 at Jacksonville and won the next three by four, three and three. The Giants are 3-1 at +3, with a 28-6 loss at the Rams. The engine has moved the Giants from 28th to 20th, Cleveland from 27th to 22nd and Las Vegas from 31st to 26th; Miami has fallen from 23rd to 29th.
Before a game was played, a start like this was unlikely. On the August board the seven's chances of being 3-1 or better after four games ran from .614 for Baltimore down to .099 for Las Vegas and .100 for Tennessee, and summed to 1.82 teams. The seven played each other four times (Las Vegas and Miami, Tennessee at the Giants, Tennessee at Baltimore, Pittsburgh at Cleveland), so the count is worked out exactly over those four results: four or more 3-1 starts had a .047 chance. Since 2000, 47 of 191 new-coach teams started 3-1 or better, .246, against .368 for teams that kept their coach; new-coach teams are usually teams coming off bad seasons, which is the September page's point.
Does a New Coach's Fast Start Last?
The engine treats a fast start the same way whoever is coaching: it moves the rating by the margin of each result and nothing more. If a new coach's first month carries information a scores-only rating misses, such as a scheme that works, then new-coach teams that beat the engine early should keep beating it. If it is noise, they should not, and neither should anyone else.
The test uses the engine's graded window, 2010-2025, the window the September page used: 512 team-seasons with a previous season on file, 118 of them in a new coach's first year. For each, take the wins above the engine's numbers over the first four games, and the average result above the engine over the rest of the season.
| Team-seasons | Count | First four, wins above the engine | Rest of season, per game | Standard error | Rest of season, against the spread |
|---|---|---|---|---|---|
| New coach, 2010-2025 | 118 | -0.11 | +0.025 | 0.014 | -0.55 |
| ... beat the engine by a win or more in the first four | 20 | +1.34 | +0.072 | 0.028 | +0.61 |
| Continuity, 2010-2025 | 394 | +0.03 | -0.008 | 0.007 | +0.17 |
| ... beat the engine by a win or more in the first four | 58 | +1.37 | -0.018 | 0.018 | +0.11 |
| New coach, 2000-2025, beat the engine by a win or more | 35 | +1.44 | +0.030 | 0.021 | -0.10 |
| Continuity, 2000-2025, beat the engine by a win or more | 102 | +1.38 | -0.013 | 0.013 | +0.04 |
In the graded window the fast new-coach starts did keep going. The 20 new-coach teams that beat the engine by a win or more over their first four games beat it by .072 a game for the rest of the season, 2.6 standard errors, and beat the closing line's numbers by .046 a game; the 58 continuity teams with the same kind of start gave a little back, -.018. Across all 512 team-seasons the slope of the rest of the season on the first four is -.0031 for continuity teams and .0232 steeper for new coaches, a difference of 1.5 standard errors (clustered by season).
Then the check that matters most. The same split over every season since 2000, 829 team-seasons and 35 fast new-coach starts, gives +.030 a game (1.5 standard errors) and -0.10 points a game against the spread, so the ten earlier seasons cut the graded window's figure by more than half and take the betting-line part with them. A lead found by splitting one window into fast and slow starts, on 20 teams, that shrinks when the window widens, is a lead and not a finding. It is reported here because the 2026 seven are exactly the case it describes, and flagged as such.
New-coach teams have one other pattern in the graded window: they ran .027 a game below the engine in their first four games and .025 above it for the rest of the season (1.8 standard errors). Seven New Sidelines measured the whole season at +1.17 points of probability, under one standard error; the split says the small edge, if it is real, arrives after September.
What It Would Mean for the Seven
Take the slope over every season since 2000, +.0075 of rest-of-season result per win above the engine in the first four, as the estimate that has not been fitted to a subgroup. Las Vegas is 1.55 wins above the engine, Cleveland 1.42 and the Giants 0.92; Miami is 1.37 below and Tennessee 1.21 below. At that slope the adjustments are about one point of probability a game: +.012 for Las Vegas, +.011 for Cleveland, +.007 for the Giants, -.010 for Miami and -.009 for Tennessee. Over the 13 games each team has left that is about 0.15 of a win at most.
At the graded window's fast-start figure the picture would be different: .072 a game is close to one more win over the rest of a season. That is the size of what is at stake in the lead, and the reason to watch Las Vegas, Cleveland and the Giants against the ledger's frozen rows from here. The ledger will not adjust: its rows are frozen when they are written and graded as they stand, so the rest of 2026 will add seven team-seasons to the test either way.
What This Page Does Not Show
- The coaches themselves. A head coach is a blunt variable, as the September page said: the file names him, not his staff, his quarterback or his roster moves. The page names no coach and no player.
- A causal effect. Coaching changes follow bad seasons and arrive with other changes. Every comparison here is an association.
- Independent teams. The seven played each other four times, so their 28 team-games are 24 games, and every one of those four meetings counted one win and one loss inside the group.
- A settled subgroup. The fast-start split was chosen after looking at the graded window, and it weakens over the longer one.
- The 2000-2009 seasons as graded seasons. The engine's backtest starts grading in 2010; the earlier seasons are its burn-in, used here only as the robustness check.
- This weekend. No result from October 11 or 12 is used or named.
- Advice. The page compares forecasts with results. It recommends no wager and links to no sportsbook.
Method and Sources
new coach      = the season's primary head coach (most games) differs from the previous season's   # the September rule
engine         = walk-forward Elo with a 48-point home edge, replayed from 1999                     # the ledger's model
line's chance  = 1 / (1 + exp(-(-0.0265 + 0.14262 x home closing spread)))                         # the fair-prices fit
first four     = sum over games 1-4 of (result - engine probability)                               # wins above the engine
rest of season = mean over games 5+ of (result - engine probability)                               # per game
3-1 chance     = August ratings, exact over the 16 outcomes of the four meetings                    # .047
The script make_new_coaches_four_games_chart.py classifies every team-season's head coach with the September page's rule, replays the engine over 1999-2026, checks the replay against the ledger's frozen rows, works out the August chance of four or more 3-1 starts exactly and checks it by simulation, fits the persistence regressions with standard errors clustered by season, and asserts every number on this page.
Sources: the nflverse public game log (games.csv, with its head-coach fields), 1999-2025 from the copy bundled in June, checked identical to a pull at 08:54 ET on October 10, 2026, which also supplies the 2026 results and closing lines; the site's prediction ledger after the October 9 build.
Further reading
- Seven New Sidelines, and a Model That Cannot See Them: the September page this one follows up
- Thirteen Straight: Does an Early Bye Wear a Team Down?: today's companion, on Kansas City's and Carolina's calendar
- 0-4 and Still 14th: Is the Board Too Slow?: how fast the engine should learn from four games
- The Coach Ledger: three coaching bets read game by game
- What a 60% Pick Is Worth: The 2026 Openers at Fair Prices: the fit that turns a spread into a probability
- The Las Vegas, Cleveland, Giants, Baltimore, Pittsburgh, Miami and Tennessee team pages, and the prediction ledger
Go deeper
Want the code behind these metrics? Work through the 43-chapter NFL analytics tutorial.
Browse tutorials Free tools