Five Games In
Week 5 ended with Buffalo's 37-34 win at the Rams on Monday night, so every team has now played five games except two: Kansas City and Carolina, who have had their bye, have played four. In the AFC, Buffalo, Baltimore and Jacksonville are 4-1, Kansas City is 4-0, and those four lead their divisions. In the NFC the Giants lead at 3-1-1, Minnesota and San Francisco are 5-0, and Carolina leads at 2-2. The standings data behind the tables below come from the nflverse game log, and the morning build's check matched ESPN's for all 32 teams.
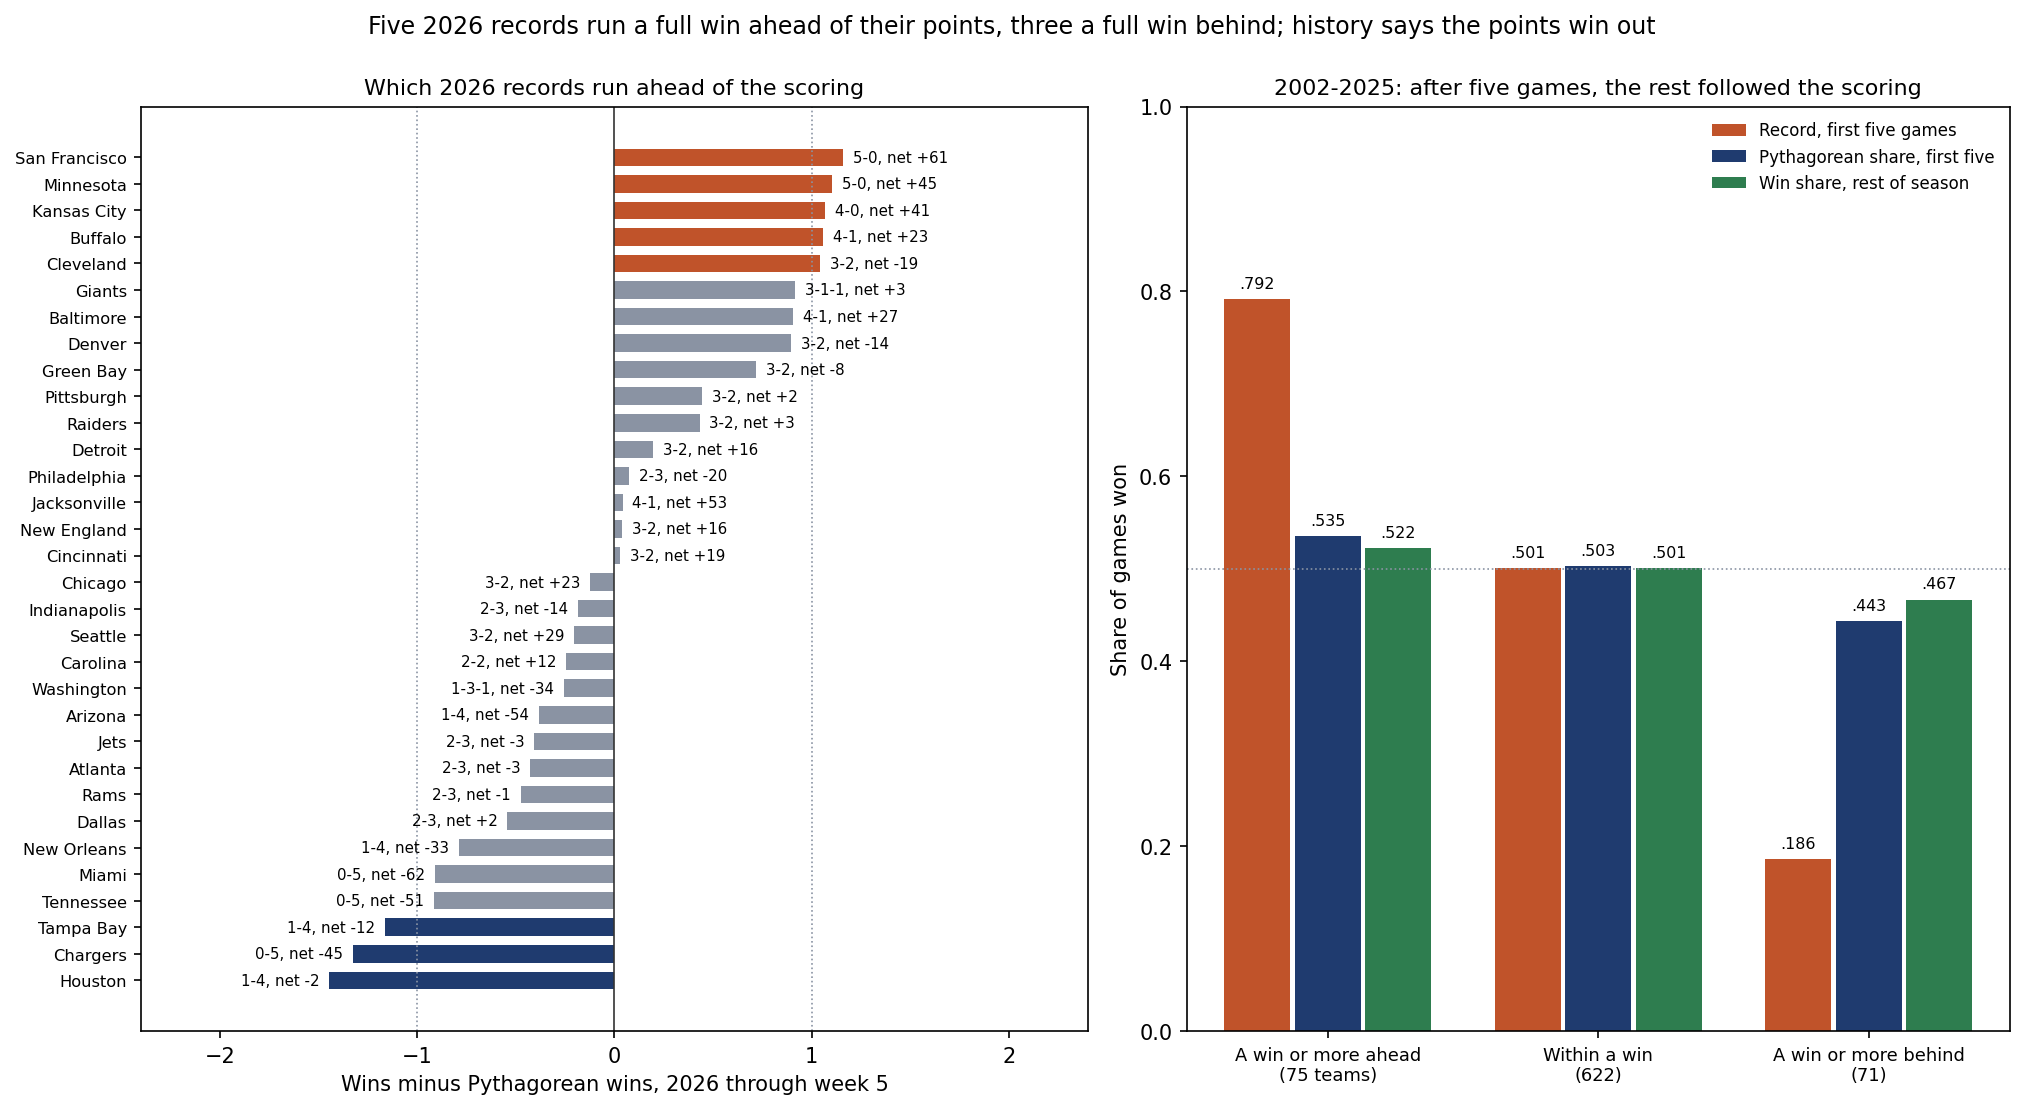
A record says who won. Points for and against say by how much, and over a season the margin is the steadier of the two. Set beside its scoring, five records run a full win or more ahead of what the points would predict: San Francisco, Minnesota, Kansas City, Buffalo and Cleveland. Three run a full win or more behind: Houston, the Chargers and Tampa Bay. Since 2002, teams in that position after five games have gone on to play like their points, not like their records.
The Exhibit
AFC Standings After Week 5
| Team | W-L-T | PF | PA | Net | Pyth. wins | Gap | One-score | Board |
|---|---|---|---|---|---|---|---|---|
| AFC East | ||||||||
| Buffalo | 4-1 | 164 | 141 | +23 | 2.94 | +1.06 | 3-1 | 2 |
| New England | 3-2 | 110 | 94 | +16 | 2.96 | +0.04 | 1-1 | 6 |
| The Jets | 2-3 | 93 | 96 | -3 | 2.41 | -0.41 | 1-2 | 29 |
| Miami | 0-5 | 70 | 132 | -62 | 0.91 | -0.91 | 0-2 | 30 |
| AFC North | ||||||||
| Baltimore | 4-1 | 146 | 119 | +27 | 3.09 | +0.91 | 3-1 | 9 |
| Cincinnati | 3-2 | 128 | 109 | +19 | 2.97 | +0.03 | 2-2 | 17 |
| Pittsburgh | 3-2 | 111 | 109 | +2 | 2.55 | +0.45 | 2-1 | 16 |
| Cleveland | 3-2 | 93 | 112 | -19 | 1.96 | +1.04 | 3-1 | 24 |
| AFC South | ||||||||
| Jacksonville | 4-1 | 123 | 70 | +53 | 3.96 | +0.04 | 2-1 | 5 |
| Indianapolis | 2-3 | 124 | 138 | -14 | 2.18 | -0.18 | 1-1 | 19 |
| Houston | 1-4 | 110 | 112 | -2 | 2.45 | -1.45 | 0-3 | 14 |
| Tennessee | 0-5 | 58 | 109 | -51 | 0.92 | -0.92 | 0-3 | 32 |
| AFC West | ||||||||
| Kansas City | 4-0 | 118 | 77 | +41 | 2.93 | +1.07 | 2-0 | 10 |
| The Raiders | 3-2 | 132 | 129 | +3 | 2.57 | +0.43 | 1-1 | 26 |
| Denver | 3-2 | 97 | 111 | -14 | 2.10 | +0.90 | 3-0 | 7 |
| The Chargers | 0-5 | 84 | 129 | -45 | 1.33 | -1.33 | 0-3 | 25 |
NFC Standings After Week 5
| Team | W-L-T | PF | PA | Net | Pyth. wins | Gap | One-score | Board |
|---|---|---|---|---|---|---|---|---|
| NFC East | ||||||||
| The Giants | 3-1-1 | 109 | 106 | +3 | 2.58 | +0.92 | 2-0-1 | 20 |
| Dallas | 2-3 | 138 | 136 | +2 | 2.54 | -0.54 | 1-3 | 23 |
| Philadelphia | 2-3 | 92 | 112 | -20 | 1.93 | +0.07 | 2-2 | 13 |
| Washington | 1-3-1 | 115 | 149 | -34 | 1.76 | -0.26 | 1-1-1 | 27 |
| NFC North | ||||||||
| Minnesota | 5-0 | 109 | 64 | +45 | 3.90 | +1.10 | 3-0 | 4 |
| Chicago | 3-2 | 119 | 96 | +23 | 3.12 | -0.12 | 0-1 | 12 |
| Detroit | 3-2 | 164 | 148 | +16 | 2.80 | +0.20 | 2-1 | 11 |
| Green Bay | 3-2 | 104 | 112 | -8 | 2.28 | +0.72 | 2-0 | 15 |
| NFC South | ||||||||
| Carolina | 2-2 | 121 | 109 | +12 | 2.25 | -0.25 | 1-1 | 21 |
| Atlanta | 2-3 | 119 | 122 | -3 | 2.43 | -0.43 | 0-2 | 18 |
| Tampa Bay | 1-4 | 100 | 112 | -12 | 2.17 | -1.17 | 1-4 | 22 |
| New Orleans | 1-4 | 118 | 151 | -33 | 1.79 | -0.79 | 1-2 | 28 |
| NFC West | ||||||||
| San Francisco | 5-0 | 154 | 93 | +61 | 3.84 | +1.16 | 2-0 | 3 |
| Seattle | 3-2 | 134 | 105 | +29 | 3.20 | -0.20 | 2-2 | 1 |
| The Rams | 2-3 | 119 | 120 | -1 | 2.48 | -0.48 | 1-2 | 8 |
| Arizona | 1-4 | 108 | 162 | -54 | 1.38 | -0.38 | 0-1 | 31 |
Teams in each division are listed in the order of the standings page: win share, then net points, which is not the league's tiebreaking procedure. A tie counts half a win. Pyth. wins: Pythagorean wins over the games played, exponent 2.37. Gap: wins minus Pythagorean wins. One-score: record in games decided by eight points or fewer. Board: place on the site's Elo board after week 5, the order the power rankings use.
How the Pythagorean Count Works
The Pythagorean page sets out the formula: a team's expected share of wins is its points for raised to a power, divided by the same plus its points against raised to that power, with the NFL's usual exponent of 2.37. Multiply the share by the games played and the result is the number of wins the scoring would predict.
Cleveland is the clearest case in the table. It has scored 93 points and allowed 112, a net of -19, and it is 3-2. Dividing both sides of the formula by Cleveland's points for makes the arithmetic short: 112 divided by 93 is 1.2043, and raised to the 2.37th power it is 1.5536, so the share is 1 / 2.5536 = .3916. Over five games that is 1.96 wins, against the three Cleveland has, a gap of +1.04. The extra win came from close games: Cleveland is 3-1 in games decided by eight points or fewer. Cleveland is 24th on the board, which reads margins and carries part of last season's rating forward.
Being ahead of the points is not the same as being lucky to be good. San Francisco and Minnesota, both 5-0, are a full win ahead of their scoring too, but their Pythagorean counts of 3.84 and 3.90 are second and third in the league. Jacksonville, 4-1 at +53, has the best; only Minnesota, 64, has allowed fewer points than Jacksonville's 70. San Francisco's +61 is the best net.
Five Games Since 2002
The test is simple. Take every team's first five regular-season games in every season from 2002 to 2025, 768 team-seasons, and compare what those games said with how the team did over the rest of its schedule. The record in the first five correlates .39 with the rest-of-season win share; the margin per game .44 and the Pythagorean share .45. Put record and margin in one regression and the margin does almost all the work: .083 of rest-of-season win share per standard deviation of margin, standard error .012, against .014 per standard deviation of record, standard error .012, which is not distinguishable from nothing. Used directly as a forecast of the rest of the season, the first-five record missed by .209 on average and the Pythagorean share by .167.
The teams whose records ran ahead show it most plainly. 75 teams finished their first five games a win or more above their Pythagorean count. They had won .792 of those games, their scoring said .535, and over the rest of the season they won .522. The 71 teams a win or more behind had won .186, their scoring said .443, and they won .467 the rest of the way. Both groups finished within about one standard error of what their points had said, and nowhere near their records.
The same split shows up inside a single record. Of the teams that started 3-2, the 170 with more points scored than allowed won .570 of their remaining games, and the 50 that had been outscored won .444. Of the 2-3 starts, the 51 that had outscored their opponents won .544, and the 142 that had not won .423. The record is the same; the points separate them. The close-game page found the season-to-season version of this: a close-game record does not carry over, while margin does.
The 2026 Records to Read Carefully
Three of the ten 3-2 teams have been outscored, the group that has won .444 afterwards: Cleveland; Denver, which is 3-2 at -14 and 3-0 in one-score games; and Green Bay, 3-2 at -8. Denver is the one the board still rates highly, 7th on the board, because its rating carries part of last season's strength forward and moves only part of the way with each result. Green Bay's -8 includes the 31-7 win over Chicago in week 5.
At the other end, Houston is 1-4 with a net of -2: its scoring is that of a team near .500, and it is 0-3 in one-score games. The board has it 14th on the board, ahead of several teams with better records. Tampa Bay is 1-4 in one-score games, and its -12 says about two wins, not one. Even the Chargers, at -45, have scored like a team with a win or so rather than none.
Two other records stand out in the table without crossing the full-win line. Seattle, 3-2 at +29, is first on the board, and its points say a little more than three wins. Dallas, at +2, is the one 2-3 team that has outscored its opponents, the group that has won .544 afterwards.
What This Page Does Not Show
- Strength of schedule. Points for and against are not adjusted for the opponents. The board's ratings do adjust, which is one reason its order differs from the Pythagorean order.
- Tiebreakers. The tables list teams by win share and then net points, not by the league's tiebreaking procedure.
- How the points were scored. Late scores in decided games count the same as any others, and a five-game margin is a small sample.
- Rosters. The count reads final scores only, with no injuries or lineups, and the page names no player.
- Advice. The page measures records and forecasts. It recommends no wager and links to no sportsbook.
Method and Sources
Pythagorean share = PF^2.37 / (PF^2.37 + PA^2.37); Pythagorean wins = share x games played
gap               = wins (a tie counts half) - Pythagorean wins
one-score game    = final margin of 8 points or fewer
history           = each team's first 5 regular-season games, 2002-2025, against its remaining 11 (to 2020) or 12 games
groups            = gap of +1.0 or more, -1.0 or less, and in between
The script make_standings_after_week5_chart.py checks every 2026 record and point total against the standings data and every week-5 score against ESPN's scoreboard, computes the Pythagorean counts and the tables, runs the 2002-2025 comparison, draws the exhibit and asserts every number on this page.
Sources: the nflverse public game log and schedule (games.csv), 1999-2025 from the copy bundled in June, checked identical to a pull on October 13, 2026, and 2026 from that pull, weeks 1-5 complete; ESPN's public week-5 scoreboard, pulled October 13, as the second source for week 5's scores; the site's standings data and Elo board as built on the morning of October 13.
Further reading
- NFL Playoff Picture After Week 5: What Week 6 Can Move: today's companion, the same standings as playoff odds
- Pythagorean Wins: Why Point Differential Predicts the NFL: the formula and the year-to-year test
- One-Score Records Are Luck: The Year-After Test Close-Game Heroes Keep Failing: why close-game records do not carry over
- Week 5's Sunday Moved 208 Points of Playoff Odds: what Sunday's games did to the playoff race
- 2026 standings: the full table, rebuilt after every graded game
- Power rankings: the board after every graded game
Go deeper
Want the code behind these metrics? Work through the 43-chapter NFL analytics tutorial.
Browse tutorials Free tools