208 Points of Playoff Odds
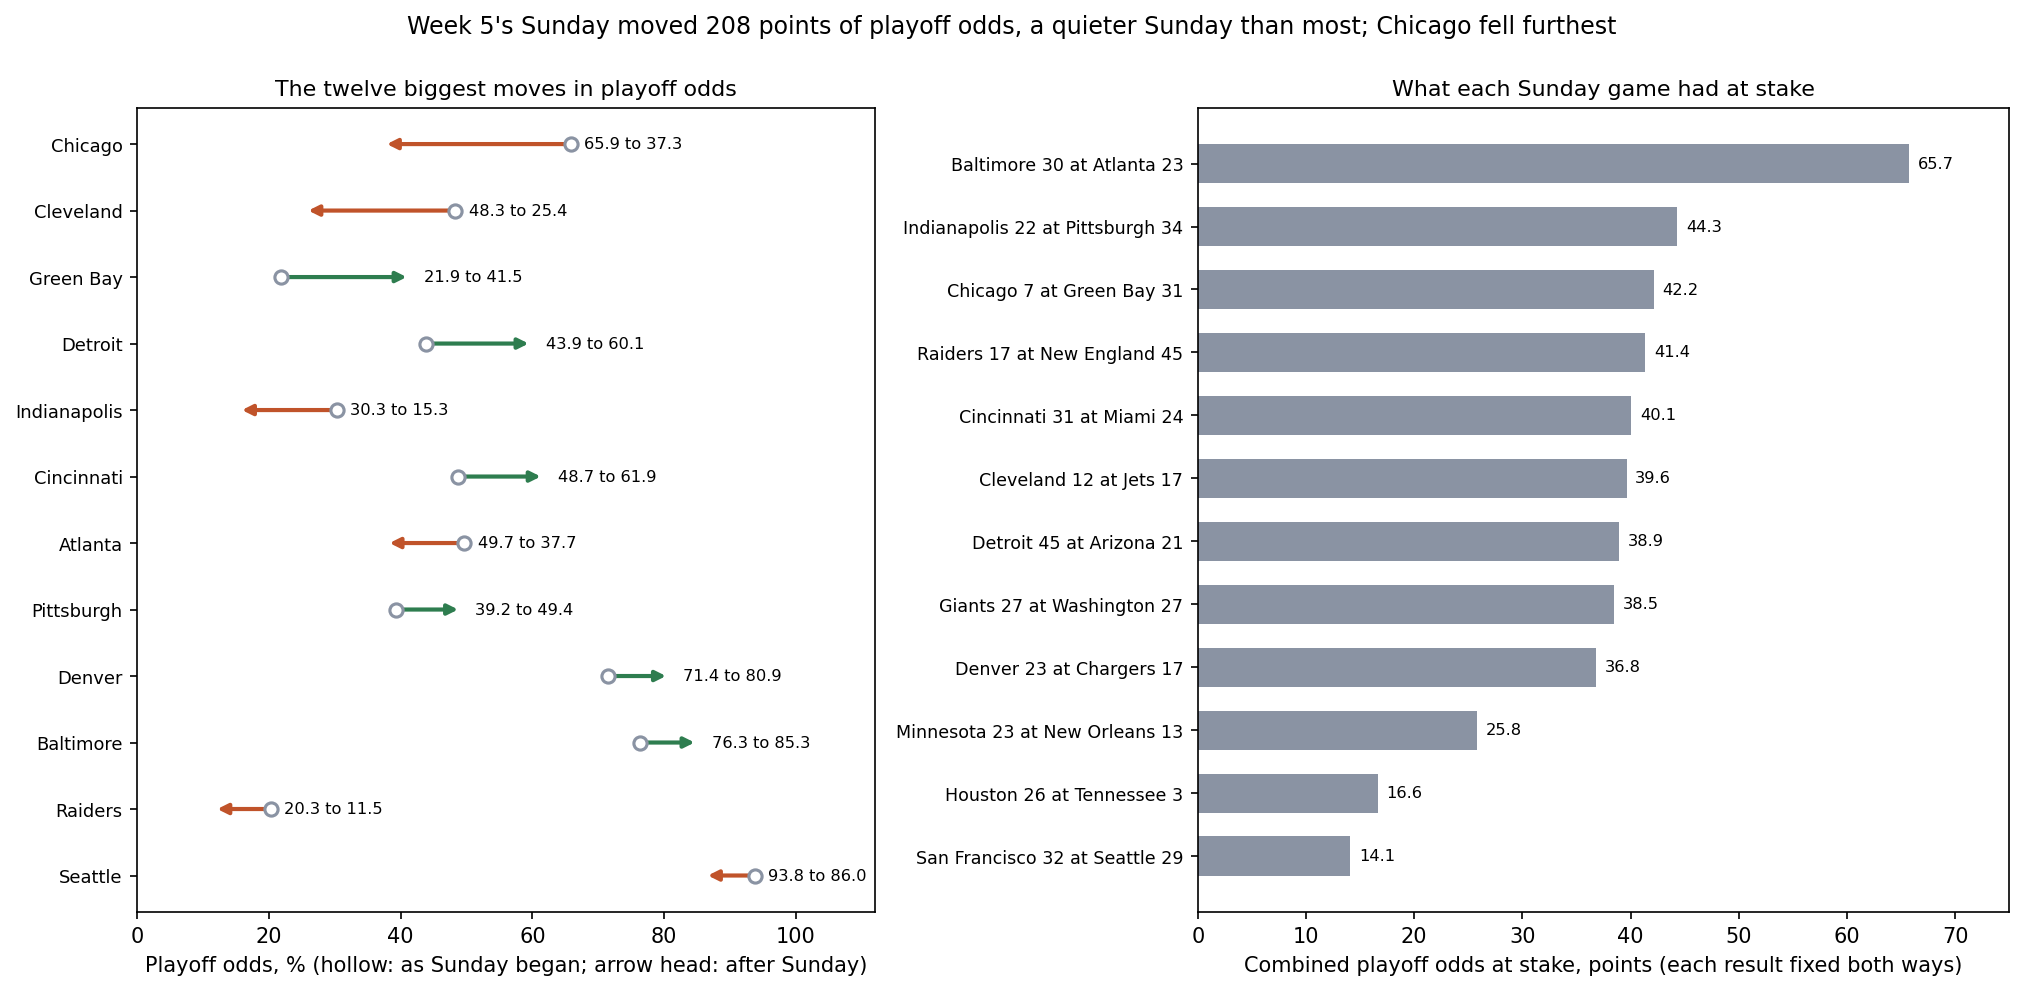
Twelve games on Sunday, October 11, moved the site's playoff odds by a combined 208.3 points: 104.1 points of playoff chances gained by some teams and the same 104.1 lost by others, since the field always seats fourteen. Chicago fell furthest, from 65.9% to 37.3% after a 31-7 loss at Green Bay, and Green Bay rose from 21.9% to 41.5%. Cleveland went from 48.3% to 25.4% and Detroit from 43.9% to 60.1%.
The numbers come from the site's plain 20,000-season simulation, run twice: once on the board as Sunday began, after Thursday's game in Dallas and the morning game in London, and once on the board this morning's build left after grading the twelve. Every played result is fixed, every unplayed game is drawn from the board with the usual 48-point home edge, and both runs use the same random numbers, so the difference between them is the games' doing and not the dice. Monday night's Buffalo at the Rams is an unplayed game in both runs, drawn like any other; this page was written before kickoff.
By the standard of week 5 it was a quiet Sunday. Measured per game, the twelve moved 17.4 points each, which ranks 19th of the 25 week-5 rounds since 2002.
The Exhibit
All 32 Teams
| Team | Playoffs, before | Playoffs, after | Change | Division, before | Division, after |
|---|---|---|---|---|---|
| San Francisco | 94.9 | 98.7 | +3.8 | 48.4 | 75.4 |
| Minnesota | 95.7 | 97.5 | +1.7 | 75.7 | 81.5 |
| Jacksonville | 97.0 | 96.9 | -0.1 | 91.9 | 93.8 |
| Buffalo | 92.1 | 89.9 | -2.2 | 70.7 | 63.6 |
| Kansas City | 89.9 | 88.5 | -1.4 | 66.2 | 58.4 |
| Seattle | 93.8 | 86.0 | -7.8 | 43.5 | 17.7 |
| Baltimore | 76.3 | 85.3 | +8.9 | 49.3 | 57.2 |
| Denver | 71.4 | 80.9 | +9.5 | 29.8 | 39.7 |
| New England | 72.8 | 78.6 | +5.8 | 29.1 | 36.0 |
| The Rams | 64.0 | 63.7 | -0.2 | 8.1 | 6.9 |
| Cincinnati | 48.7 | 61.9 | +13.2 | 19.0 | 22.6 |
| Detroit | 43.9 | 60.1 | +16.2 | 7.2 | 10.4 |
| Philadelphia | 53.2 | 53.6 | +0.3 | 48.4 | 49.0 |
| Pittsburgh | 39.2 | 49.4 | +10.1 | 12.9 | 14.5 |
| Green Bay | 21.9 | 41.5 | +19.6 | 2.3 | 4.5 |
| The Giants | 40.4 | 40.4 | 0.0 | 35.4 | 35.8 |
| Carolina | 32.0 | 37.9 | +5.8 | 30.0 | 36.9 |
| Atlanta | 49.7 | 37.7 | -12.0 | 47.8 | 36.6 |
| Chicago | 65.9 | 37.3 | -28.6 | 14.8 | 3.7 |
| Cleveland | 48.3 | 25.4 | -23.0 | 18.9 | 5.6 |
| Tampa Bay | 13.5 | 18.3 | +4.8 | 12.8 | 17.8 |
| Indianapolis | 30.3 | 15.3 | -15.0 | 6.4 | 3.3 |
| Houston | 11.0 | 14.3 | +3.4 | 1.7 | 2.9 |
| Dallas | 13.5 | 13.3 | -0.2 | 10.9 | 10.9 |
| The Raiders | 20.3 | 11.5 | -8.8 | 3.9 | 1.9 |
| New Orleans | 10.1 | 8.8 | -1.2 | 9.4 | 8.6 |
| Washington | 6.2 | 5.0 | -1.2 | 5.2 | 4.2 |
| The Jets | 0.9 | 1.8 | +1.0 | 0.1 | 0.3 |
| Arizona | 1.2 | 0.2 | -1.0 | 0.0 | 0.0 |
| The Chargers | 1.2 | 0.2 | -1.0 | 0.2 | 0.0 |
| Miami | 0.4 | 0.1 | -0.3 | 0.0 | 0.0 |
| Tennessee | 0.0 | 0.0 | 0.0 | 0.0 | 0.0 |
Percentages of 20,000 simulated seasons. Before: the board and results as Sunday began. After: the board and results after Sunday's twelve games. The change is worked from the unrounded odds. Buffalo's and the Rams' odds include tonight's game as an unplayed game. Ties in the standings are broken at random, a stated simplification; a tied game counts half a win to each side.
Results, Then Ratings
A result moves the odds twice: once because the win or loss is now in the standings, and again because it changes the two teams' ratings, which price every game they have left. Running the old board with the new results separates the two. The results alone move the odds by 120.9 points; adding the rating changes brings the total to 208.3.
Chicago shows the split most plainly. The loss by itself cost it 12.4 points of playoff odds. The rating change cost it about as much again: the 24-point margin at a rival's ground took 34.5 rating points from Chicago, the largest move of the day, and dropped it from 10th to 12th on the board, while Green Bay rose from 17th to 15th. Chicago had been favoured at Lambeau by both the market and the ledger for the first time since 2006, as Wednesday's preview noted.
Elsewhere the moves ran the way the results did. Baltimore's win at Atlanta took it from 76.3% to 85.3% and its division-title odds from 49.3% to 57.2%; Atlanta fell from 49.7% to 37.7%. Cincinnati went from 48.7% to 61.9%, Denver from 71.4% to 80.9%, and Indianapolis dropped from 30.3% to 15.3%. Tennessee, 0-5, sat at 0.0% before and after.
What Each Game Had at Stake
A different question is how much each game could have moved before it was played. Fixing each result both ways on the board as Sunday began, and adding up the change in all 32 teams' odds, gives a stake for every game. Baltimore at Atlanta had the most, 65.7 points: an Atlanta win was worth 18.1 points to Atlanta and a Baltimore win 14.8 to Baltimore. Indianapolis at Pittsburgh had 44.3 and Chicago at Green Bay 42.2. The twelve stakes add up to 444.0 points; what moved was less than half of that, because a stake is the distance between two possible results and each game produced only one of them.
The game with the least at stake for the playoffs, 14.1 points, was the one between the board's two best teams. San Francisco and Seattle were both above 93% to reach the field, so a result could not move either far. It moved the division instead: San Francisco won 32-29 at Seattle, its title odds went from 48.4% to 75.4% and Seattle's from 43.5% to 17.7%, with Seattle still first on the board and San Francisco now second. Houston at Tennessee, 16.6, was the other game with little to decide.
One division favourite changed hands, and its new leader did not play. Atlanta's loss took its NFC South title odds from 47.8% to 36.6%, and Carolina, on its bye, went from 30.0% to 36.9%, and from 32.0% to 37.9% to make the playoffs. The tie in Washington, 27-27, settled almost nothing: a Giants win had been worth 19.3 points to the Giants and a Washington win 6.7 to Washington, and after the tie the Giants sit at 40.4%, where they began, and Washington at 5.0%, down from 6.2%.
Week 5 Since 2002, and Whether the Moves Held
The same before-and-after simulation can be run around week 5 of every season from 2002 to 2025, with that season's schedule, its board as week 5 began and after it, and its playoff format: twelve teams to 2019, fourteen from 2020. Week 5 has moved the odds by 20.0 points a game on average, with a median of 20.1, from 15.0 in 2015 to 26.4 in 2008. Sunday's 17.4 sits in the lower third.
Whether the moves were the right size can be graded against who made the playoffs. Across the 768 team-seasons, the change from before week 5 to after it predicted what followed with a slope of 0.79, standard error 0.12: the season went on to move about four-fifths as far as week 5 had moved the odds, 1.7 standard errors short of the full distance. The moves still improved the forecast, taking the Brier score of the playoff odds from .1676 to .1594.
The shortfall sits on one side. The 88 teams whose odds fell 15 points or more in week 5 went from .559 to .347 and made the playoffs .352 of the time, almost exactly their new number. The 90 that rose 15 points or more went from .418 to .617 and made it .533 of the time, short of their new odds by 1.8 standard errors. Read against that history, Chicago's and Cleveland's falls are the kind that have held, and Green Bay's and Detroit's rises the kind that have given some of it back. The week-1 page found the moves after opening day about the right size, 0.93 of what followed, and the calibration page found the plain simulation too sure of itself at both ends; this page uses the plain simulation without that repair.
What This Page Does Not Show
- Monday night. Buffalo at the Rams is drawn from the board in every run on this page. No result of it is used or named, and Buffalo's and the Rams' odds will move once it is played.
- Uncertainty in the ratings. The plain simulation treats every rating as exact, which the calibration page measured as too sure of itself. The repaired version would pull the numbers near 0% and 100% toward the middle.
- Tiebreakers. Teams level on wins are separated at random, not by the league's tiebreaking rules.
- Rosters. The board reads final scores only, with no injuries or quarterbacks, and the page names no player.
- A causal split. The results-versus-ratings split depends on the order of the two steps. Applying the ratings first would divide the 208.3 points differently.
- Advice. The page measures forecasts. It recommends no wager and links to no sportsbook.
Method and Sources
simulation     = 20,000 seasons; unplayed games drawn at 1 / (1 + 10^(-(home - away + 48) / 400)), no edge at a neutral site
seats          = 4 division winners + 3 wild cards a conference (2 to 2019); ties in the standings broken at random
movement       = sum over the 32 teams of |odds after - odds before|, in percentage points
results only   = the old board with the new results fixed
stake          = sum over the 32 teams of |odds if the home team wins - odds if the away team wins|, the old board
moves held?    = slope of (made the playoffs - odds before) on (odds after - odds before), 768 team-seasons
The script make_week5_playoff_swings_chart.py replays the engine over 1999-2026 and checks its boards against the ledger's published ratings before and after Sunday, asserts that Monday night's game is unscored in every source and fixed in no run, runs the simulation before Sunday, after it and with the results alone, fixes each Sunday game both ways for its stake, repeats the before-and-after runs around week 5 of every season 2002-2025, grades those moves against the playoff fields in the file, and asserts every number on this page.
Sources: the nflverse public game log and schedule (games.csv), 1999-2025 from the copy bundled in June, checked identical to a pull on October 12, 2026, and 2026 from that pull; ESPN's public week-5 scoreboard, pulled October 12, as the second source for Sunday's scores; the site's prediction ledger and ratings as published on October 9 and October 12. No game result from Monday, October 12, is used.
Further reading
- Eight of Eleven and a Tie: Week 5's Sunday, Graded: today's companion, the same twelve games against the ledger and the market
- Playoff Odds After Week 1: Right Moves, Too Much Certainty: the same method after opening day
- Shrinking the Playoff Odds, Tested Out of Sample: the repair this page does not apply
- Three of the Top Six: The NFC West, Measured: the division San Francisco now leads
- 2026 Playoff Odds: the August table from the same simulation
- Power rankings: the board after every graded game
Go deeper
Want the code behind these metrics? Work through the 43-chapter NFL analytics tutorial.
Browse tutorials Free tools