The Picture After Week 5
Week 5 closed on Monday night with Buffalo's 37-34 win at the Rams, and that one game moved the site's playoff odds by a combined 40.8 points. Buffalo went from 89.9% to 95.7% to make the playoffs and from 63.6% to 74.7% to win the AFC East; the Rams went from 63.7% to 49.1%. New England's division-title odds fell from 36.0% to 25.1% without New England playing.
With every week-5 result in, the AFC's seven seats would go, by the odds, to Jacksonville 96.8%, Buffalo 95.7%, Kansas City 88.4%, Baltimore 84.8%, Denver 80.3%, New England 77.4% and Cincinnati 61.3%. Pittsburgh is eighth at 48.7% and Cleveland ninth at 24.8%. Jacksonville's 93.8% is the safest division title in the league.
The NFC is top-heavy and then crowded. San Francisco 98.9% and Minnesota 97.9% are close to certain, then come Seattle 87.9% and Detroit 63.2%, and then seven NFC teams between 35% and 55%: Philadelphia 54.3%, the Rams 49.1%, Green Bay 44.8%, the Giants 41.1%, Chicago 40.1%, Carolina 38.0% and Atlanta 37.8%. The AFC has one team in that band, Pittsburgh. Two NFC divisions are open: the South, with Carolina 36.9% and Atlanta 36.5% to win it, and the East, with Philadelphia 48.9% and the Giants 35.7%.
The numbers come from the site's plain 20,000-season simulation: every played result fixed, every unplayed game drawn from the board with the usual 48-point home edge (none at a neutral site), four division winners and three wild cards a conference. To price a week-6 game, the simulation is run with each result fixed both ways on the same random numbers, so the difference between the two runs is that game's doing.
The Exhibit
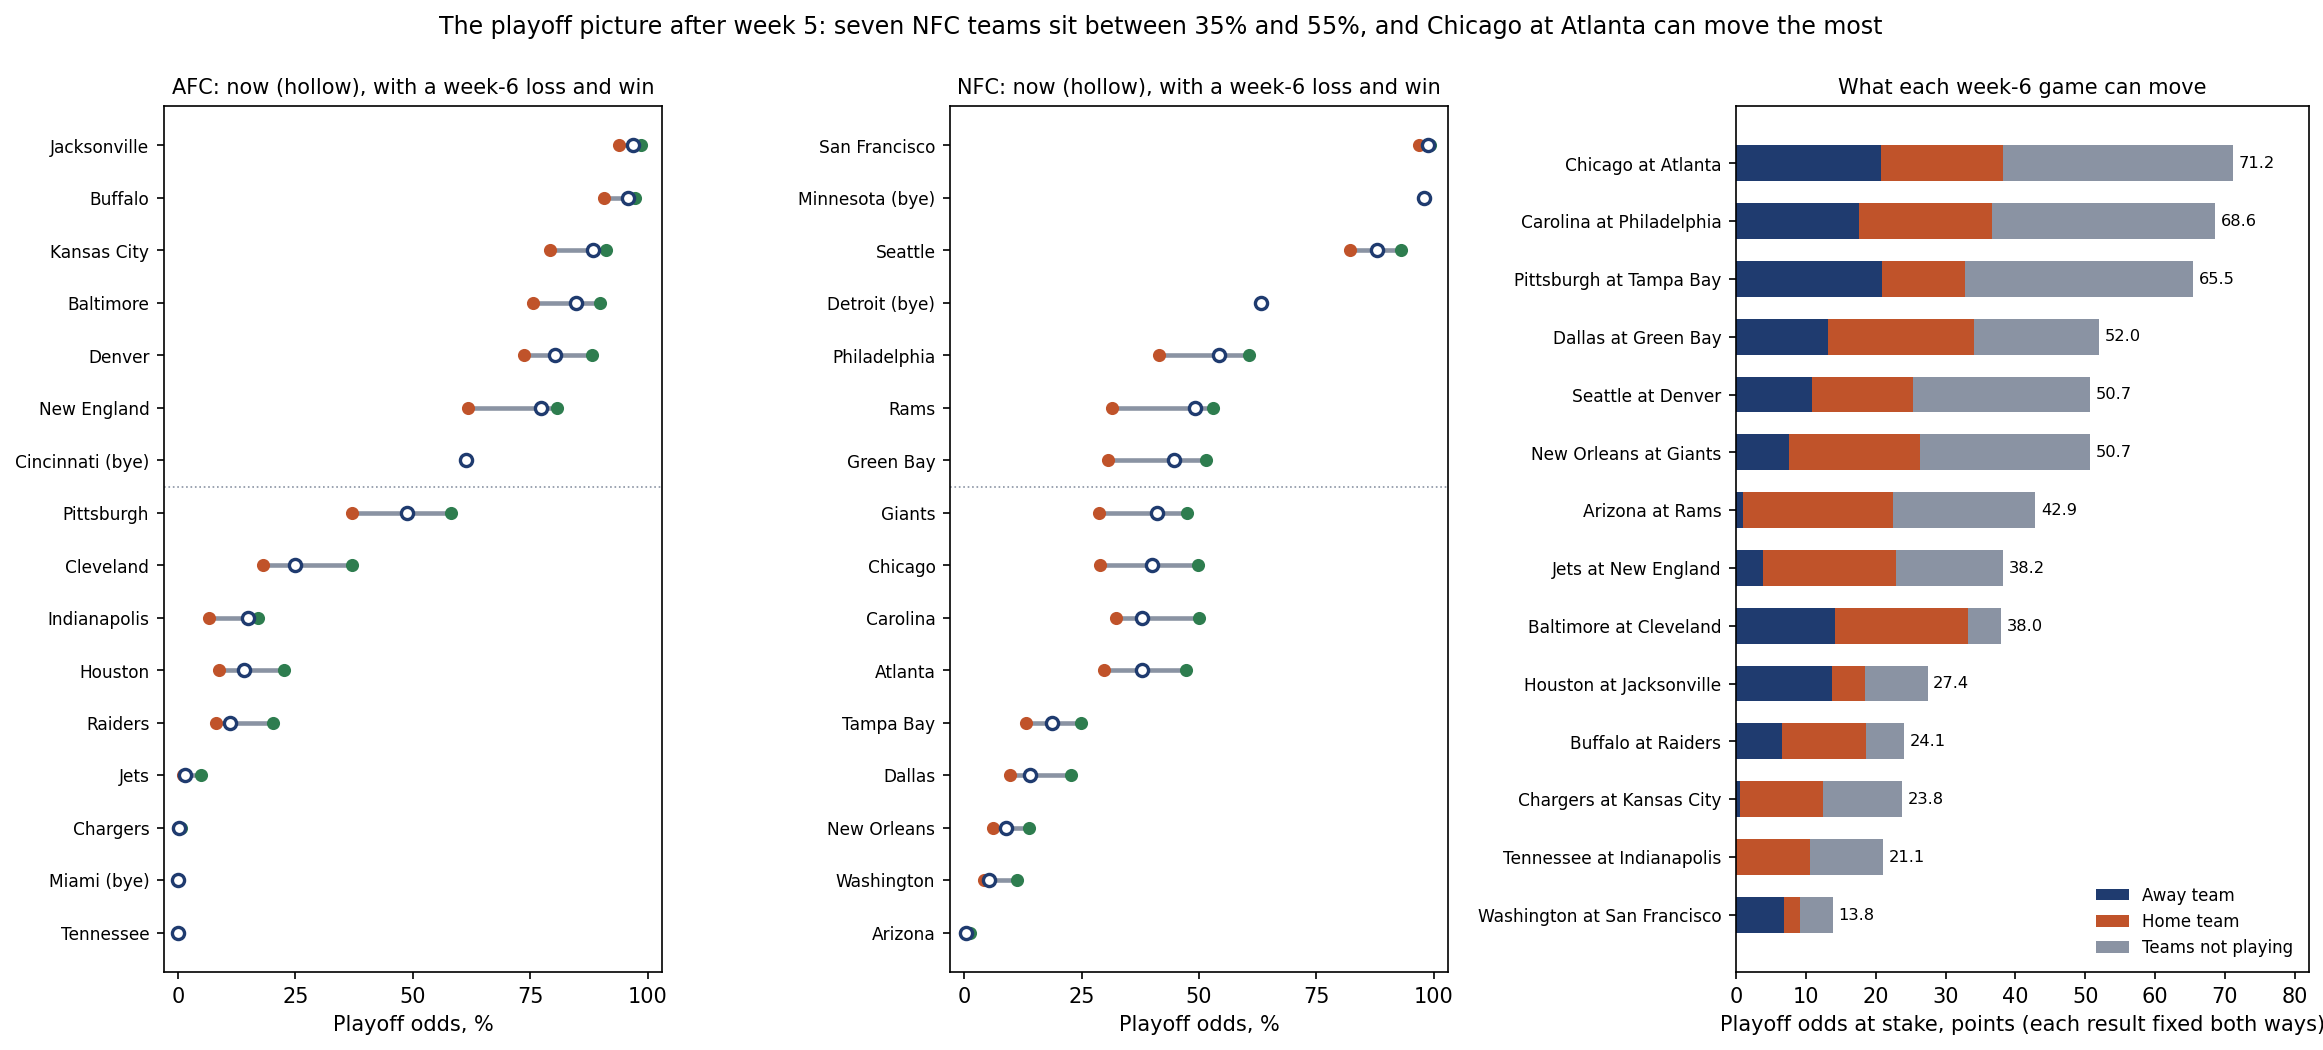
AFC Playoff Picture
| Team | Playoffs | Division | Week 6 | Playoffs with a win | With a loss |
|---|---|---|---|---|---|
| Jacksonville | 96.8 | 93.8 | v Houston (London) | 98.6 | 93.8 |
| Buffalo | 95.7 | 74.7 | at Raiders | 97.4 | 90.8 |
| Kansas City | 88.4 | 58.8 | v Chargers | 91.1 | 79.2 |
| Baltimore | 84.8 | 56.9 | at Cleveland | 89.8 | 75.6 |
| Denver | 80.3 | 39.3 | v Seattle | 88.1 | 73.6 |
| New England | 77.4 | 25.1 | v Jets | 80.7 | 61.6 |
| Cincinnati | 61.3 | 22.8 | bye | ||
| Pittsburgh | 48.7 | 14.6 | at Tampa Bay | 58.1 | 37.1 |
| Cleveland | 24.8 | 5.7 | v Baltimore | 37.0 | 18.1 |
| Indianapolis | 15.0 | 3.3 | v Tennessee | 17.1 | 6.6 |
| Houston | 14.0 | 2.9 | v Jacksonville (London) | 22.5 | 8.7 |
| The Raiders | 11.1 | 1.9 | v Buffalo | 20.1 | 8.2 |
| The Jets | 1.6 | 0.2 | at New England | 4.8 | 1.0 |
| The Chargers | 0.2 | 0.0 | at Kansas City | 0.7 | 0.1 |
| Miami | 0.1 | 0.0 | bye | ||
| Tennessee | 0.0 | 0.0 | at Indianapolis | 0.0 | 0.0 |
NFC Playoff Picture
| Team | Playoffs | Division | Week 6 | Playoffs with a win | With a loss |
|---|---|---|---|---|---|
| San Francisco | 98.9 | 78.0 | v Washington | 99.3 | 96.9 |
| Minnesota | 97.9 | 81.3 | bye | ||
| Seattle | 87.9 | 18.9 | at Denver | 93.0 | 82.2 |
| Detroit | 63.2 | 10.5 | bye | ||
| Philadelphia | 54.3 | 48.9 | v Carolina | 60.6 | 41.5 |
| The Rams | 49.1 | 3.1 | v Arizona | 52.9 | 31.5 |
| Green Bay | 44.8 | 4.5 | v Dallas | 51.5 | 30.6 |
| The Giants | 41.1 | 35.7 | v New Orleans | 47.5 | 28.8 |
| Chicago | 40.1 | 3.7 | at Atlanta | 49.7 | 28.9 |
| Carolina | 38.0 | 36.9 | at Philadelphia | 50.0 | 32.4 |
| Atlanta | 37.8 | 36.5 | v Chicago | 47.2 | 29.7 |
| Tampa Bay | 18.6 | 18.0 | v Pittsburgh | 24.9 | 13.1 |
| Dallas | 14.0 | 11.1 | at Green Bay | 22.9 | 9.7 |
| New Orleans | 8.8 | 8.6 | at Giants | 13.8 | 6.2 |
| Washington | 5.3 | 4.3 | at San Francisco | 11.2 | 4.3 |
| Arizona | 0.3 | 0.0 | at Rams | 1.2 | 0.2 |
Percentages of 20,000 simulated seasons, after week 5. Teams are listed by playoff odds, which is not a seeding: ties in the standings are broken at random, a stated simplification, and a tied game counts half a win to each side. With a win and with a loss: the team's playoff odds with its week-6 result fixed, everything else drawn. The full standings are on the standings page.
What Week 6 Can Move
Chicago at Atlanta has the most at stake, 71.2 points of playoff odds across the league. Chicago is 49.7% with a win and 28.9% with a loss; Atlanta is 47.2% and 29.7%. Both sit in the NFC's crowded middle, so 32.9 points of the swing land on teams not playing, the rivals for the same seats.
Carolina at Philadelphia is next at 68.6, and it carries 67.1 points of division-title odds, the most of the week, because it reaches into two open races at once, the NFC South and the NFC East. Pittsburgh at Tampa Bay, 65.5, is the biggest of the two interconference games: Pittsburgh, the AFC's eighth team, is 58.1% with a win and 37.1% with a loss.
The week opens on Thursday with Seattle at Denver, 50.7 points of playoff odds and 56.9 of division-title odds. The ledger's frozen row gives Denver 47.2% at home against the team at the top of the board. At the other end, Washington at San Francisco has the least at stake for the playoffs, 13.8, because San Francisco is near certain to get in and Washington near certain not to. It still carries 40.5 points of division-title odds, through San Francisco's lead over Seattle in the NFC West.
The fourteen stakes add up to 587.9 points. Each game will settle only one of its two results, and the ledger expects the favourites more often than not, so weighting each result by the ledger's own probability gives the movement week 6 should produce: 251.0 points, before the ratings move.
The Division Games Are Not the Big Ones
Week 6 has six division games, with 191.3 points of stake between them, and none of them ranks in the top six. In all six the ledger has a favourite at 62% or better, and in five the underdog is at 15% or less to make the playoffs. Arizona at the Rams, 42.9, is the largest, and almost all of it is the Rams': 21.4 points to the Rams and 1.1 to Arizona, with the Rams 52.9% with a win and 31.5% with a loss. Baltimore at Cleveland, 38.0, is the most even split, 19.0 points to Cleveland and 14.2 to Baltimore, but only 4.8 points of it reach teams not playing. Houston and Jacksonville meet in London on Sunday morning, a neutral site, so the ledger's 62.3% for Jacksonville carries no home edge.
The division-leverage page found a division win worth about 1.30 ordinary wins in the race, not two. The simulation here breaks ties in the standings at random, so it gives a division game no extra weight of its own; on this week's schedule the matchups decide the stakes. Four teams are on their bye: Cincinnati, Detroit, Miami and Minnesota.
How Settled Is a Field After Week 5?
The same simulation can be run after week 5 of every season from 2002 to 2025, with that season's schedule, board and playoff format, twelve teams to 2019 and fourteen from 2020. Ranking each conference by those odds and comparing with the real fields, 85 of the 300 playoff places went to teams outside the top seats after week 5, about three and a half a season; 19 of 84 since the field grew to fourteen. The count ran from one in 2007 to six in 2002 and 2008.
The ends of the table move too. The 232 teams below 10% after week 5 averaged 2.9%, and 22 of them made the playoffs, 9.5%. The 83 teams at 90% or more averaged 96.1%, and 74 made it, 89.2%. The plain simulation is too sure at both ends, as the calibration page found, and this page uses it without that repair. 2026 has seven teams below 10%: by that history, about one in ten such teams has still found a way in.
What This Page Does Not Show
- Week 6 itself. No week-6 game had been played when the inputs were frozen on the morning of Tuesday, October 13.
- Rating changes. The with-a-win and with-a-loss columns fix the result but hold the board where it is; the real ratings will move with the margin, as the week-5 page measured.
- Uncertainty in the ratings. The plain simulation treats every rating as exact, which is why its ends are too sure.
- Tiebreakers and seeds. Teams level on wins are separated at random, so the order here is not the league's seeding.
- Rosters. The board reads final scores only, with no injuries or lineups, and the page names no player.
- Advice. The page measures forecasts. It recommends no wager and links to no sportsbook.
Method and Sources
simulation     = 20,000 seasons; unplayed games drawn at 1 / (1 + 10^(-(home - away + 48) / 400)), no edge at a neutral site
seats          = 4 division winners + 3 wild cards a conference (2 to 2019); ties in the standings broken at random
stake          = sum over the 32 teams of |odds if the home team wins - odds if the away team wins|
expected move  = sum over the 32 teams of p x |odds if home wins - odds now| + (1 - p) x |odds if away wins - odds now|,
                 p = the ledger's frozen home-win probability
history        = the same simulation after week 5, 2002-2025, against the real playoff fields
The script make_week6_playoff_picture_chart.py replays the engine over 1999-2026 and checks its boards against the ledger's published ratings before and after Monday night, checks that the simulation's probability for every week-6 game equals the ledger's frozen row, runs the simulation after week 5 and with each week-6 game fixed both ways, repeats the after-week-5 run for every season 2002-2025, draws the exhibit and asserts every number on this page.
Sources: the nflverse public game log and schedule (games.csv), 1999-2025 from the copy bundled in June, checked identical to a pull on October 13, 2026, and 2026 from that pull; ESPN's public week-5 and week-6 scoreboards, pulled October 13, as the second source for week 5's scores and week 6's schedule; the site's prediction ledger and ratings as published on October 12 and October 13.
Further reading
- NFL Standings After Week 5: Records vs Point Differential: today's companion, the same standings read through the points
- Week 5's Sunday Moved 208 Points of Playoff Odds: what Sunday's games did to these odds
- Week 3's Leverage Board: What Each Result Moves: the same stake measure in week 3
- Shrinking the Playoff Odds, Tested Out of Sample: the repair this page does not apply
- Prediction ledger: the fourteen week-6 rows, frozen before kickoff
- Power rankings: the board after every graded game
Go deeper
Want the code behind these metrics? Work through the 43-chapter NFL analytics tutorial.
Browse tutorials Free tools