Eight Right, Three Wrong and a Tie
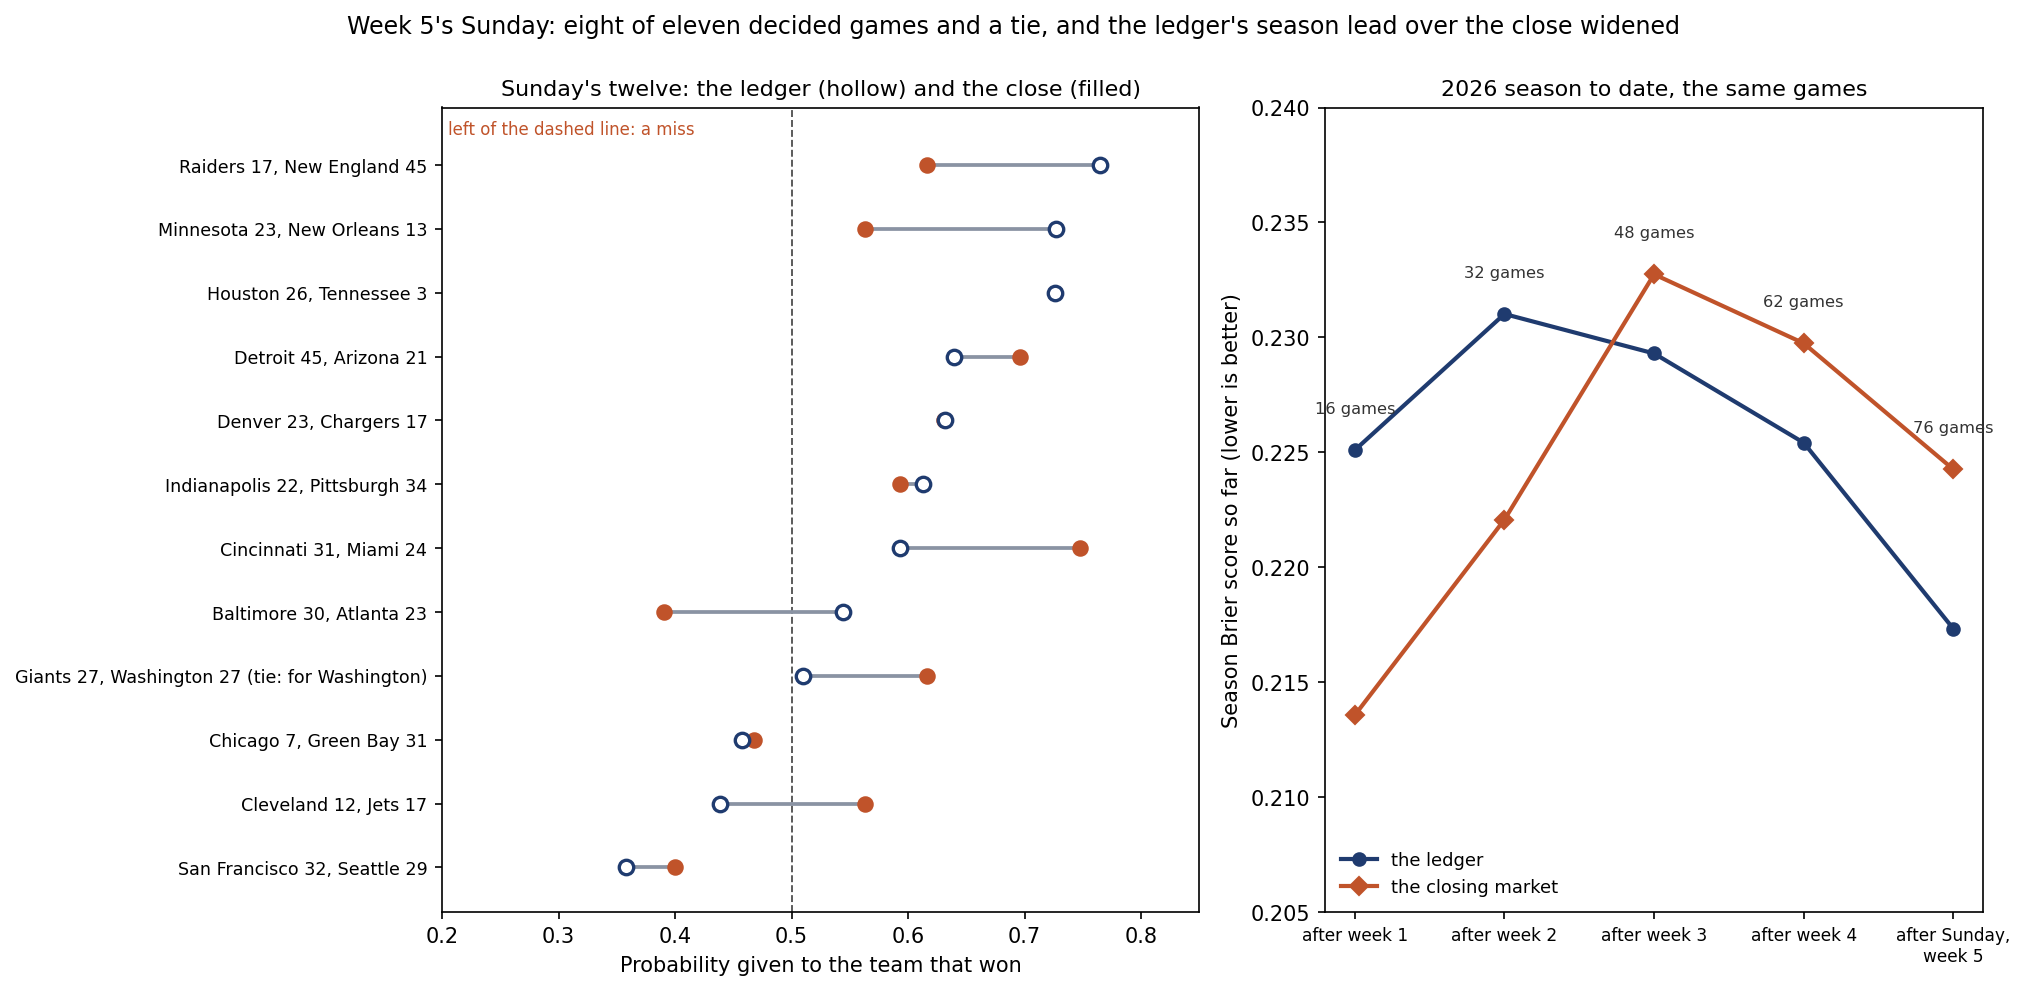
The prediction ledger froze a number for each of week 5's fifteen games on October 6. Twelve of them were played on Sunday afternoon and evening, October 11, and this morning's build graded all twelve: eight went the ledger's way, three went against it, and one, the Giants at Washington, ended 27-27. Across the twelve rows the Brier score is .1679, against the .2284 the ledger's own probabilities expected, so it was a better Sunday than the numbers themselves forecast.
The closing market had the same Sunday on the picks, eight right and three wrong of the eleven decided games, and a slightly worse score, .1741. The two parted on two games, which split one each. Through fourteen of week 5's fifteen games the ledger reads .1815 to the close's .2000, and its season lead over the close, first taken after week 3, is now .0069 of Brier score over 76 games.
One game is left: Buffalo at the Rams tonight. This page was written before kickoff and grades only the fourteen games already final.
The Exhibit
The Twelve
| Game | Final | The ledger | The close | Grade | Brier, ledger | Brier, close |
|---|---|---|---|---|---|---|
| Chicago at Green Bay | Chicago 7, Green Bay 31 | Chicago .5424 | Chicago .5325 | Wrong | .2942 | .2835 |
| Cincinnati at Miami | Cincinnati 31, Miami 24 | Cincinnati .5931 | Cincinnati .7478 | Right | .1656 | .0636 |
| Cleveland at the Jets | Cleveland 12, the Jets 17 | Cleveland .5611 | The Jets .5635 | Wrong | .3148 | .1905 |
| Houston at Tennessee | Houston 26, Tennessee 3 | Houston .7265 | Houston .7258 | Right | .0748 | .0752 |
| Indianapolis at Pittsburgh | Indianapolis 22, Pittsburgh 34 | Pittsburgh .6128 | Pittsburgh .5934 | Right | .1499 | .1653 |
| The Raiders at New England | The Raiders 17, New England 45 | New England .7644 | New England .6164 | Right | .0555 | .1471 |
| Minnesota at New Orleans | Minnesota 23, New Orleans 13 | Minnesota .7270 | Minnesota .5635 | Right | .0745 | .1905 |
| The Giants at Washington | The Giants 27, Washington 27 | Washington .5102 | Washington .6164 | Tie | .0001 | .0136 |
| Denver at the Chargers | Denver 23, the Chargers 17 | Denver .6320 | Denver .6309 | Right | .1354 | .1362 |
| Detroit at Arizona | Detroit 45, Arizona 21 | Detroit .6399 | Detroit .6958 | Right | .1297 | .0926 |
| San Francisco at Seattle | San Francisco 32, Seattle 29 | Seattle .6424 | Seattle .5996 | Wrong | .4127 | .3596 |
| Baltimore at Atlanta | Baltimore 30, Atlanta 23 | Baltimore .5440 | Atlanta .6092 | Right | .2079 | .3712 |
The ledger: the team its frozen October 6 row picked and the probability it gave that team. The close: the closing market's favourite and its vig-free probability, from the moneylines in the nflverse file. Both scores were checked against ESPN's scoreboard this morning. A tie scores as half a win for each side, so its Brier score is the squared distance of the home team's probability from .5.
Two of the three misses came from the ledger's three least certain picks among the decided games. The third, Seattle at .6424, was the costliest row of the day, San Francisco winning 32-29, and Cleveland at .5611 and Chicago at .5424 cost .3148 and .2942. Together the three carry .0851 of the Sunday's .1679. The surest picks all came in: New England at .7644 won 45-17, Minnesota at .7270 won 23-13 and Houston at .7265 won 26-3, and those three rows cost less than .08 each.
Eight of eleven was better than the ledger's own expectation without being remarkable. Its probabilities for the eleven decided games add up to 6.99 expected hits. The exact distribution of the count puts seven as the single most likely outcome, at 24.7%, eight at 21.3%, and eight or more at 38.3%.
Against the Market
On Thursday morning Where the Ledger and the Market Disagree set the frozen rows beside DraftKings' prices at 08:22 ET and sorted the week by how far apart the two were. It found the market nearer the results in seven of eight kinds of disagreement over sixteen seasons. Sunday ran the other way.
Thursday's board scored .1782 on Sunday's twelve games and the close .1741, both behind the ledger's .1679. Of the two games in which the ledger and the market picked different winners, the Jets beat Cleveland 17-12, the market's side, and Baltimore won 30-23 at Atlanta, the ledger's side. Of the six week-5 games in which Thursday's prices and the ledger were 10 or more points apart, the ledger's number was nearer the result in five, and over the six it scored .1523 to Thursday's .2369. The widest differences came from Thursday night's Tampa Bay at Dallas, graded on Friday, where the market's surer number for Dallas cost .216 more than the ledger's, then Baltimore at Atlanta and Minnesota at New Orleans, where the ledger's .7270 met a 23-13 win the market had priced at .5514.
One week of six games does not overturn 4,153. The history stays what Thursday's page said it was: over 2010-2025 the close scored .2104 to the engine's .2205, and in week 5 alone the engine beat the close in six of those sixteen seasons. Sunday was one of the weeks that go the engine's way.
The Tie
The Giants and Washington finished 27-27 after overtime. The ledger had Washington at .5102, about as close to a coin flip as a row gets, so its Brier score for the game is .0001, the best of the week. The close had Washington at .6164 and scores .0136. The ledger's scoreboard counts a tie as neither right nor wrong, which is why it now reads 48 right of 75 decided games out of 76 graded. In the engine a tie is half a win for each side, and because Washington's number was a hair above one half, the result moved Washington down 0.14 rating points and the Giants up by the same.
The game is the first tie of 2026 and the sixteenth regular-season tie in the file since 1999: fifteen came in the 6,967 regular-season games from 1999 to 2025, the last Green Bay 40, Dallas 40 on September 28, 2025. These two teams also played to one in 2022, 20-20 at the Giants. Ties have become more common in overtime games: 7 of 284 overtime games ended level from 1999 to 2016, 2.5%, and 8 of 131 since 2017, 6.1%. They have not been coin-flip games beforehand. In the fifteen earlier ties the engine's favourite had been given .675 on average, and never less than .5087.
The Season and the Budget
Through 76 graded rows the ledger is 48 right, 27 wrong and one tie, with a Brier score of .2173 against the .2202 its own probabilities expected. Over the 75 decided rows its numbers expected 48.57 hits, and 48 or more had a 60.7% chance, so the season is running almost exactly to its own forecast. Against the close the order changed after week 3 and has held: the ledger trailed .2251 to .2136 after week 1 and .2310 to .2221 after week 2, led .2293 to .2327 after week 3 and .2254 to .2297 after week 4, and now leads .2173 to .2243.
The miss budget opened at 99.11 expected misses for the season. The convention every grading note has used subtracts the graded rows' expected misses and adds the misses that happened; this page counts the tie as half a miss, the way a Brier score counts it as half a result. The graded rows expected 26.92 misses and produced 27.5, so the budget stands at 99.69, 0.58 above where it opened. It stood at 100.69 before Sunday, when twelve rows that expected 4.50 misses produced 3.5.
Does a Lead After Five Weeks Last?
The engine behind the ledger can be replayed over every season from 2010 to 2025 against the closing moneylines in the file, 4,174 regular-season games. It led the close through week 5 in four of those sixteen seasons, 2014, 2015, 2016 and 2017, and finished the regular season ahead in two of them, 2014 and 2015. All four of those leads were larger than 2026's: .0072, .0074, .0139 and .0090, against .0069 now.
So a lead of this size at this point has been a coin flip to last, and leads of any size have been rare. The week-3 grading note drew the same lesson from a smaller sample, and Thursday's page gave the pattern behind it: over 2010-2025 the market's edge over the engine was .0048 of Brier score in weeks 1 to 4 and .0097 in weeks 5 to 8. The stretch in which the engine has come closest is the one that has just ended.
What This Page Does Not Show
- Monday night. Buffalo at the Rams had not kicked off when this page was built, and its frozen row is ungraded. The week's fifteenth game is left out of every figure here.
- Why any game went the way it did. The engine reads final scores only, with no rosters, injuries or quarterbacks, and the page names no player.
- A verdict on the model. Twelve games carry little information about a forecaster. Sixteen seasons of the same comparison favour the market.
- Thursday's prices as closing prices. The 08:22 ET board was a snapshot, three days before kickoff. The closing moneylines are the ones the nflverse file carries.
- A settled rule for ties. The ledger's scoreboard leaves a tie out of its hit count; this page's budget counts it as half a miss. Counted as a full miss the budget would read 100.19, and counted as none 99.19.
- Advice. The page compares forecasts with results. It recommends no wager and links to no sportsbook.
Method and Sources
outcome        = 1 home win, 0 away win, .5 tie
Brier          = (frozen home probability - outcome)^2, averaged over rows
expected Brier = mean of p x (1 - p)                     # what the ledger's own numbers forecast
vig-free price = implied(home) / (implied(home) + implied(away))
miss budget    = 99.11 - sum of min(p, 1 - p) over graded rows + misses (a tie = .5)
lead           = close's season Brier - ledger's season Brier, the same games
The script make_week5_sunday_graded_chart.py reads the ledger before and after this morning's build, checks that no frozen number moved and that only results were attached, checks every week-5 score against ESPN's scoreboard, asserts that Monday night's game is unscored in every source, re-derives every grade and Brier score, works out the exact distribution of Sunday's hit count, grades Thursday's DraftKings board and the closing moneylines on the same games, replays the engine over 1999-2026 against the ledger's published ratings, sorts sixteen seasons of the engine against the close by their standing after week 5, lists every regular-season tie in the file, and asserts every number on this page.
Sources: the nflverse public game log (games.csv), 1999-2025 from the copy bundled in June, checked identical to a pull on October 12, 2026, and 2026 from that pull; ESPN's public week-5 scoreboard, pulled on October 8 for DraftKings' prices and on October 12 for the finals; the site's prediction ledger as published on October 9 and October 12. No game result from Monday, October 12, is used.
Further reading
- Week 5: Where the Ledger and the Market Disagree: the Thursday board this page grades
- Tampa Bay 24, Dallas 16: The Ledger Beat Every Price: week 5's Thursday game, graded
- Week 5: Chicago Favoured at Lambeau, a First Since 2006: the preview of one of Sunday's three misses
- Two 1-3 Teams Are Favoured Over 3-1 Teams on Sunday: Washington and the Jets, priced over better records
- Eleven of Sixteen: Week 3, Graded Against the Market: the last full-week grading note
- The 2026 miss budget: where 99.11 comes from
- The prediction ledger: every frozen row and its grade
Go deeper
Want the code behind these metrics? Work through the 43-chapter NFL analytics tutorial.
Browse tutorials Free tools