Five Games of Plays
Expected points added asks how much each snap changed a team's scoring outlook, given the down, the distance and the field position before and after it. Averaged over every pass and run, it ranks offenses and defenses on a per-play scale that ignores pace and garbage-time totals. Through week 5 of 2026 the league has run 10,208 such plays, and they averaged +.010 EPA per play with a success rate of 43.7% (a play counts as a success when its EPA is above zero).
On net, offense minus defense, San Francisco leads at +.260, followed by Kansas City (+.188), Jacksonville (+.178), Minnesota (+.135) and Baltimore. The bottom five are Miami (-.223), Tennessee (-.193), Philadelphia, Arizona and the Chargers. The best offense by EPA per play is Buffalo's at +.211; the best defense is Minnesota's, which has allowed -.235 per play.
The sharper question is what a five-game ranking is worth. Across the 2002-2025 seasons, five-game net EPA forecast the rest of a team's season about as well as its point margin did, a little worse in fact, and the offensive half of it carried far more of the signal than the defensive half.
The Exhibit
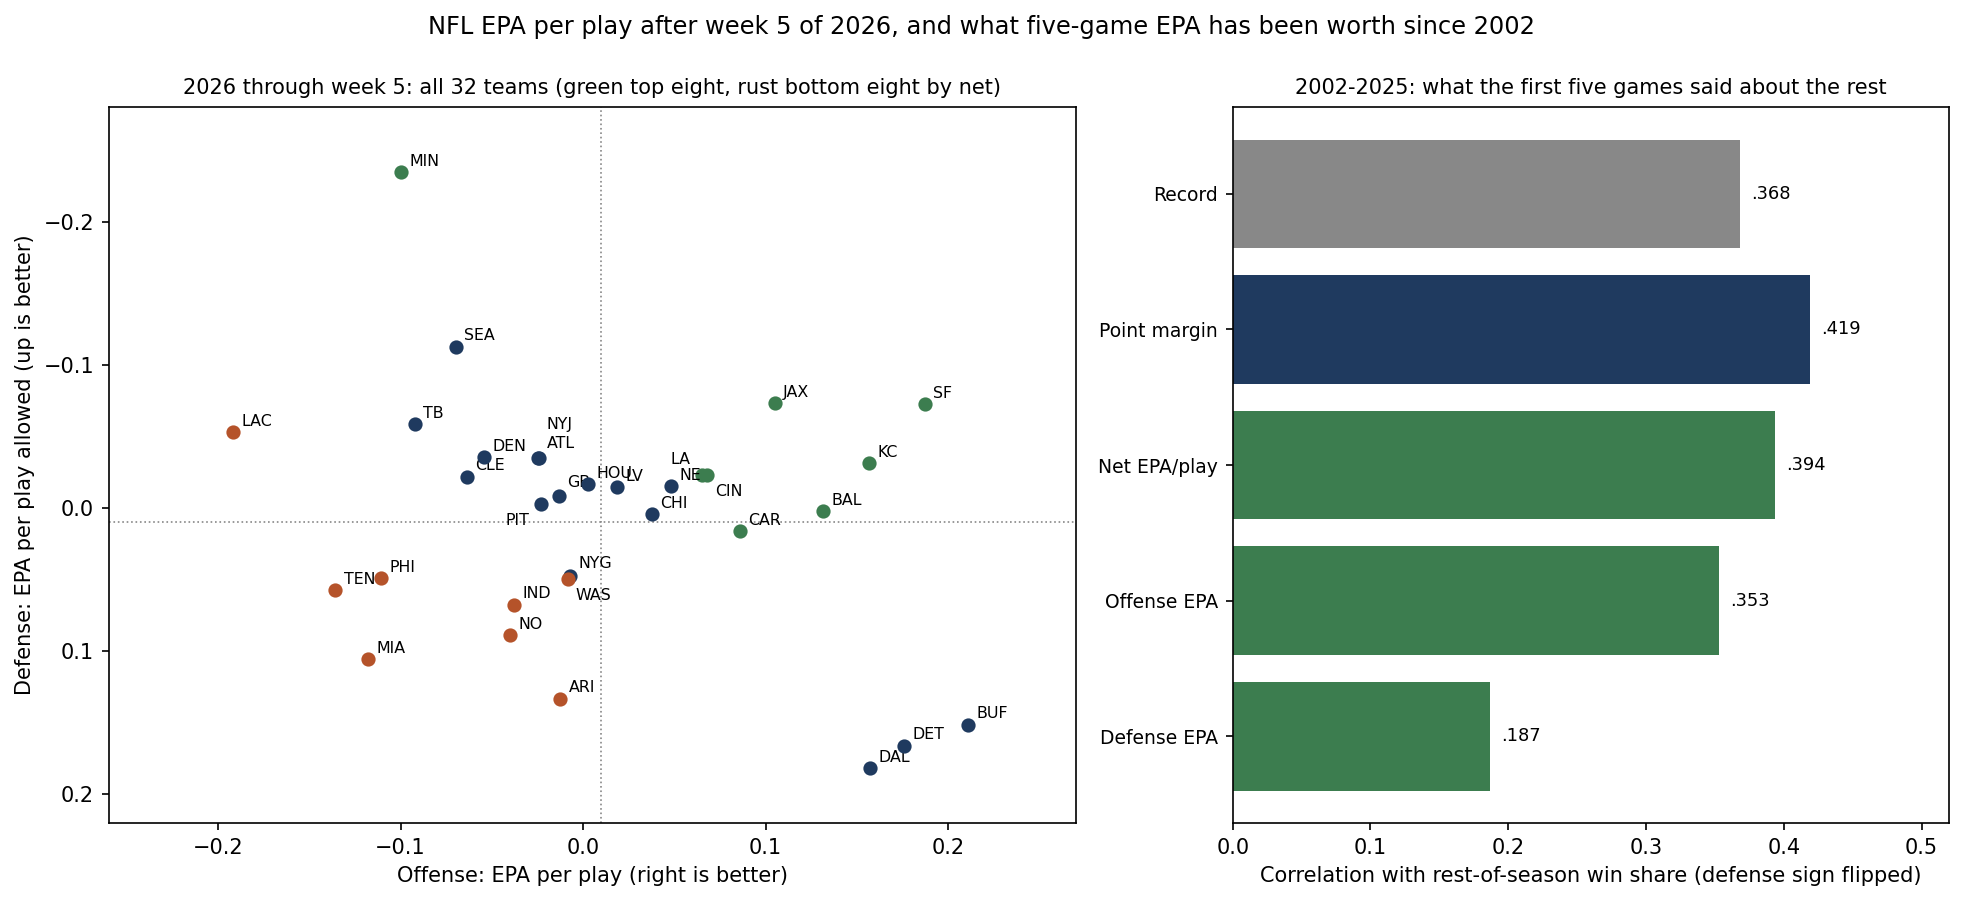
NFL EPA per Play Rankings After Week 5
Ranked by net EPA per play. Offense columns are EPA per play and success rate; defense columns are what opponents gained per play against the team, so lower is better. The figure in brackets is the rank among the 32 teams.
| Net rank | Team | W-L-T | Offense EPA/play | Offense success | Defense EPA/play | Defense success | Net |
|---|---|---|---|---|---|---|---|
| 1 | San Francisco | 5-0 | +.187 (2) | 51.9% | -.072 (4) | 41.8% | +.260 |
| 2 | Kansas City | 4-0 | +.157 (5) | 48.1% | -.031 (10) | 42.4% | +.188 |
| 3 | Jacksonville | 4-1 | +.105 (7) | 45.4% | -.073 (3) | 41.5% | +.178 |
| 4 | Minnesota | 5-0 | -.100 (28) | 36.5% | -.235 (1) | 32.0% | +.135 |
| 5 | Baltimore | 4-1 | +.132 (6) | 49.4% | +.002 (19) | 41.9% | +.129 |
| 6 | Cincinnati | 3-2 | +.068 (9) | 47.0% | -.023 (12) | 44.0% | +.091 |
| 7 | The Rams | 2-3 | +.065 (10) | 47.1% | -.023 (11) | 43.3% | +.088 |
| 8 | Carolina | 2-2 | +.086 (8) | 43.3% | +.016 (21) | 43.1% | +.070 |
| 9 | New England | 3-2 | +.048 (11) | 45.3% | -.015 (15) | 41.8% | +.064 |
| 10 | Buffalo | 4-1 | +.211 (1) | 49.4% | +.151 (30) | 49.3% | +.059 |
| 11 | Seattle | 3-2 | -.070 (26) | 42.0% | -.113 (2) | 38.5% | +.043 |
| 12 | Chicago | 3-2 | +.038 (12) | 46.9% | +.004 (20) | 42.0% | +.034 |
| 13 | The Raiders | 3-2 | +.019 (13) | 43.7% | -.015 (16) | 44.5% | +.033 |
| 14 | Houston | 1-4 | +.003 (14) | 43.2% | -.016 (14) | 39.8% | +.019 |
| 15 | Atlanta | 2-3 | -.024 (20) | 45.7% | -.035 (8) | 39.7% | +.011 |
| 16 | The Jets | 2-3 | -.024 (21) | 42.6% | -.035 (9) | 44.7% | +.010 |
| 17 | Detroit | 3-2 | +.176 (3) | 49.1% | +.166 (31) | 48.2% | +.010 |
| 18 | Green Bay | 3-2 | -.013 (18) | 40.0% | -.009 (17) | 45.1% | -.004 |
| 19 | Denver | 3-2 | -.054 (24) | 40.3% | -.035 (7) | 40.7% | -.019 |
| 20 | Pittsburgh | 3-2 | -.023 (19) | 42.7% | -.002 (18) | 44.6% | -.021 |
| 21 | Dallas | 2-3 | +.157 (4) | 49.2% | +.182 (32) | 50.9% | -.024 |
| 22 | Tampa Bay | 1-4 | -.092 (27) | 41.0% | -.059 (5) | 42.4% | -.034 |
| 23 | Cleveland | 3-2 | -.063 (25) | 39.9% | -.022 (13) | 43.7% | -.041 |
| 24 | The Giants | 3-1-1 | -.007 (15) | 42.7% | +.048 (22) | 46.5% | -.055 |
| 25 | Washington | 1-3-1 | -.008 (16) | 39.9% | +.050 (24) | 46.8% | -.058 |
| 26 | Indianapolis | 2-3 | -.038 (22) | 42.8% | +.067 (26) | 43.4% | -.105 |
| 27 | New Orleans | 1-4 | -.040 (23) | 43.6% | +.089 (27) | 50.3% | -.129 |
| 28 | The Chargers | 0-5 | -.192 (32) | 38.4% | -.053 (6) | 42.0% | -.139 |
| 29 | Arizona | 1-4 | -.013 (17) | 45.8% | +.133 (29) | 45.0% | -.146 |
| 30 | Philadelphia | 2-3 | -.111 (29) | 36.1% | +.049 (23) | 44.5% | -.159 |
| 31 | Tennessee | 0-5 | -.136 (31) | 40.5% | +.057 (25) | 42.9% | -.193 |
| 32 | Miami | 0-5 | -.118 (30) | 37.7% | +.106 (28) | 48.7% | -.223 |
Where EPA and the Standings Disagree
Minnesota is 5-0 with an offense 28th in EPA per play (-.100) and 31st in success rate. Its defense is first by a distance, and the net still puts the team fourth. Dallas is the reverse: 2-3 with the fourth-best offense (+.157) and the worst defense (+.182 allowed). Detroit (+.176 on offense, +.166 allowed) and Buffalo (+.211, 30th on defense) share the shape, which leaves Detroit 17th on net despite its winning record.
Six teams with winning records rank in the bottom half on net EPA: Cleveland, Denver, Detroit, Green Bay, the Giants and Pittsburgh. Four teams with losing records rank in the top half: Atlanta, Houston, the Rams and the Jets. Seattle, first on the site's Elo board, is 11th on net, with the second-best defense and the 26th offense; Thursday's game at Denver is taken apart unit by unit in today's companion piece.
What a Five-Game EPA Ranking Has Been Worth
The test takes in every team-season from 2002 to 2025, 768 of them, built from 12,446 team-games of nflverse play-by-play. For each, the first five games give a record, a point margin per game and a net EPA per play, and the rest of the season (11 or 12 games) gives the outcome.
Correlated with the rest-of-season win share, the record scores .368, net EPA .394 and point margin .419. Against the rest-of-season point margin the order is the same: .411, .439 and .460. Fitted together on standardised inputs, point margin carries .054 of win share per standard deviation (standard error .018), net EPA .023 (.015) and the record .016 (.012). After five games, EPA per play has not beaten the scoreboard; over five games it mostly repeats what the margin already says.
The two halves of EPA behave differently. Offensive EPA per play over the first five games correlates .578 with the same team's offensive EPA over the rest of the season; defensive EPA per play, .345. Alone, five-game offensive EPA correlates .353 with rest-of-season wins and defensive EPA .187. An early defensive ranking is the less stable half of the table, which is worth remembering for Minnesota at one end and Dallas, Detroit and Buffalo at the other.
The extremes kept some of their gap. The five best net EPA teams of each season (120 in all) had won .771 of their first five games and won .620 of the rest; the five worst had won .238 and won .374 afterwards. Where record and EPA disagreed, both counted. The 79 teams with three or more wins but a bottom-half net EPA won .490 of their remaining games, against .592 for the 309 teams with the same start and a top-half number. The 72 teams with two wins or fewer and a top-half net EPA won .515.
What This Page Does Not Show
- Opponents. The numbers are raw: five games against a soft schedule flatter a unit, and nothing here adjusts for who was on the other side. That is the gap opponent-adjusted measures try to close.
- Garbage time and special teams. Every pass and run with an EPA value counts the same, whatever the score; kicks, punts and returns are left out.
- Players and injuries. The page reads team totals from play-by-play. It names no player and knows nothing about who was on the field.
- The model behind EPA. EPA values come from nflverse's expected-points model as published; a different model would move the numbers a little.
Method and Sources
play         = regular-season pass or run (pass == 1 or rush == 1) with an EPA value; sacks and scrambles count as passes
EPA/play     = summed EPA / plays;  success rate = share of plays with EPA above zero
defense      = the same numbers for the plays opponents ran against the team (lower is better)
net          = offense EPA/play - defense EPA/play
history      = each team's first 5 regular-season games, 2002-2025, against its remaining 11 (to 2020) or 12 games
joint fit    = least squares of rest-of-season win share on standardised record, point margin per game and net EPA/play
The script make_epa_rankings_week5_chart.py reduces the play-by-play to team totals, checks games played against the standings data, computes the table and the 2002-2025 comparison, draws the exhibit and asserts every number on this page.
Sources: nflverse public play-by-play release files for 2002-2025 and for 2026 (the 2026 file as updated October 14, 2026, weeks 1-5 complete); the nflverse game log for scores, pulled October 14; ESPN's public week-5 scoreboard as the second source that all fifteen week-5 games are final; the site's standings data, checked against ESPN's for all 32 teams.
Further reading
- Seahawks at Broncos, Week 6 Thursday: The EPA Matchup: today's companion, Thursday's game unit by unit
- Expected Points (EP) and EPA: how the number behind this table is built
- What Is Success Rate in Football?: the down-by-down version of the same idea
- EPA vs. DVOA vs. Success Rate: which efficiency measure to use, and when
- NFL Standings After Week 5: Records vs Point Differential: the same five games read from the scoreboard
- Power rankings: the site's Elo board after every graded game
Go deeper
Want the code behind these metrics? Work through the 43-chapter NFL analytics tutorial.
Browse tutorials Free tools