Thursday Night Opens Week 6
Week 6 starts on Thursday, October 15, with Seattle at Denver at 8:15 p.m. ET at Empower Field at Mile High, streamed on Prime Video. Both teams are 3-2. Seattle has outscored its opponents 134-105; Denver has been outscored 97-111 and is 2-0 at home. On the site's Elo board Seattle is first (1670.5) and Denver seventh (1602.8), and the prediction ledger, frozen on October 13, gives Seattle .5282 and Denver .4718 with home field counted.
The play-by-play tells a narrower story than the board. By expected points added per play, Seattle's offense is 26th in the league (-.070) and Denver's 24th (-.054). The defenses are where both teams have won games: Seattle's is second (-.113 allowed per play) and Denver's seventh (-.035). On net, offense minus defense, Seattle is +.043 (11th) and Denver -.019 (19th), a gap of .062 per play.
The Exhibit
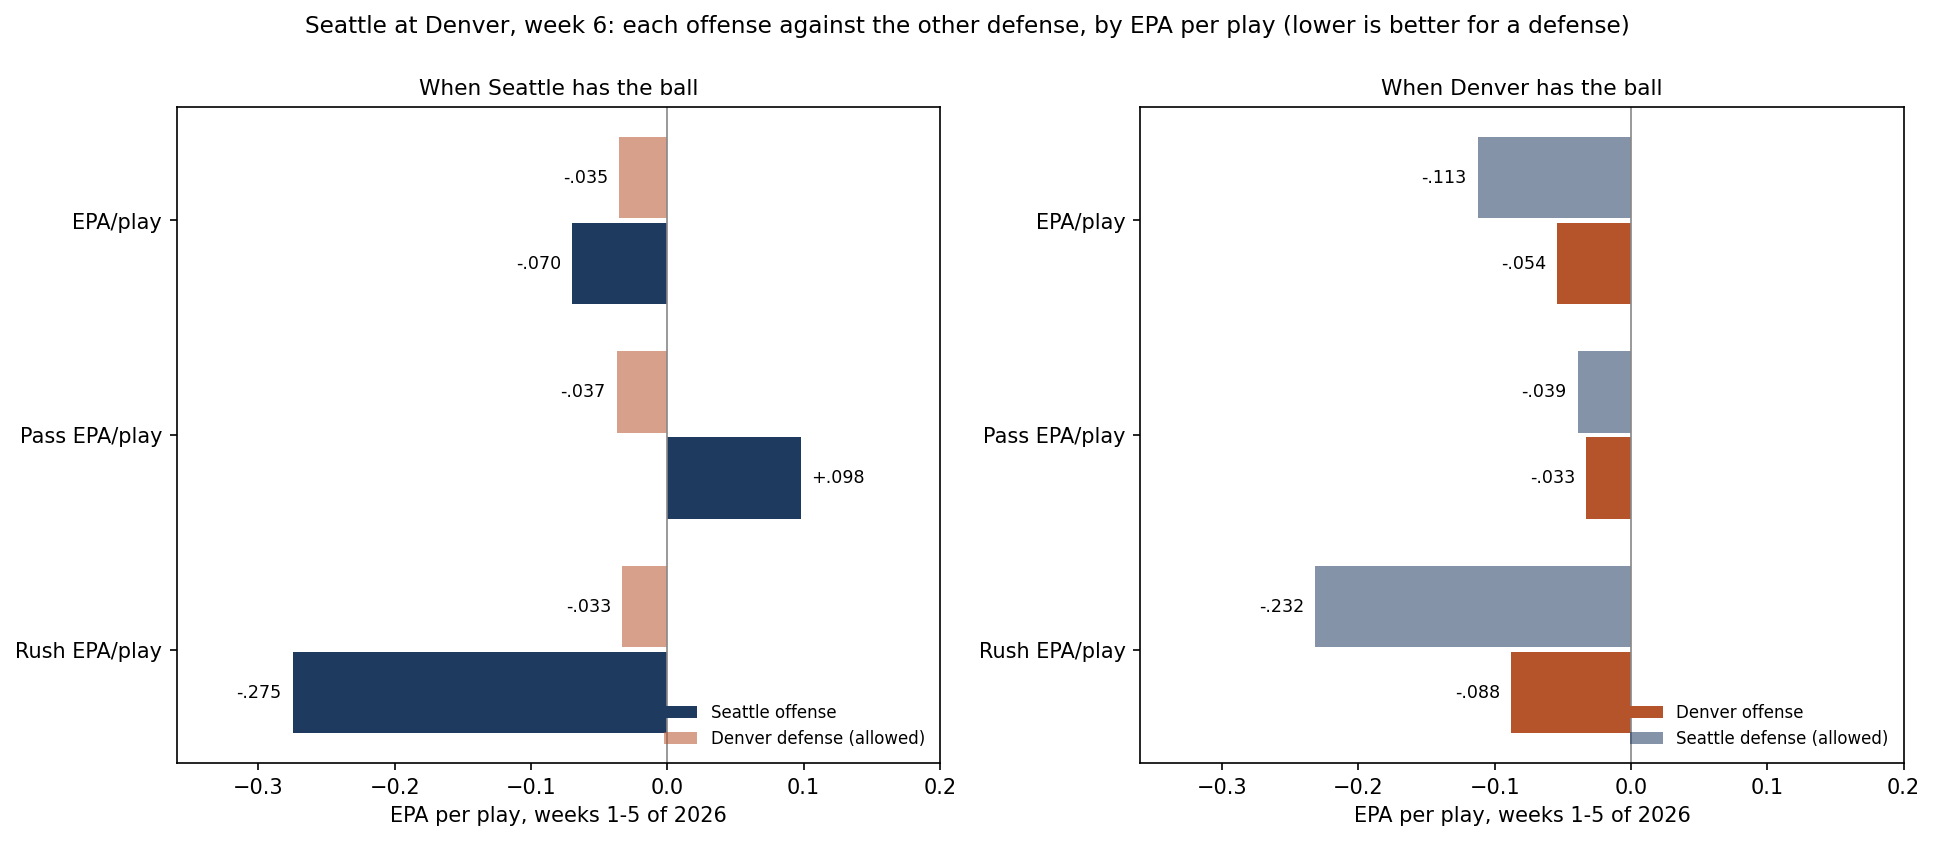
Seahawks vs Broncos by EPA, Success Rate and CPOE
Through week 5. The figure in brackets is the rank among the 32 teams; defense ranks put the lowest number allowed first.
| When Seattle has the ball | Seattle offense | Denver defense |
|---|---|---|
| EPA per play | -.070 (26th) | -.035 (7th) |
| Success rate | 42.0% (22nd) | 40.7% (5th) |
| EPA per pass play | +.098 (17th) | -.037 (3rd) |
| EPA per run | -.275 (30th) | -.033 (28th) |
| CPOE (points of completion percentage) | +4.0 (9th) | -2.7 allowed |
| When Denver has the ball | Denver offense | Seattle defense |
|---|---|---|
| EPA per play | -.054 (24th) | -.113 (2nd) |
| Success rate | 40.3% (25th) | 38.5% (2nd) |
| EPA per pass play | -.033 (23rd) | -.039 (2nd) |
| EPA per run | -.088 (15th) | -.232 (2nd) |
| CPOE (points of completion percentage) | -2.6 (27th) | +0.2 allowed |
Where the Units Meet
Seattle's run game against Denver's run defense is the one place where a weakness meets a weakness. Seattle's runs have lost .275 expected points each, 30th in the league and well below the league's -.104; Denver's run defense has allowed -.033, 28th. Seattle has run on 45% of its plays (it passes on 55.0%), so this matchup accounts for a large share of its snaps.
Seattle's passing against Denver's pass defense is strength against strength. Seattle's dropbacks have earned +.098 per play, a little above the league's +.081, with completions running 4.0 points above expectation (9th). Denver's pass defense has held opponents to -.037 per dropback, third in the league.
Denver's offense against Seattle's defense is the most lopsided side of the game on paper. Denver passes on 61.3% of its plays, and its passing has been below zero (-.033, 23rd) with completions 2.6 points under expectation (27th). Seattle's defense ranks second in EPA allowed per pass and second per run, and second in success rate allowed (38.5%).
Five games are a small sample, and both offenses have swung from week to week. Seattle's offense finished above zero EPA per play in two of its five games, and its worst game was its most recent (-.414 in week 5). Denver's was above zero in three, after a week-1 game at -.378.
How Often an EPA Edge This Size Has Picked the Winner
The test takes every regular-season game from 2002 to 2025 played at one team's home in which both teams had already played at least four games and the game did not end tied: 4,317 games. Before each one, the season-to-date numbers say which team had the better net EPA per play, the better point margin per game and the better record.
The team with the better net EPA per play won .625 of those games. The team with the better point margin won .632, and the team with the better record .636 (of the 3,837 games in which the records differed). Home teams won .565. When EPA and point margin pointed at different teams, which happened in 421 games, the EPA side won only .463.
Seattle's net edge is .062 per play, on the road. In the 562 games in which the visiting team held a season-to-date edge between .03 and .09, the visitor won .464 (standard error .021). In the 535 games in which the home team held an edge of that size, the home team won .602. Narrowed to the 502 visitors who also led on point margin, as Seattle does, the visitor won .478. On this history an edge of Seattle's size on the road is close to a coin flip, slightly short of one, and the ledger's .5282 sits a little above it because the board's ratings carry part of last season forward and rank Seattle first.
What This Page Does Not Show
- Opponents. The five-game numbers are not adjusted for schedule; a defense that has met weak offenses looks better than it is.
- Players and injuries. The page reads team totals from play-by-play. It names no player and knows nothing about who will be on the field on Thursday.
- Altitude, rest and the short week. Both teams come off Sunday games. The site's pages on Denver's home field and Thursday games measure those separately.
- A prediction of its own. The only forecast on this page is the ledger's frozen number from October 13. The counts above describe history; they are not a second pick.
Method and Sources
play          = regular-season pass or run (pass == 1 or rush == 1) with an EPA value; sacks and scrambles count as passes
EPA/play      = summed EPA / plays;  success rate = share of plays with EPA above zero
CPOE          = mean completion percentage over expected on the attempts that carry a value
defense       = the same numbers for the plays opponents ran against the team (lower is better)
history       = 2002-2025, non-neutral, not tied, both teams with 4+ games played; season-to-date figures exclude the game itself
edge band     = net EPA/play difference of .03 to .09 (Seattle's: .062)
The script make_sea_den_thursday_epa_chart.py reads the game and the ledger row from the frozen files, recomputes every unit number and rank from the play-by-play, runs the 2002-2025 count, draws the exhibit and asserts every number on this page.
Sources: nflverse public play-by-play release files for 2002-2025 and for 2026 (the 2026 file as updated October 14, 2026, weeks 1-5 complete); the nflverse game log for scores, pulled October 14; ESPN's public week-6 scoreboard, pulled October 14, for the date, kickoff time, venue, broadcast and records; the site's prediction ledger and Elo board as frozen on October 13.
Further reading
- NFL EPA Rankings After Week 5: All 32 Offenses and Defenses: today's companion, the whole league on the same scale
- Expected Points (EP) and EPA: how the number in these tables is built
- What Is CPOE in Football?: completion percentage over expected, explained
- What Is Success Rate in Football?: the down-by-down version of EPA
- Denver's Home Field, Measured: what playing at altitude has been worth
- Week 6 predictions: every game on the board, frozen before kickoff
Go deeper
Want the code behind these metrics? Work through the 43-chapter NFL analytics tutorial.
Browse tutorials Free tools