What is the NFL passer rating formula?
Passer rating adds four per-attempt parts and rescales the total: rating = (a + b + c + d) / 6 × 100, where a = (completions / attempts − 0.3) × 5, b = (yards / attempts − 3) × 0.25, c = (touchdowns / attempts) × 20 and d = 2.375 − (interceptions / attempts × 25). Each part is held between 0 and 2.375, so the ceiling is 4 × 2.375 / 6 × 100 = 158.3 and the floor is 0. Off the caps, one touchdown is worth 80 passing yards and one interception costs 100.
Related: Passer rating vs. QBR · Passer rating calculator
Every example is computed with the NFL formula from nflverse's public player-game statistics, frozen October 15, 2026.
The Formula, Part by Part
The NFL's passer rating takes a passer's box-score line (completions, attempts, passing yards, touchdown passes and interceptions) and turns it into one number. It never looks at sacks, runs or the score. Four rates go in, each one per attempt, and each becomes a part worth between 0 and 2.375:
| Part | Computed as | Scores 0 at | Scores 1.0 at | Hits the 2.375 cap at |
|---|---|---|---|---|
| a, completions | (Cmp/Att − 0.3) / 0.2 | 30% or lower | 50% | 77.5% |
| b, yards | (Yds/Att − 3) / 4 | 3.0 yards or fewer | 7.0 yards | 12.5 yards |
| c, touchdowns | (TD/Att) / 0.05 | no touchdowns | 5% | 11.875% |
| d, interceptions | 2.375 − (Int/Att) / 0.04 | 9.5% or higher | 5.5% | no interceptions |
The four parts are added, divided by 6 and multiplied by 100. A line that scores exactly 1.0 on every part rates 66.7. A line at the cap on all four rates 4 × 2.375 / 6 × 100 = 158.3, the famous "perfect" passer rating, and a line at zero on all four rates 0.0. Yards are gross passing yards: sacks count neither as attempts nor as lost yards.
Worked Example: A Full Season, Step by Step
Among the 26 passers with 300 or more attempts in the 2025 regular season, the highest rating belonged to New England's Drake Maye: 354 completions on 492 attempts for 4,394 yards, 31 touchdowns and 8 interceptions. Here is every step.
- Completions. 354 / 492 = 0.7195. Subtract 0.3 and divide by 0.2: a = 2.0976.
- Yards. 4,394 / 492 = 8.931 yards per attempt. Subtract 3 and divide by 4: b = 1.4827.
- Touchdowns. 31 / 492 = 0.0630. Divide by 0.05: c = 1.2602.
- Interceptions. 8 / 492 = 0.0163. Divide by 0.04 and subtract from 2.375: d = 1.9685.
- Check the caps. All four parts sit between 0 and 2.375, so nothing is trimmed.
- Add, divide by 6, multiply by 100. 2.0976 + 1.4827 + 1.2602 + 1.9685 = 6.8089, and 6.8089 / 6 × 100 = 113.5.
For scale, Matthew Stafford was second at 109.2, the median of those 26 passers was 93.5, and every regular-season pass of 2025 taken together rated 91.4.
Worked Example: A Game Where the Caps Bite
Caps rarely matter over a season but often matter in one game. Jacksonville's Trevor Lawrence went 18 of 23 for 245 yards, four touchdowns and no interceptions against Cleveland in week 1 of 2026, the second-highest rating of the 152 games this season with 20 or more attempts through week 5.
- Completions. 18 / 23 = 0.7826, so a = 2.413, above the cap: it counts as 2.375.
- Yards. 245 / 23 = 10.65 per attempt, so b = 1.913.
- Touchdowns. 4 / 23 = 0.1739, so c = 3.478, well above the cap: it counts as 2.375.
- Interceptions. None, so d = 2.375, the most that part can give.
- Add and rescale. 2.375 + 1.913 + 2.375 + 2.375 = 9.038, and 9.038 / 6 × 100 = 150.6.
Without the caps the same line would rate 169.7. The trimmed 19 points are the formula's way of saying that four touchdowns on 23 throws cannot keep that pace, and of keeping the scale bounded. The only higher 2026 game so far is Maye's 26 of 34 for 374 yards and four touchdowns against the Raiders in week 5, at 150.9.
The Formula as a Straight Line: What a Touchdown Is Worth
Multiply the four parts out and, as long as no cap binds, the formula collapses into a straight line in the four per-attempt rates:
rating = 2.083 + 83.33 x (Cmp/Att) + 4.167 x (Yds/Att) + 333.3 x (TD/Att) - 416.7 x (Int/Att)Divide every weight by the yards weight and the formula's exchange rates appear. Per attempt, a completion is worth 20 yards, a touchdown 80 yards and an interception minus 100 yards. Compared with an incompletion, a 20-yard touchdown pass adds 20 (the yards) + 20 (the completion) + 80 (the touchdown) = 120 yards' worth of rating, and an interception takes away as much as two and a half 20-yard completions add.
On a season the size of Maye's (492 attempts), holding everything else fixed, one more touchdown pass adds 0.68 points and one interception fewer adds 0.85. Eighty more passing yards move his 113.5 by exactly as much as one more touchdown.
How Often the Caps Bind
The history below takes in the 2003-2025 regular seasons (the 2002 file is missing Jacksonville's home games). Of 11,306 games in which a passer threw 20 or more times, 1,385 (12.3%) had at least one part outside the 0 to 2.375 range:
- Completion rate above 77.5%: 672 games (5.9%). Below 30%: 13.
- Touchdown rate above 11.875%: 442 games (3.9%).
- More than 12.5 yards per attempt: 96 games. Fewer than 3: 61.
- Interception rate above 9.5%: 322 games (2.8%), where the interception part bottoms out at 0 however many more are thrown.
- No interceptions: 4,924 games (43.6%) collected the full 2.375 from that part.
There were 26 perfect games of 158.3 in those seasons, all without an interception, and 14 of the 26 came in 2018 or later. The most recent is Jalen Hurts's 19 of 23 for 326 yards and three touchdowns against Minnesota in week 7 of 2025. Four games rated 0.0.
Over a full season the caps never bind. Of the 641 passer-seasons with 300 or more attempts from 2003 to 2025, not one had a part outside the range; the highest completion rate among them was Drew Brees's 74.4% in 2018, short of the 77.5% cap, and the highest rating was Aaron Rodgers's 122.5 in 2011. For season lines, the straight-line form above is the formula.
The Exhibit: Where the League's Rise Came From
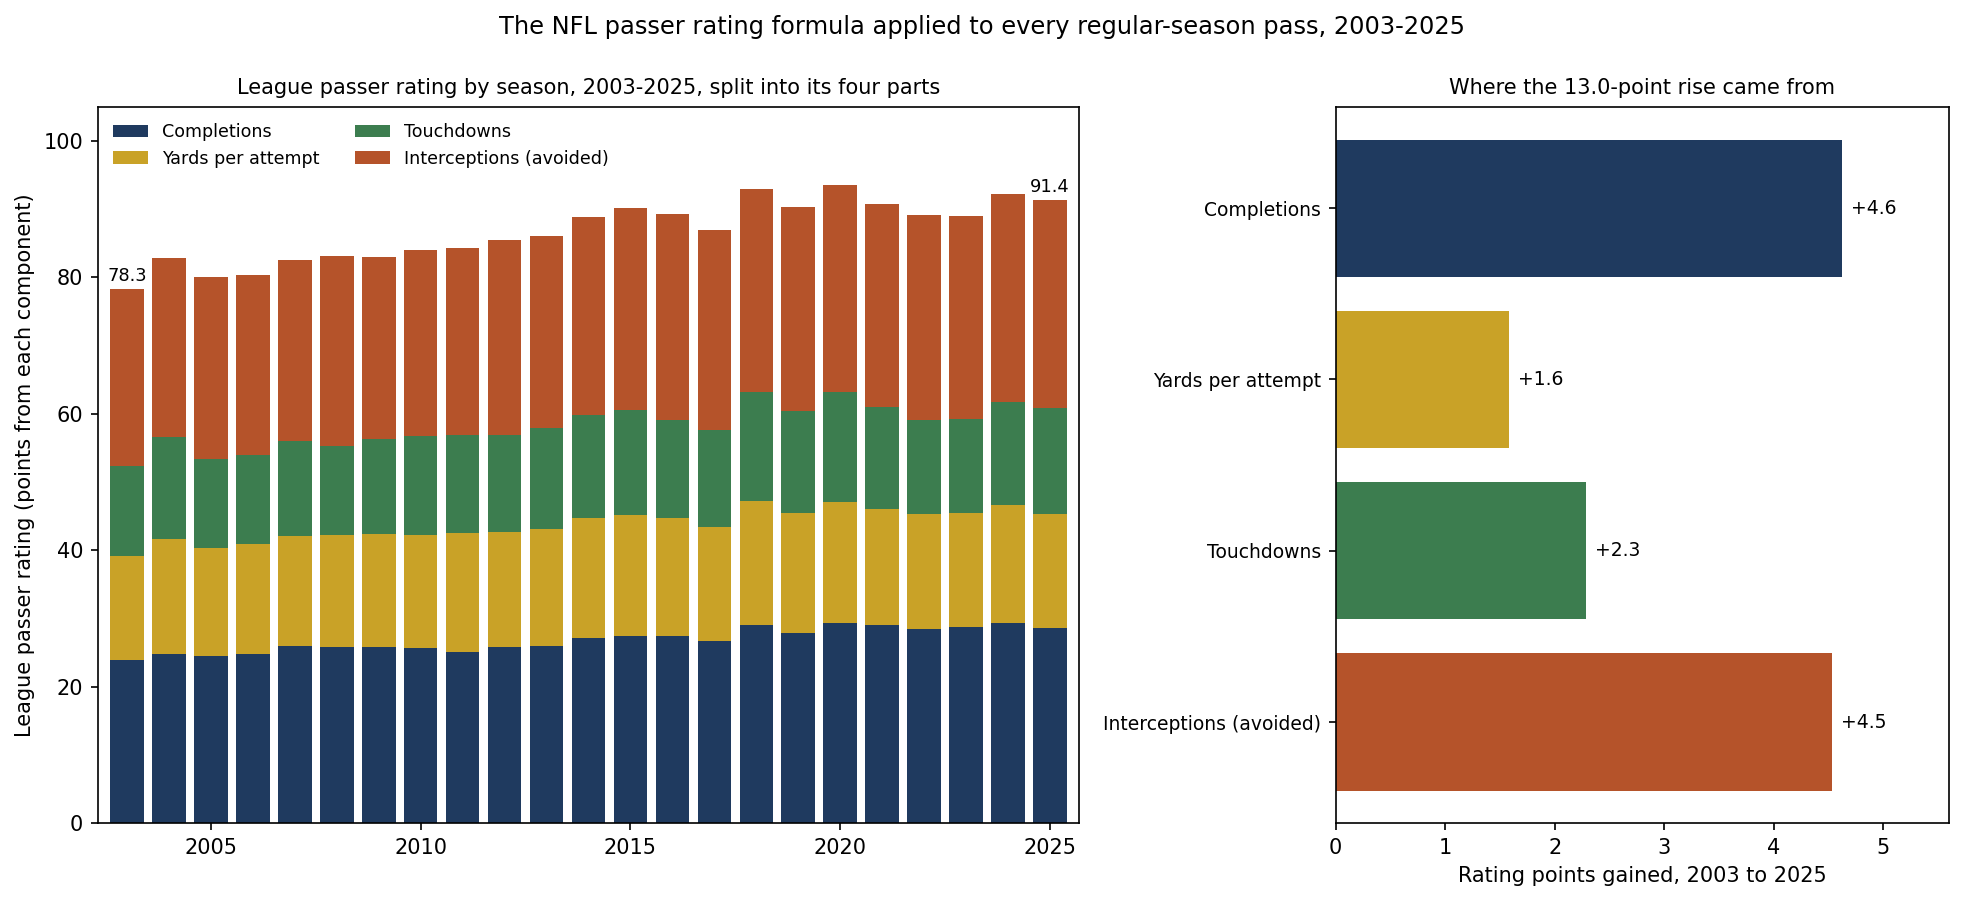
Apply the formula to every regular-season pass in a season and the league rated 78.3 in 2003, its lowest year in the file, and 91.4 in 2025, a rise of 13.0 points. The peak was 93.6 in 2020, and 2026 stands at 92.2 through week 5 on 5,231 attempts.
The parts did not rise together. The league completion rate went from 58.8% to 64.3%, worth +4.6 points, and the interception rate fell from 3.27% to 2.18%, worth +4.5. The touchdown rate rose from 3.96% to 4.65% (+2.3). Yards per attempt barely moved, 6.64 to 7.02, for +1.6. Completions and interceptions together account for 70% of the rise; yards for 12%. Most of what reads as rating inflation is more accurate and safer passing rather than longer gains, which is why the same rating means less now than it did in 2003.
What the Formula Leaves Out
- Sacks and runs. Neither enters the formula, so a passer who takes sacks or adds value with his legs looks the same as one who does not. ANY/A adds sacks back; EPA counts every play.
- Situation. A completion on 3rd-and-15 that gains 9 yards scores the same as one that converts a 3rd-and-5.
- Era. The constants were set for the passing game of the early 1970s. Today's league average sits far above the 66.7 an all-1.0 line produces, so comparisons across decades need care.
- Accuracy versus difficulty. Completion rate rewards easy throws as much as hard ones; CPOE adjusts for that.
Method and Sources
a = clamp((Cmp/Att - 0.3) / 0.2)      b = clamp((Yds/Att - 3) / 4)
c = clamp((TD/Att) / 0.05)            d = clamp(2.375 - (Int/Att) / 0.04)
clamp(x) = min(max(x, 0), 2.375)      rating = (a + b + c + d) / 6 x 100
season line  = a passer's regular-season totals; "300+ attempts" is this page's threshold
single game  = a passer's line in one regular-season game with 20 or more attempts
league line  = every regular-season pass in a season, all passers together
history      = 2003-2025 regular seasons (2002 lacks Jacksonville's home games); 2026 = weeks 1-5
The script make_passer_rating_formula_chart.py recomputes both worked examples, the exchange rates, the cap counts and the league series from the frozen files, checks the player totals against nflverse's team totals for every season, draws the exhibit and asserts every number on this page. The passer rating calculator runs the same formula on any line you enter.
Sources: nflverse public player-game and team-game statistics release files (tags stats_player and stats_team) for 2002-2026, read October 15, 2026 (the 2026 files as updated that morning, weeks 1-5 complete); the nflverse game log for the 2026 schedule.
Further reading
- Passer Rating vs. QBR: how the formula compares with ESPN's play-by-play rating
- ANY/A: the passing average that charges sacks and weights touchdowns and interceptions
- CPOE: completion percentage measured against how hard the throws were
- Expected Points (EP) and EPA: valuing every play by its effect on scoring
- Passer rating calculator: enter any line and see the four parts
Go deeper
Want the code behind these metrics? Work through the 43-chapter NFL analytics tutorial.
Browse tutorials Free tools