Which NFL teams lead in turnover differential after week 5 of 2026?
Minnesota leads at +6 (10 takeaways, 4 giveaways), ahead of Jacksonville, Kansas City and Washington at +5. Indianapolis and New Orleans are last at -6. Turnover differential is takeaways (interceptions made plus opponents' fumbles recovered) minus giveaways (interceptions thrown plus fumbles lost). Since 2003, a five-game margin has carried into the rest of the season at a correlation of only .18.
Related: Turnovers and luck · Standings after week 5
Counted from nflverse's public team-game statistics as updated on the morning of October 15, 2026 (weeks 1-5), and checked against nflverse play-by-play for all 32 teams.
Five Games of Turnovers
Through week 5 the league has turned the ball over 201 times in 79 games: 109 interceptions and 92 lost fumbles, or 1.27 giveaways per team per game. From 2003 to 2025 the average was 1.50, so 2026 has been a careful season so far. Every team has played five games except Kansas City and Carolina, who have played four.
Minnesota, 5-0, has the best margin at +6, with 10 takeaways against 4 giveaways. Jacksonville, Kansas City and Washington follow at +5, and Detroit is at +4 having given the ball away once, the fewest in the league. At the other end, Indianapolis and New Orleans are at -6, and Atlanta, the Chargers, New England and Tennessee at -5. The Chargers' 13 giveaways are the most of any team; Seattle's 11 takeaways are the most, though its 9 giveaways leave it at +2. The Jets, Houston and Detroit have yet to throw an interception.
The question for the rest of the season is how much of this will last. The history below says not much.
The Exhibit
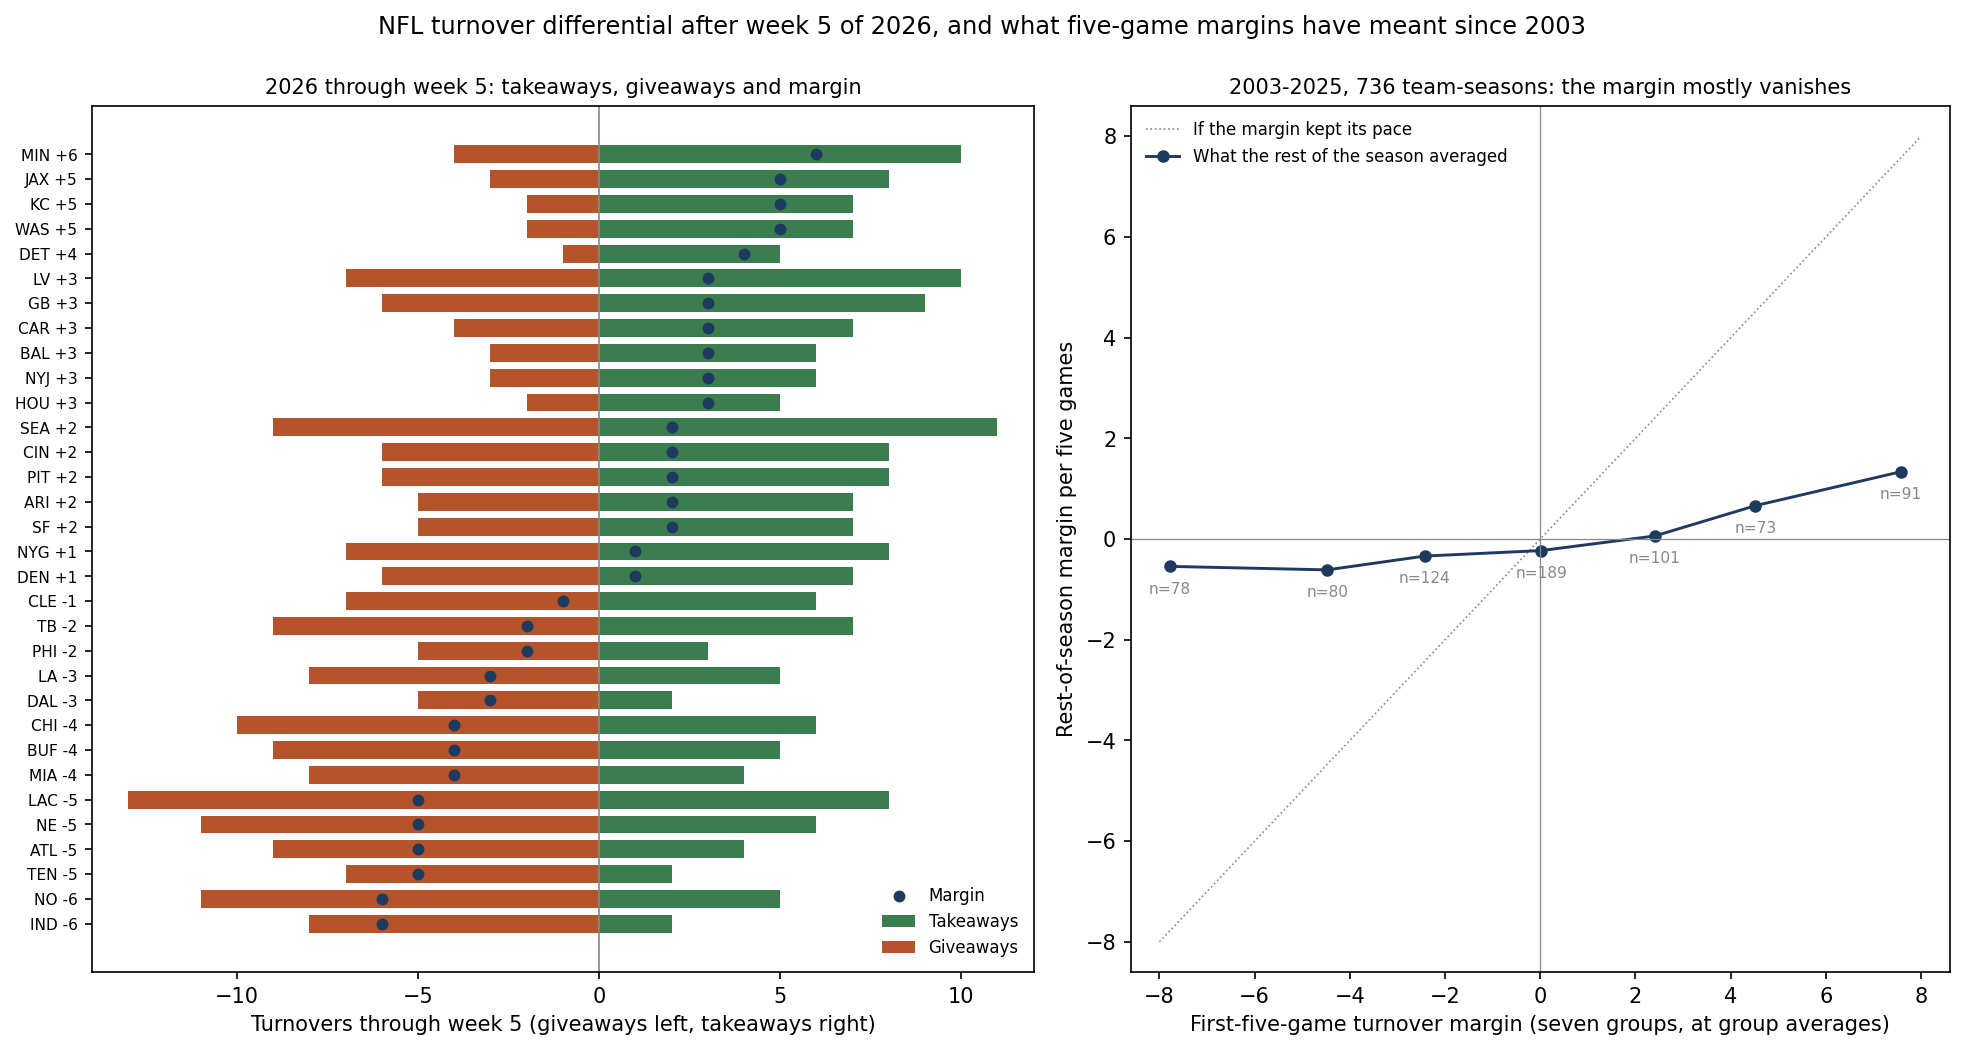
NFL Turnover Differential After Week 5: All 32 Teams
Ranked by margin; teams on the same margin share a rank and are listed by takeaways. Takeaways are interceptions made plus opponents' fumbles recovered; giveaways are interceptions thrown plus fumbles lost, on every play, special teams included.
| Rank | Team | W-L-T | INT made | Fumbles rec. | Takeaways | INT thrown | Fumbles lost | Giveaways | Margin |
|---|---|---|---|---|---|---|---|---|---|
| 1 | Minnesota | 5-0 | 6 | 4 | 10 | 2 | 2 | 4 | +6 |
| 2 | Jacksonville | 4-1 | 6 | 2 | 8 | 3 | 0 | 3 | +5 |
| 2 | Kansas City | 4-0 | 4 | 3 | 7 | 2 | 0 | 2 | +5 |
| 2 | Washington | 1-3-1 | 3 | 4 | 7 | 1 | 1 | 2 | +5 |
| 5 | Detroit | 3-2 | 3 | 2 | 5 | 0 | 1 | 1 | +4 |
| 6 | The Raiders | 3-2 | 4 | 6 | 10 | 4 | 3 | 7 | +3 |
| 6 | Green Bay | 3-2 | 7 | 2 | 9 | 3 | 3 | 6 | +3 |
| 6 | Carolina | 2-2 | 3 | 4 | 7 | 2 | 2 | 4 | +3 |
| 6 | Baltimore | 4-1 | 3 | 3 | 6 | 1 | 2 | 3 | +3 |
| 6 | The Jets | 2-3 | 1 | 5 | 6 | 0 | 3 | 3 | +3 |
| 6 | Houston | 1-4 | 2 | 3 | 5 | 0 | 2 | 2 | +3 |
| 12 | Seattle | 3-2 | 7 | 4 | 11 | 5 | 4 | 9 | +2 |
| 12 | Cincinnati | 3-2 | 3 | 5 | 8 | 3 | 3 | 6 | +2 |
| 12 | Pittsburgh | 3-2 | 4 | 4 | 8 | 4 | 2 | 6 | +2 |
| 12 | Arizona | 1-4 | 3 | 4 | 7 | 5 | 0 | 5 | +2 |
| 12 | San Francisco | 5-0 | 3 | 4 | 7 | 2 | 3 | 5 | +2 |
| 17 | The Giants | 3-1-1 | 6 | 2 | 8 | 3 | 4 | 7 | +1 |
| 17 | Denver | 3-2 | 5 | 2 | 7 | 3 | 3 | 6 | +1 |
| 19 | Cleveland | 3-2 | 4 | 2 | 6 | 2 | 5 | 7 | -1 |
| 20 | Tampa Bay | 1-4 | 5 | 2 | 7 | 5 | 4 | 9 | -2 |
| 20 | Philadelphia | 2-3 | 3 | 0 | 3 | 4 | 1 | 5 | -2 |
| 22 | The Rams | 2-3 | 4 | 1 | 5 | 6 | 2 | 8 | -3 |
| 22 | Dallas | 2-3 | 0 | 2 | 2 | 3 | 2 | 5 | -3 |
| 24 | Chicago | 3-2 | 3 | 3 | 6 | 5 | 5 | 10 | -4 |
| 24 | Buffalo | 4-1 | 2 | 3 | 5 | 4 | 5 | 9 | -4 |
| 24 | Miami | 0-5 | 3 | 1 | 4 | 4 | 4 | 8 | -4 |
| 27 | The Chargers | 0-5 | 4 | 4 | 8 | 7 | 6 | 13 | -5 |
| 27 | New England | 3-2 | 3 | 3 | 6 | 7 | 4 | 11 | -5 |
| 27 | Atlanta | 2-3 | 1 | 3 | 4 | 7 | 2 | 9 | -5 |
| 27 | Tennessee | 0-5 | 2 | 0 | 2 | 3 | 4 | 7 | -5 |
| 31 | New Orleans | 1-4 | 1 | 4 | 5 | 5 | 6 | 11 | -6 |
| 31 | Indianapolis | 2-3 | 1 | 1 | 2 | 4 | 4 | 8 | -6 |
Where Turnovers and Records Disagree
Four teams have winning records despite giving the ball away more than they take it: Buffalo (4-1, -4), Chicago (3-2, -4), Cleveland (3-2, -1) and New England (3-2, -5, with 11 giveaways, 7 of them interceptions). Four have losing records with a positive margin: Washington (1-3-1, +5), Houston (1-4, +3), the Jets (2-3, +3) and Arizona (1-4, +2). At the bottom of the standings the two line up: the Chargers and Tennessee are both 0-5 at -5.
A margin that runs against the record is not a forecast in itself. As the history shows, the turnover margin over five games has said very little that the point margin did not already say, and the standings after week 5 set each record beside its points.
Week 6: Sunday and Monday by Turnover Margin
Seattle (+2) at Denver (+1) opens week 6 on Thursday night; the figures here end with week 5, and nothing on this page depends on Thursday's result. Cincinnati, Detroit, Miami and Minnesota have the week off. The other thirteen games, with both teams' margins through week 5:
| Day | Game | Away margin | Home margin | Gap |
|---|---|---|---|---|
| Sunday, London | Houston at Jacksonville | +3 | +5 | 2 |
| Sunday | Chicago at Atlanta | -4 | -5 | 1 |
| Sunday | Baltimore at Cleveland | +3 | -1 | 4 |
| Sunday | Tennessee at Indianapolis | -5 | -6 | 1 |
| Sunday | The Jets at New England | +3 | -5 | 8 |
| Sunday | New Orleans at the Giants | -6 | +1 | 7 |
| Sunday | Carolina at Philadelphia | +3 | -2 | 5 |
| Sunday | Pittsburgh at Tampa Bay | +2 | -2 | 4 |
| Sunday | Arizona at the Rams | +2 | -3 | 5 |
| Sunday | The Chargers at Kansas City | -5 | +5 | 10 |
| Sunday | Buffalo at the Raiders | -4 | +3 | 7 |
| Sunday | Dallas at Green Bay | -3 | +3 | 6 |
| Monday | Washington at San Francisco | +5 | +2 | 3 |
The widest gap is the Chargers (-5) at Kansas City (+5), 10 turnovers apart. The Jets (+3) at New England (-5) is next at 8, then New Orleans (-6) at the Giants (+1) and Buffalo (-4) at the Raiders (+3) at 7 each. The closest are Tennessee (-5) at Indianapolis (-6) and Chicago (-4) at Atlanta (-5), both 1 apart and both between two of the nine teams at -4 or worse.
How much should a gap like that count? In 4,071 regular-season games from 2003 to 2025 in which both teams had played at least five games, the team with the better turnover margin per game to date won .581 of the time (3,928 games where the margins differed). The team with the better point margin per game to date won .643 (4,059 games). When the two measures pointed at different teams, 1,060 times, the point-margin side won .616.
What a Five-Game Turnover Margin Has Been Worth
The test takes every team-season from 2003 to 2025, 736 of them, and sets each team's first five games against the rest of its season (11 or 12 games). The 2002 file is left out because it lacks Jacksonville's home games.
The five-game turnover margin correlates .18 with the same team's margin per game over the rest of the season. Its halves are a little steadier on their own, .25 for giveaways and .26 for takeaways, but the pieces show where the noise lives: interceptions thrown carry over at .18, interceptions made at .19, fumbles lost at .12, and opponents' fumbles recovered at .06, close to nothing.
The extremes give most of it back. The 91 teams at +6 or better after five games had averaged +1.52 a game and averaged +.27 over the rest of the season, keeping less than a fifth of the pace; they had won .766 of their first five games and won .607 of the rest. The 78 teams at -6 or worse went from -1.56 a game to -.11, and from .279 to .449.
On its own, the five-game turnover margin correlates .236 with the rest-of-season win share; the five-game point margin correlates .454. Fitted together, point margin carries .014 of win share per point of margin per game (standard error .001), and the turnover margin -.004 per turnover (.002): no positive weight at all once the scoreboard is known. Turnovers have already done their work in the points; what is left over is mostly noise.
What This Page Does Not Show
- Which turnovers. An interception returned for a touchdown and one on a fourth-down heave count the same here; expected points price the difference.
- Forced versus recovered. The table counts fumbles lost and recovered, not fumbles forced. Who falls on a loose ball is the least repeatable piece of all, as the .06 above shows.
- Opponents. Five games against careless or careful passers flatter or punish a defense, and nothing here adjusts for who was on the other side.
- Players and injuries. The counts are team totals. The page names no player and knows nothing about who was on the field.
Method and Sources
giveaways    = interceptions thrown + fumbles lost (all plays, special teams included)
takeaways    = the opponent's giveaways in the same game
margin       = takeaways - giveaways
history      = each team's first 5 regular-season games, 2003-2025, against its remaining 11 (to 2020) or 12 games
joint fit    = least squares of rest-of-season win share on 5-game point margin per game and 5-game turnover margin
game level   = games from each team's 6th on; margins per game to date for both teams; ties in the margin skipped
The script make_turnover_differential_week5_chart.py builds the margins from the team-game file, checks every 2026 team's interceptions and lost fumbles against the play-by-play and its games played against the standings data, computes the history, draws the exhibit and asserts every number on this page.
Sources: nflverse public team-game statistics release files (tag stats_team) for 2002-2026, read October 15, 2026 (the 2026 file as updated that morning, weeks 1-5 complete), and the 2026 play-by-play file as updated October 14; the nflverse game log for scores and the week-6 schedule, pulled October 15; the site's standings data, checked against ESPN's for all 32 teams.
Further reading
- Turnovers and Luck: why turnover margin decides games but does not repeat from year to year
- NFL Standings After Week 5: Records vs Point Differential: the same five games read from the scoreboard
- NFL EPA Rankings After Week 5: all 32 offenses and defenses per play
- NFL Playoff Picture After Week 5: what each week-6 game can move
- Power rankings: the site's Elo board after every graded game
Go deeper
Want the code behind these metrics? Work through the 43-chapter NFL analytics tutorial.
Browse tutorials Free tools