Who leads each NFL division in 2026, and how safe are the leads?
Through Thursday of week 6, all eight divisions have a sole leader: Buffalo, Baltimore, Jacksonville and Kansas City in the AFC, the Giants, Minnesota, Carolina and San Francisco in the NFC. San Francisco's lead is the widest at 2.5 games; Carolina's the narrowest at half a game. Since 2002, a team alone in first after week 5 went on to win its division 101 times in 150 (.673), and teams that led by two games or more won 26 of 32.
Related: 2026 standings · Standings after week 5: records vs point differential
Standings from the nflverse game log as pulled at 1:20 am ET on October 16, 2026 (80 games, including Denver's 17-14 win over Seattle on Thursday), matched team by team against the site's week-5 standings; history from 2002-2025.
Eight Leaders, Eight Different Cushions
Games behind is the plainest measure of a division race: half the leader's edge in wins plus half its edge in losses, with a tie counted as half of each. It lets teams with different numbers of games sit on one scale, which matters this week. Kansas City and Carolina have played four games after early byes; Denver and Seattle six after Thursday night.
Two leads are already wide. San Francisco, 5-0, is 2.5 games clear of Seattle, whose loss in Denver moved it from two games back to two and a half. Minnesota, also 5-0, is two clear of a three-way tie at 3-2 between Chicago, Detroit and Green Bay, and Jacksonville is two ahead of Indianapolis. At the other end, Carolina, 2-2, leads Atlanta by half a game in a division where nobody has a winning record, and the Giants, 3-1-1, lead Dallas and Philadelphia by a game and a half.
In all eight divisions the leader also has the division's best point differential, so this year there is no race where the record and the scoreboard point at different teams. That has not been the usual picture: since 2002, 107 of the 150 sole leaders after week 5 were also alone at the top in point differential.
The Exhibit
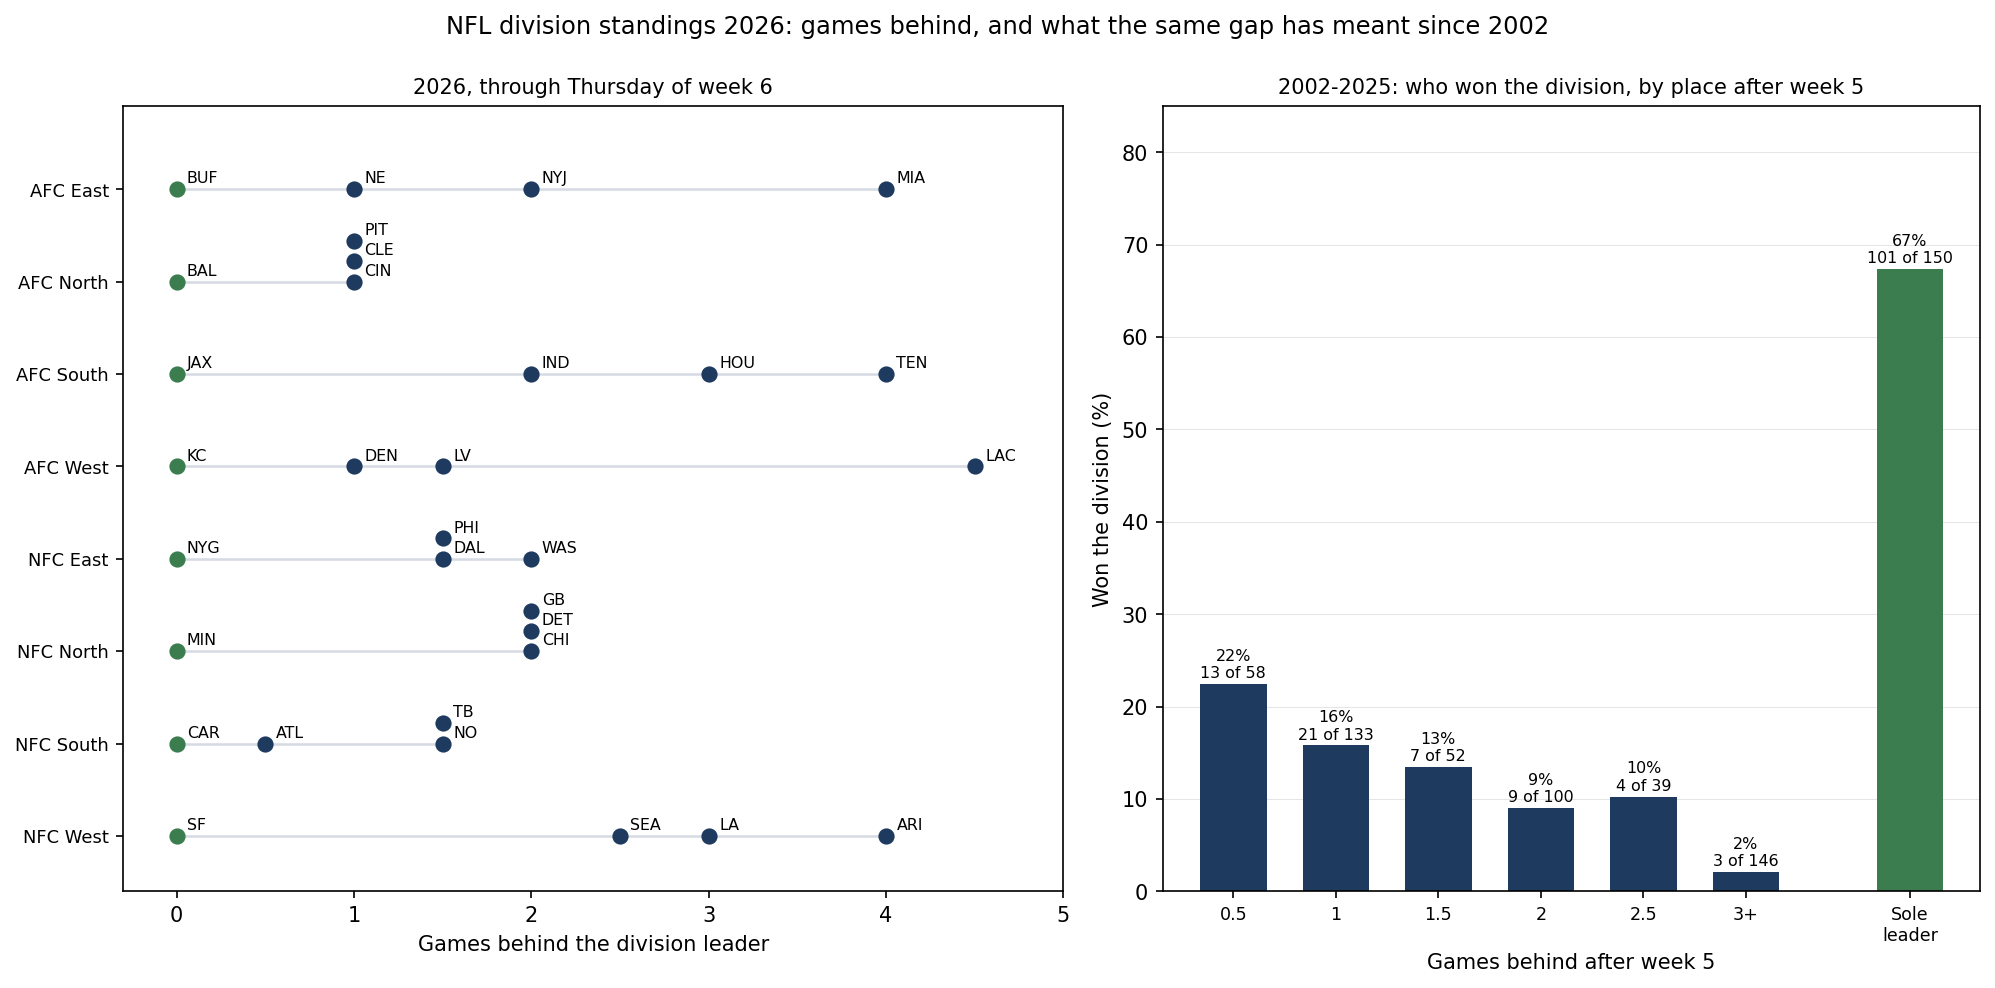
NFL Division Standings 2026, by Games Behind
Through Thursday of week 6. GB is games behind the leader; Div is the record in division games, the second step of the tiebreaker after head-to-head. The last column gives, for each team's position, how many teams in the same spot after week 5 won the division from 2002 to 2025.
AFC East
| Team | W-L-T | GB | Point diff. | Div | Same spot after week 5, 2002-2025 |
|---|---|---|---|---|---|
| Buffalo | 4-1 | - | +23 | 0-1 | 42 of 62 leaders by 1 game won |
| New England | 3-2 | 1 | +16 | 1-0 | 21 of 133 won |
| The Jets | 2-3 | 2 | -3 | 0-0 | 9 of 100 won |
| Miami | 0-5 | 4 | -62 | 0-0 | 3 of 146 won |
AFC North
| Team | W-L-T | GB | Point diff. | Div | Same spot after week 5, 2002-2025 |
|---|---|---|---|---|---|
| Baltimore | 4-1 | - | +27 | 0-0 | 42 of 62 leaders by 1 game won |
| Cincinnati | 3-2 | 1 | +19 | 0-1 | 21 of 133 won |
| Pittsburgh | 3-2 | 1 | +2 | 1-1 | 21 of 133 won |
| Cleveland | 3-2 | 1 | -19 | 1-0 | 21 of 133 won |
AFC South
| Team | W-L-T | GB | Point diff. | Div | Same spot after week 5, 2002-2025 |
|---|---|---|---|---|---|
| Jacksonville | 4-1 | - | +53 | 0-0 | 26 of 32 leaders by 2 or more games won |
| Indianapolis | 2-3 | 2 | -14 | 1-0 | 9 of 100 won |
| Houston | 1-4 | 3 | -2 | 1-1 | 3 of 146 won |
| Tennessee | 0-5 | 4 | -51 | 0-1 | 3 of 146 won |
AFC West
| Team | W-L-T | GB | Point diff. | Div | Same spot after week 5, 2002-2025 |
|---|---|---|---|---|---|
| Kansas City | 4-0 | - | +41 | 2-0 | 42 of 62 leaders by 1 game won |
| Denver | 4-2 | 1 | -11 | 1-1 | 21 of 133 won |
| The Raiders | 3-2 | 1.5 | +3 | 1-1 | 7 of 52 won |
| The Chargers | 0-5 | 4.5 | -45 | 0-2 | 3 of 146 won |
NFC East
| Team | W-L-T | GB | Point diff. | Div | Same spot after week 5, 2002-2025 |
|---|---|---|---|---|---|
| The Giants | 3-1-1 | - | +3 | 1-0-1 | 14 of 19 leaders by 1.5 games won |
| Dallas | 2-3 | 1.5 | +2 | 1-1 | 7 of 52 won |
| Philadelphia | 2-3 | 1.5 | -20 | 1-0 | 7 of 52 won |
| Washington | 1-3-1 | 2 | -34 | 0-2-1 | 9 of 100 won |
NFC North
| Team | W-L-T | GB | Point diff. | Div | Same spot after week 5, 2002-2025 |
|---|---|---|---|---|---|
| Minnesota | 5-0 | - | +45 | 2-0 | 26 of 32 leaders by 2 or more games won |
| Chicago | 3-2 | 2 | +23 | 0-2 | 9 of 100 won |
| Detroit | 3-2 | 2 | +16 | 0-0 | 9 of 100 won |
| Green Bay | 3-2 | 2 | -8 | 1-1 | 9 of 100 won |
NFC South
| Team | W-L-T | GB | Point diff. | Div | Same spot after week 5, 2002-2025 |
|---|---|---|---|---|---|
| Carolina | 2-2 | - | +12 | 1-0 | 19 of 37 leaders by half a game won |
| Atlanta | 2-3 | 0.5 | -3 | 1-1 | 13 of 58 won |
| Tampa Bay | 1-4 | 1.5 | -12 | 0-0 | 7 of 52 won |
| New Orleans | 1-4 | 1.5 | -33 | 0-1 | 7 of 52 won |
NFC West
| Team | W-L-T | GB | Point diff. | Div | Same spot after week 5, 2002-2025 |
|---|---|---|---|---|---|
| San Francisco | 5-0 | - | +61 | 3-0 | 26 of 32 leaders by 2 or more games won |
| Seattle | 3-3 | 2.5 | +26 | 1-1 | 4 of 39 won |
| The Rams | 2-3 | 3 | -1 | 0-1 | 3 of 146 won |
| Arizona | 1-4 | 4 | -54 | 0-2 | 3 of 146 won |
What a Lead After Five Weeks Has Been Worth
The history takes in every season of the eight-division era, 2002 to 2025: 192 division races. Standings are taken from all games in weeks 1 through 5, and each division winner is the team the official tiebreakers produce from the full season (23 titles in the window needed them).
A team alone in first after week 5 won the division 101 times in 150, a rate of .673. Where two or more teams shared first, 42 times, one of them won 34 times. The size of the lead mattered about as much as the lead itself:
- half a game: 19 of 37 leaders won, close to a coin toss;
- one game: 42 of 62;
- a game and a half: 14 of 19;
- two games or more: 26 of 32.
From behind, the climb gets steep quickly. Teams half a game back won 13 of 58 times, a game back 21 of 133, two games back 9 of 100, and three or more games back 3 of 146. In all, 16 division winners were two games or more behind after week 5. The three from three games or more back were the 2002 Jets, the 2011 Broncos and the 2013 Panthers, who started 1-3, sat 3.5 games behind New Orleans and won the NFC South.
One more split separates the record from the scoreboard. In 38 seasons the sole record leader after week 5 and the sole leader in point differential were different teams. The record leader won the division 20 times and the point-differential leader 8 (someone else won the other 10). That looks like the opposite of what the standings after week 5 found, where point differential predicted the rest of a season's results better than the record did. Both hold: point differential says more about how a team will play from here, but a division title counts the wins already banked, and five weeks of banked wins is a real head start.
Week 6: The Division Games
Six of Sunday's games are inside a division, and three involve a leader. Jacksonville plays Houston in London, Baltimore goes to Cleveland, and Kansas City hosts the Chargers, 4.5 games back. New England and Indianapolis, both second in their divisions, are at home to division rivals.
| Day | Game | Division | Away GB | Home GB |
|---|---|---|---|---|
| Sunday, London | Houston at Jacksonville | AFC South | 3 | - |
| Sunday | Baltimore at Cleveland | AFC North | - | 1 |
| Sunday | The Jets at New England | AFC East | 2 | 1 |
| Sunday | Tennessee at Indianapolis | AFC South | 4 | 2 |
| Sunday | Arizona at the Rams | NFC West | 4 | 3 |
| Sunday | The Chargers at Kansas City | AFC West | 4.5 | - |
A division game moves a race twice: the winner gains a game on the loser in the standings, and the result counts in the division record, the second tiebreaker between division rivals after head-to-head. The division leverage explainer measures what a division win is worth beyond the standings.
What This Page Does Not Show
- Schedules ahead. The history treats every two-game lead alike, whether the leader's remaining games are hard or easy. The remaining schedule page deals with that.
- Wild cards. A team out of its division race can still make the playoffs as one of three wild cards per conference; this page is only about division titles.
- Head-to-head. Ties between division rivals are broken first by their games against each other, and most of those have not been played yet.
- A forecast. These are historical rates for a position, not a prediction for any team. Thursday's game is in the 2026 standings, while the history is taken after week 5, so Seattle and Denver are compared one game later than everyone else.
Method and Sources
games behind  = ((leader W - team W) + (team L - leader L)) / 2, ties counted half a win and half a loss
sole leader   = the only team in its division at 0 games behind
history       = standings from every regular-season game in weeks 1-5, 2002-2025 (192 division races)
winner        = full-season standings with the official division tiebreakers (head-to-head, division record,
                common games, conference record, strength of victory, strength of schedule)
franchises    = SD -> LAC, STL -> LA, OAK -> LV
The script make_division_games_behind_chart.py rebuilds the 2026 standings from the game log, checks every team's week-5 record, points and division record against the site's standings, computes the history, draws the exhibit and asserts every number on this page.
Sources: the nflverse game log for 2002-2026, pulled 1:20 am ET on October 16, 2026 (the 2002-2025 rows identical to the site's stored copy); the site's 2026 standings after week 5, checked against ESPN's for all 32 teams when they were built.
Further reading
- 2026 NFL Standings: the full table, updated after every game
- NFL Standings After Week 5: Records vs Point Differential: which records are ahead of their scoring
- Do NFL Division Winners Repeat?: the same 2002-2025 division races, year to year
- Division leverage: what a division win is worth
- 2026 playoff chances: every team's chances to make the playoffs and win its division
Go deeper
Want the code behind these metrics? Work through the 43-chapter NFL analytics tutorial.
Browse tutorials Free tools